¶ The Basics of Soft Matters
Soft condensed matter is a convenient term for materials that are in the 'middle ground' between simple liquid and crystalline solids
- These materials seem to behave in a way that is neither entirely solid-like nor entirely liquid-like, they are viscoelastic
¶ Putting the Soft in Soft Matter
Many materials can be classified as soft matter. but the materials that are usually of particular interest are polymers, colloids, liquid crystals, surfactants, and other mesoscocpic consistitutes
- To truly understand what makes soft matter soft matter, we shall delve into the common characteristics of these materials and what is the chemistry that gives such characteristics to them
Polymers
Polymers are a mix of macromolecules that are made of monomers
- The number of monomers in a polymer is typically several thousands, and can be as large as tens of millions
- Depending on the chemical structure of the monomers and how they are put together, polymeric materials can have a variety of properties, ranging from soft rubbers to hard plastics
Colloids
Colloids are small solid particles or fluid droplets dispersed in other fluid
- The diameter of colloids is typically in the range of 1 all the way to 1, which is much larger than the size of atoms
Colloidal suspensions made of solid particles can have a variety of property depending on the concentration of colloids
- The suspension is fluid-like when the concentration is low, but cease to flow when the particle concentration is too high
- The fluid-like state is called "sol", while the solid-like state is called "gel"
Surfactants
Surfactants are substances which reduces the surface tension of a liquid in which it is dissolved
- In the context of soft matter, we are particularly interested in their ability in forming micelles and inverted micelles
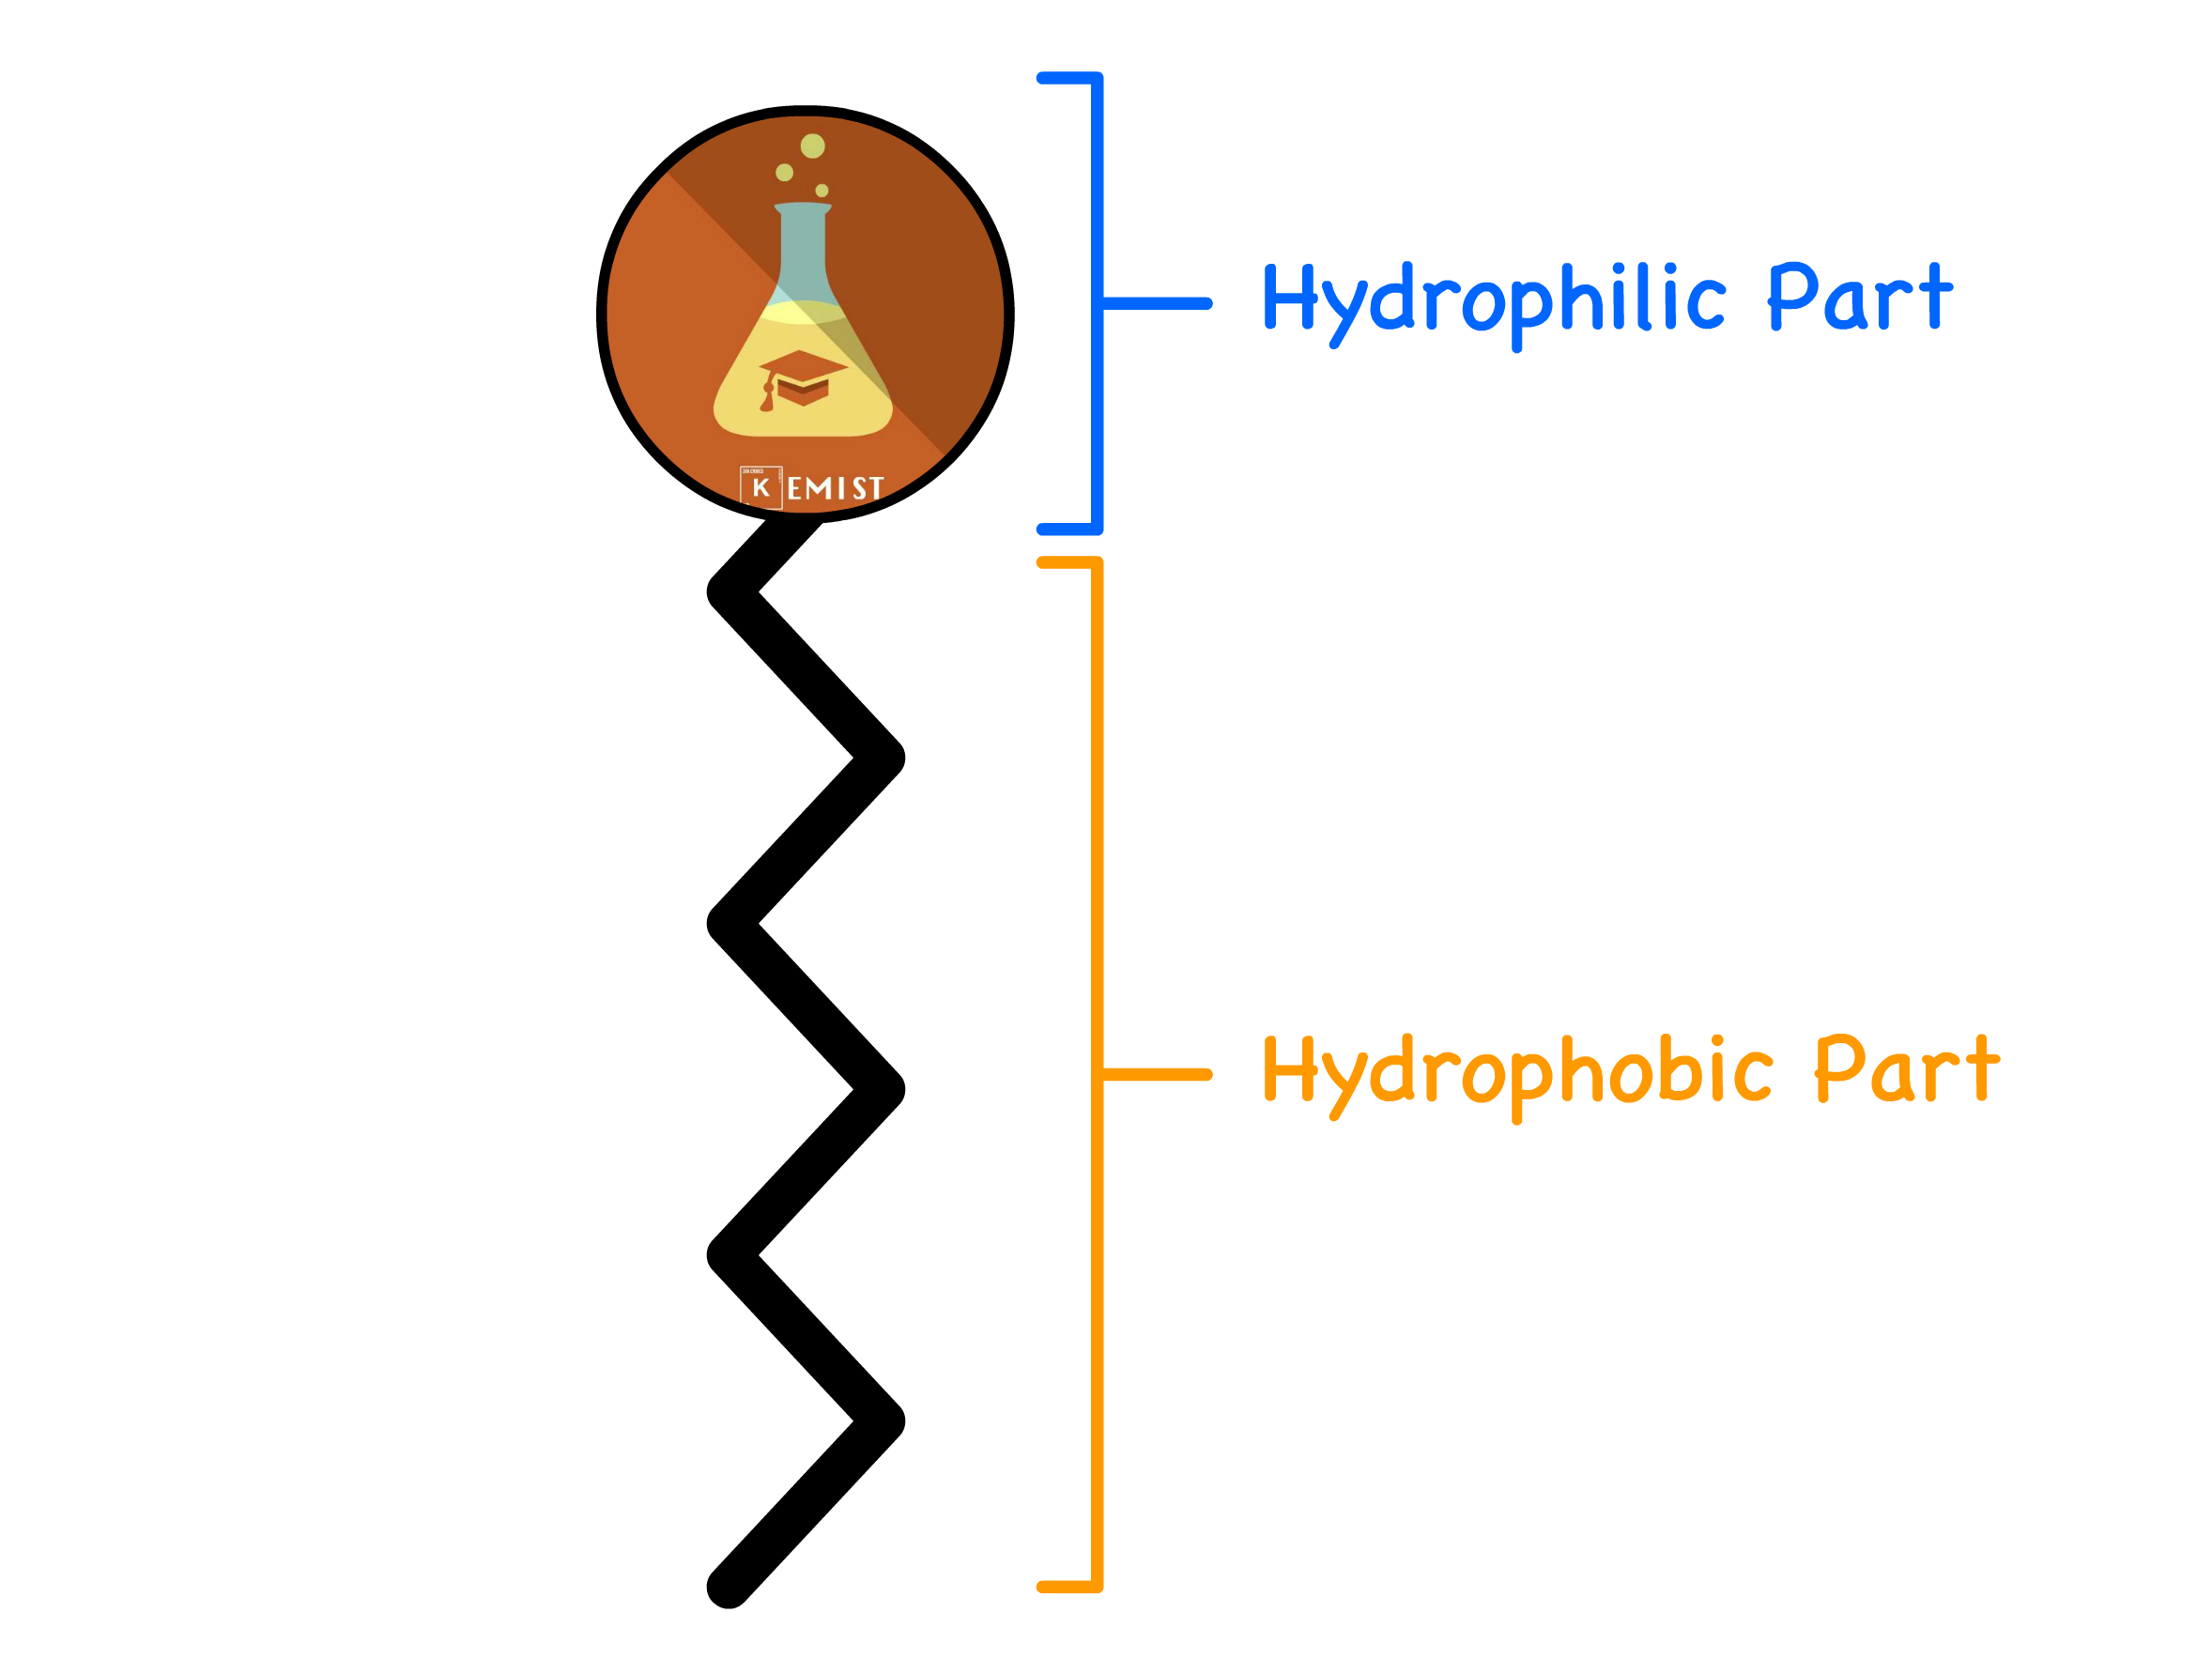
A typical surfactant molecule has a hydrophobic group and a hydrophilic group
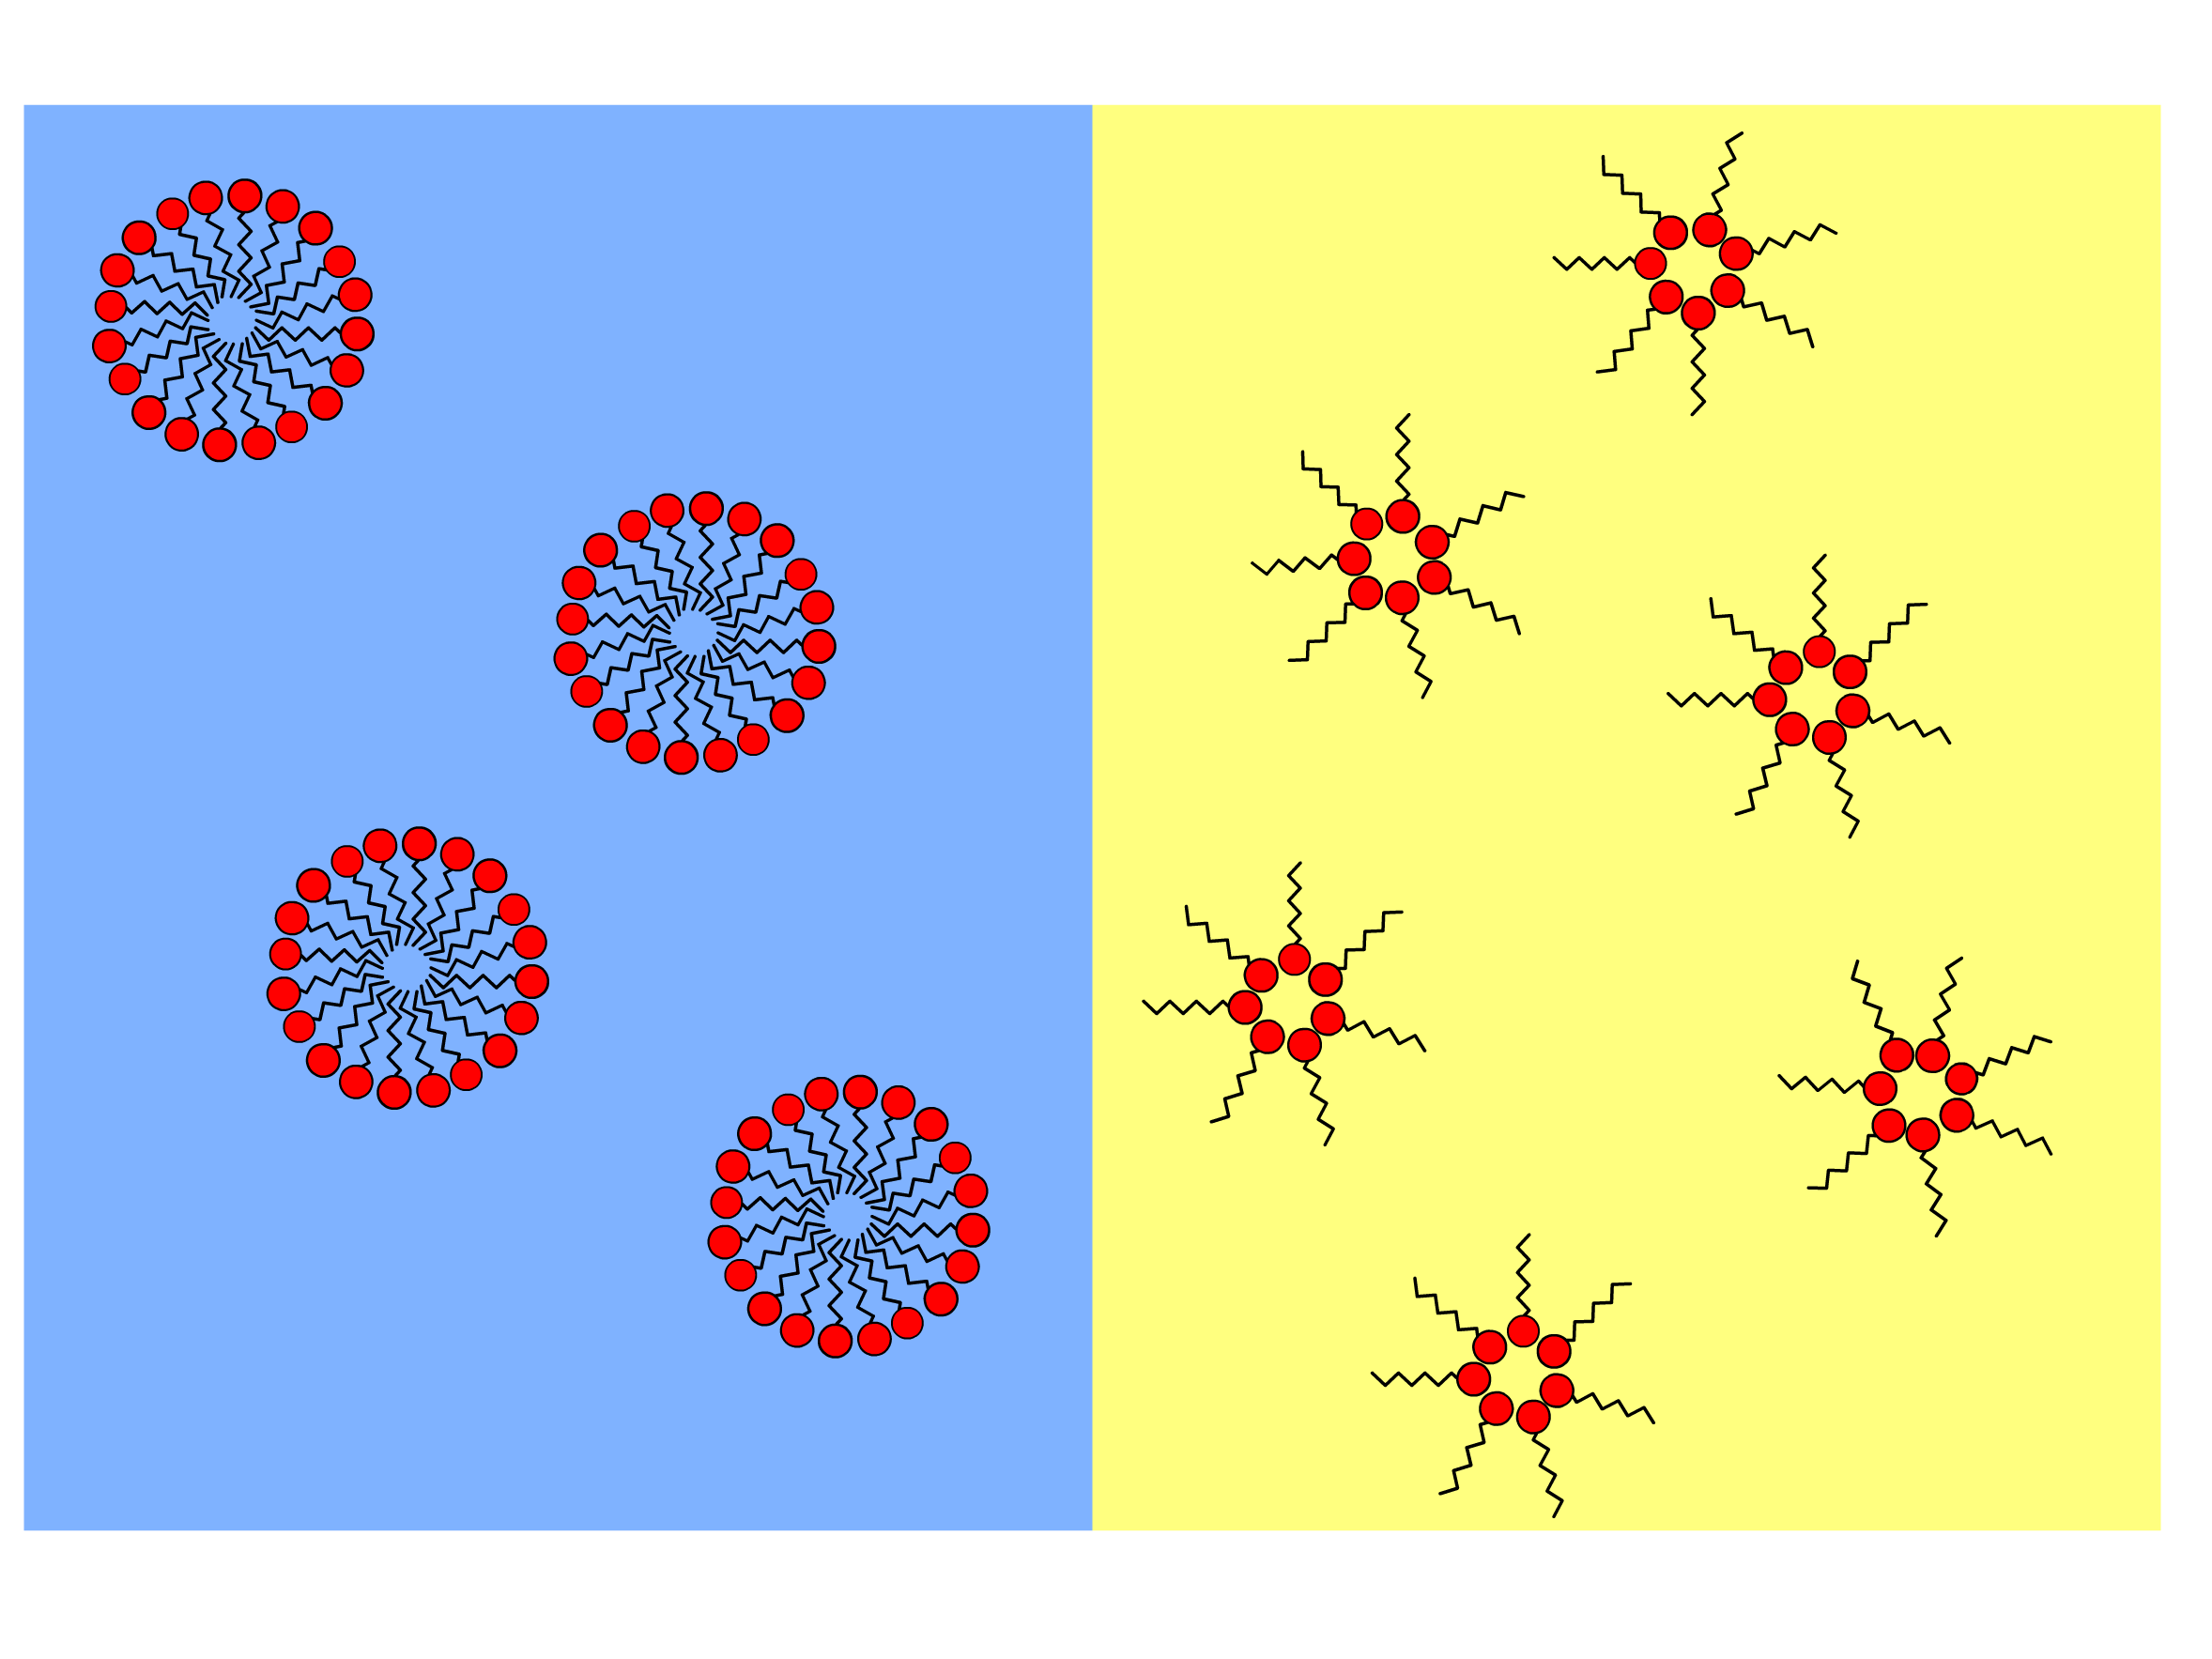
- Due to this unique structure, they will assemble into micelle and inverted micelles when dissolved in aqueous solution and oil respectively
- The micelles can contain a large number of surfactant molecules, as large as millions or even billions of molecules
Liquid Crystals
Liquid crystals are materials where molecules form a semi-ordered state between crystal and liquid
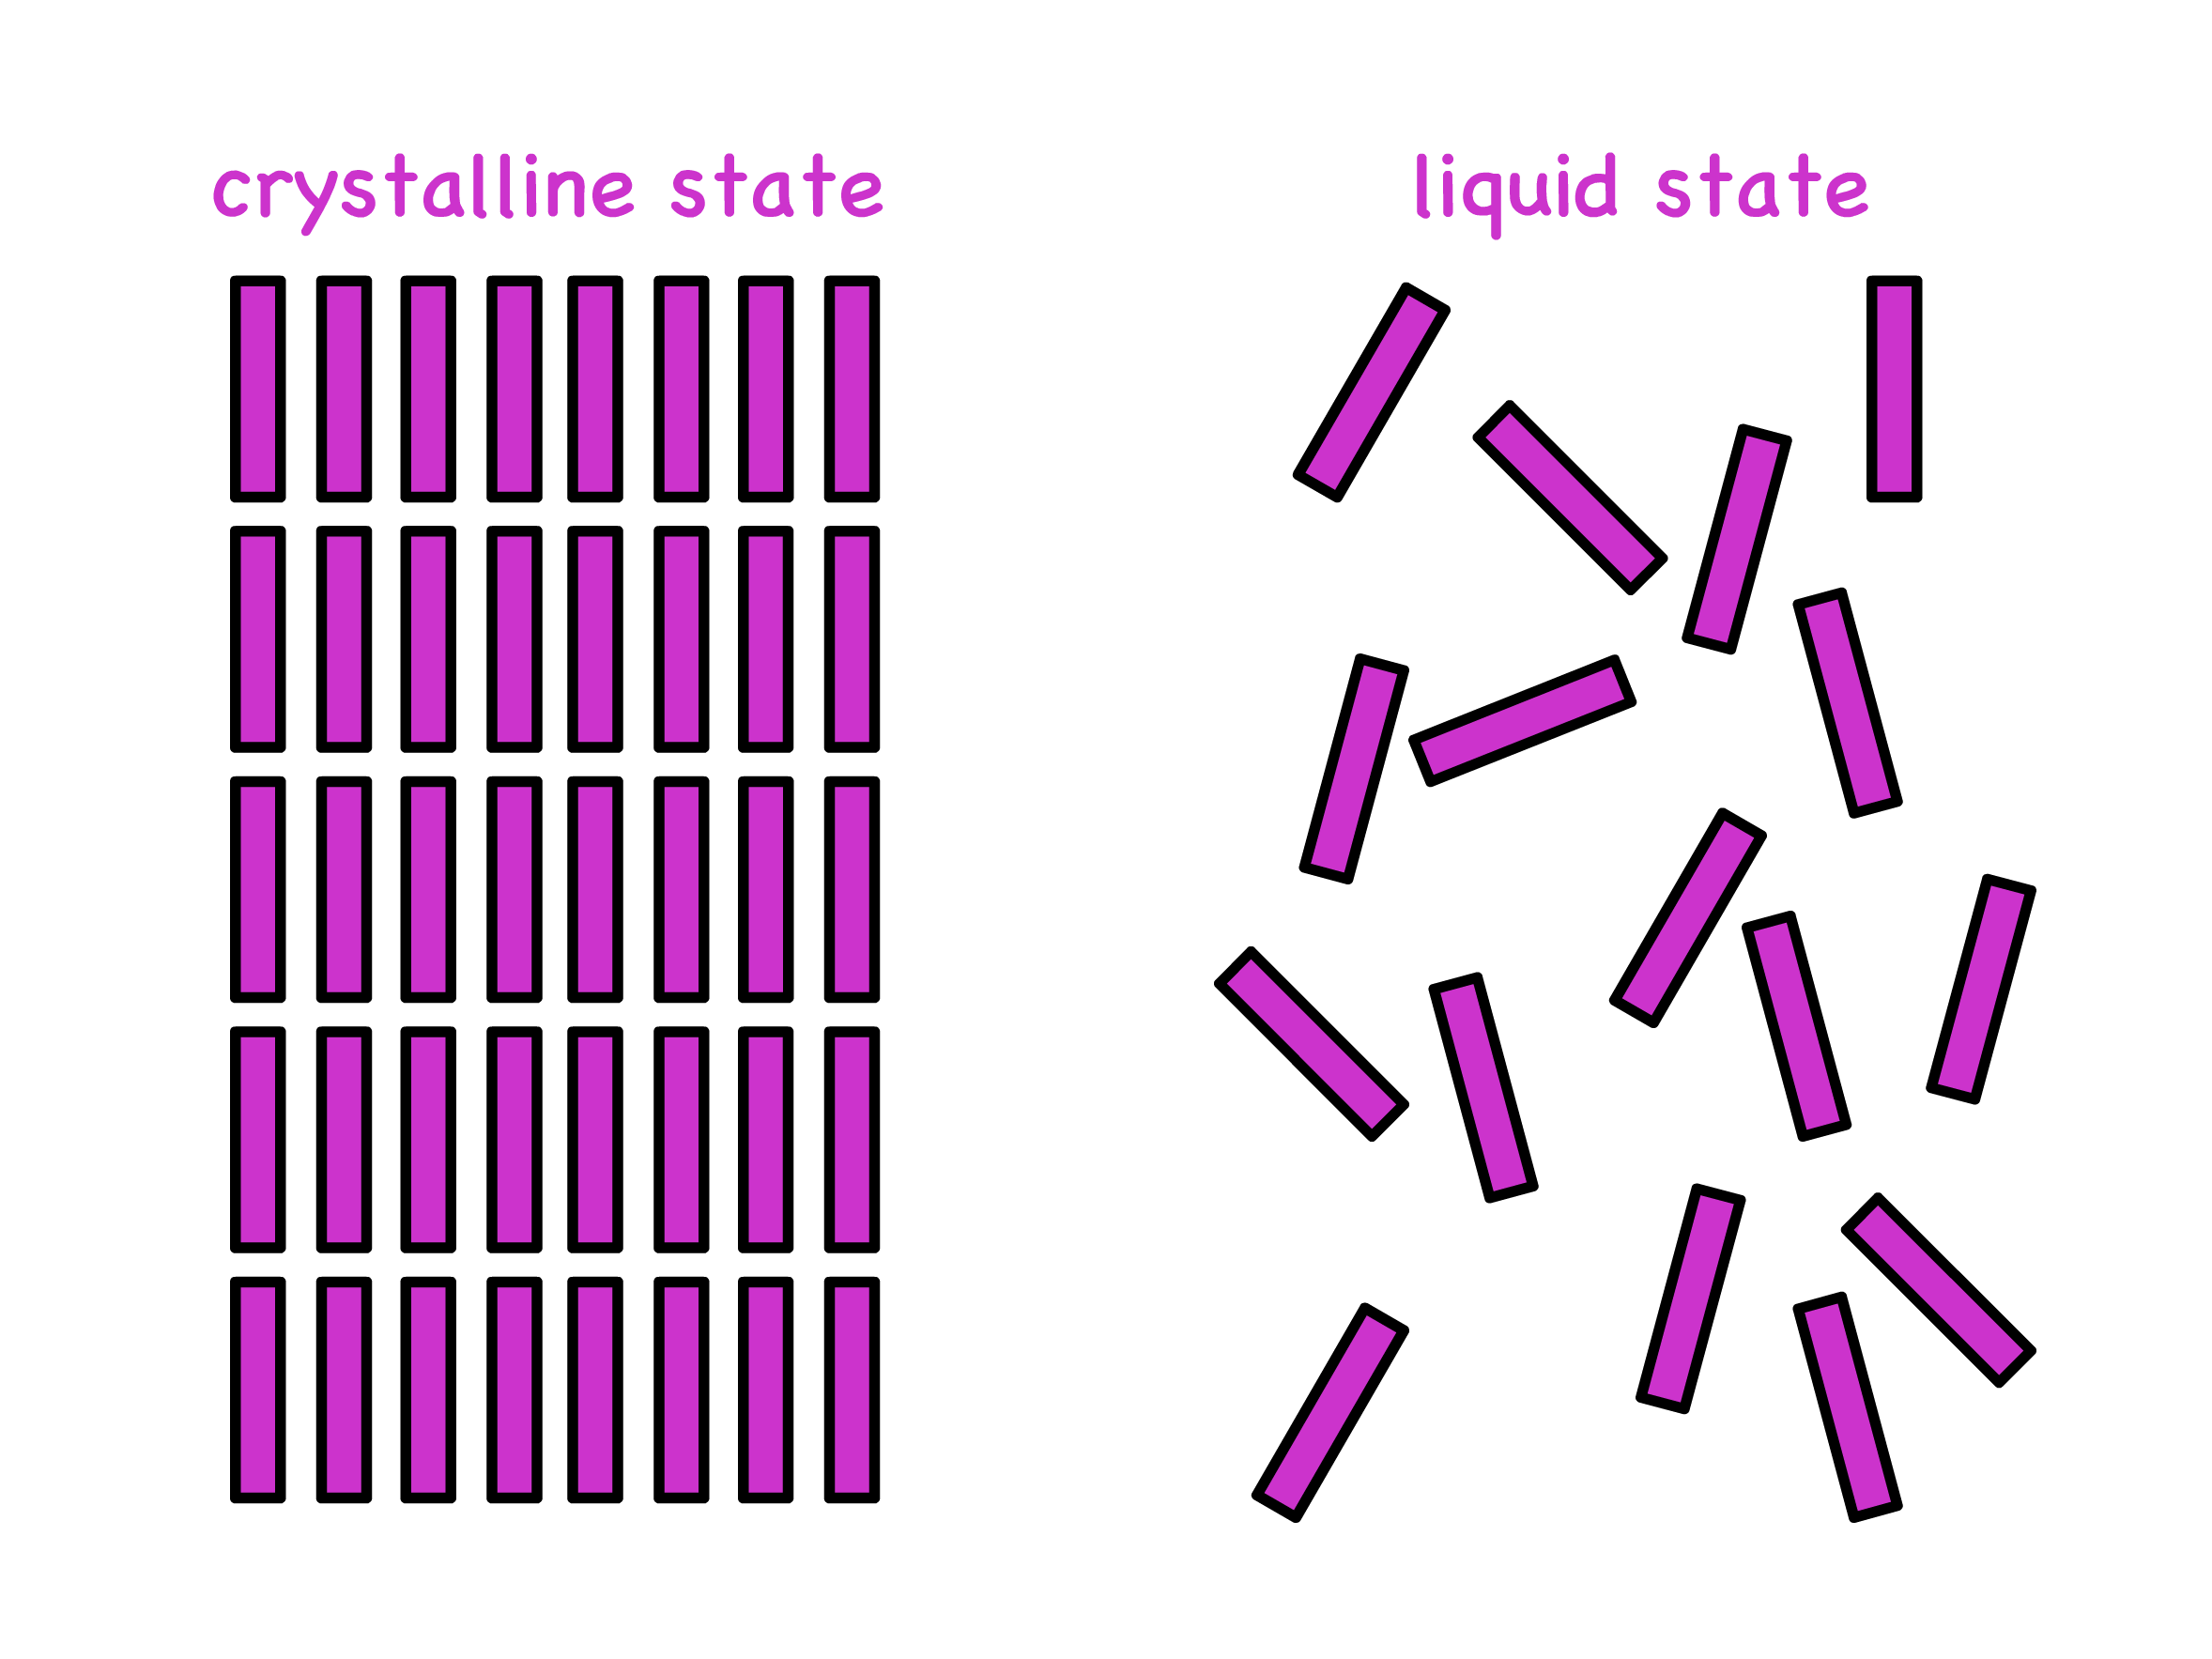
- Molecules are packed orderedly in crystalline state and are arranged randomly in liquid state
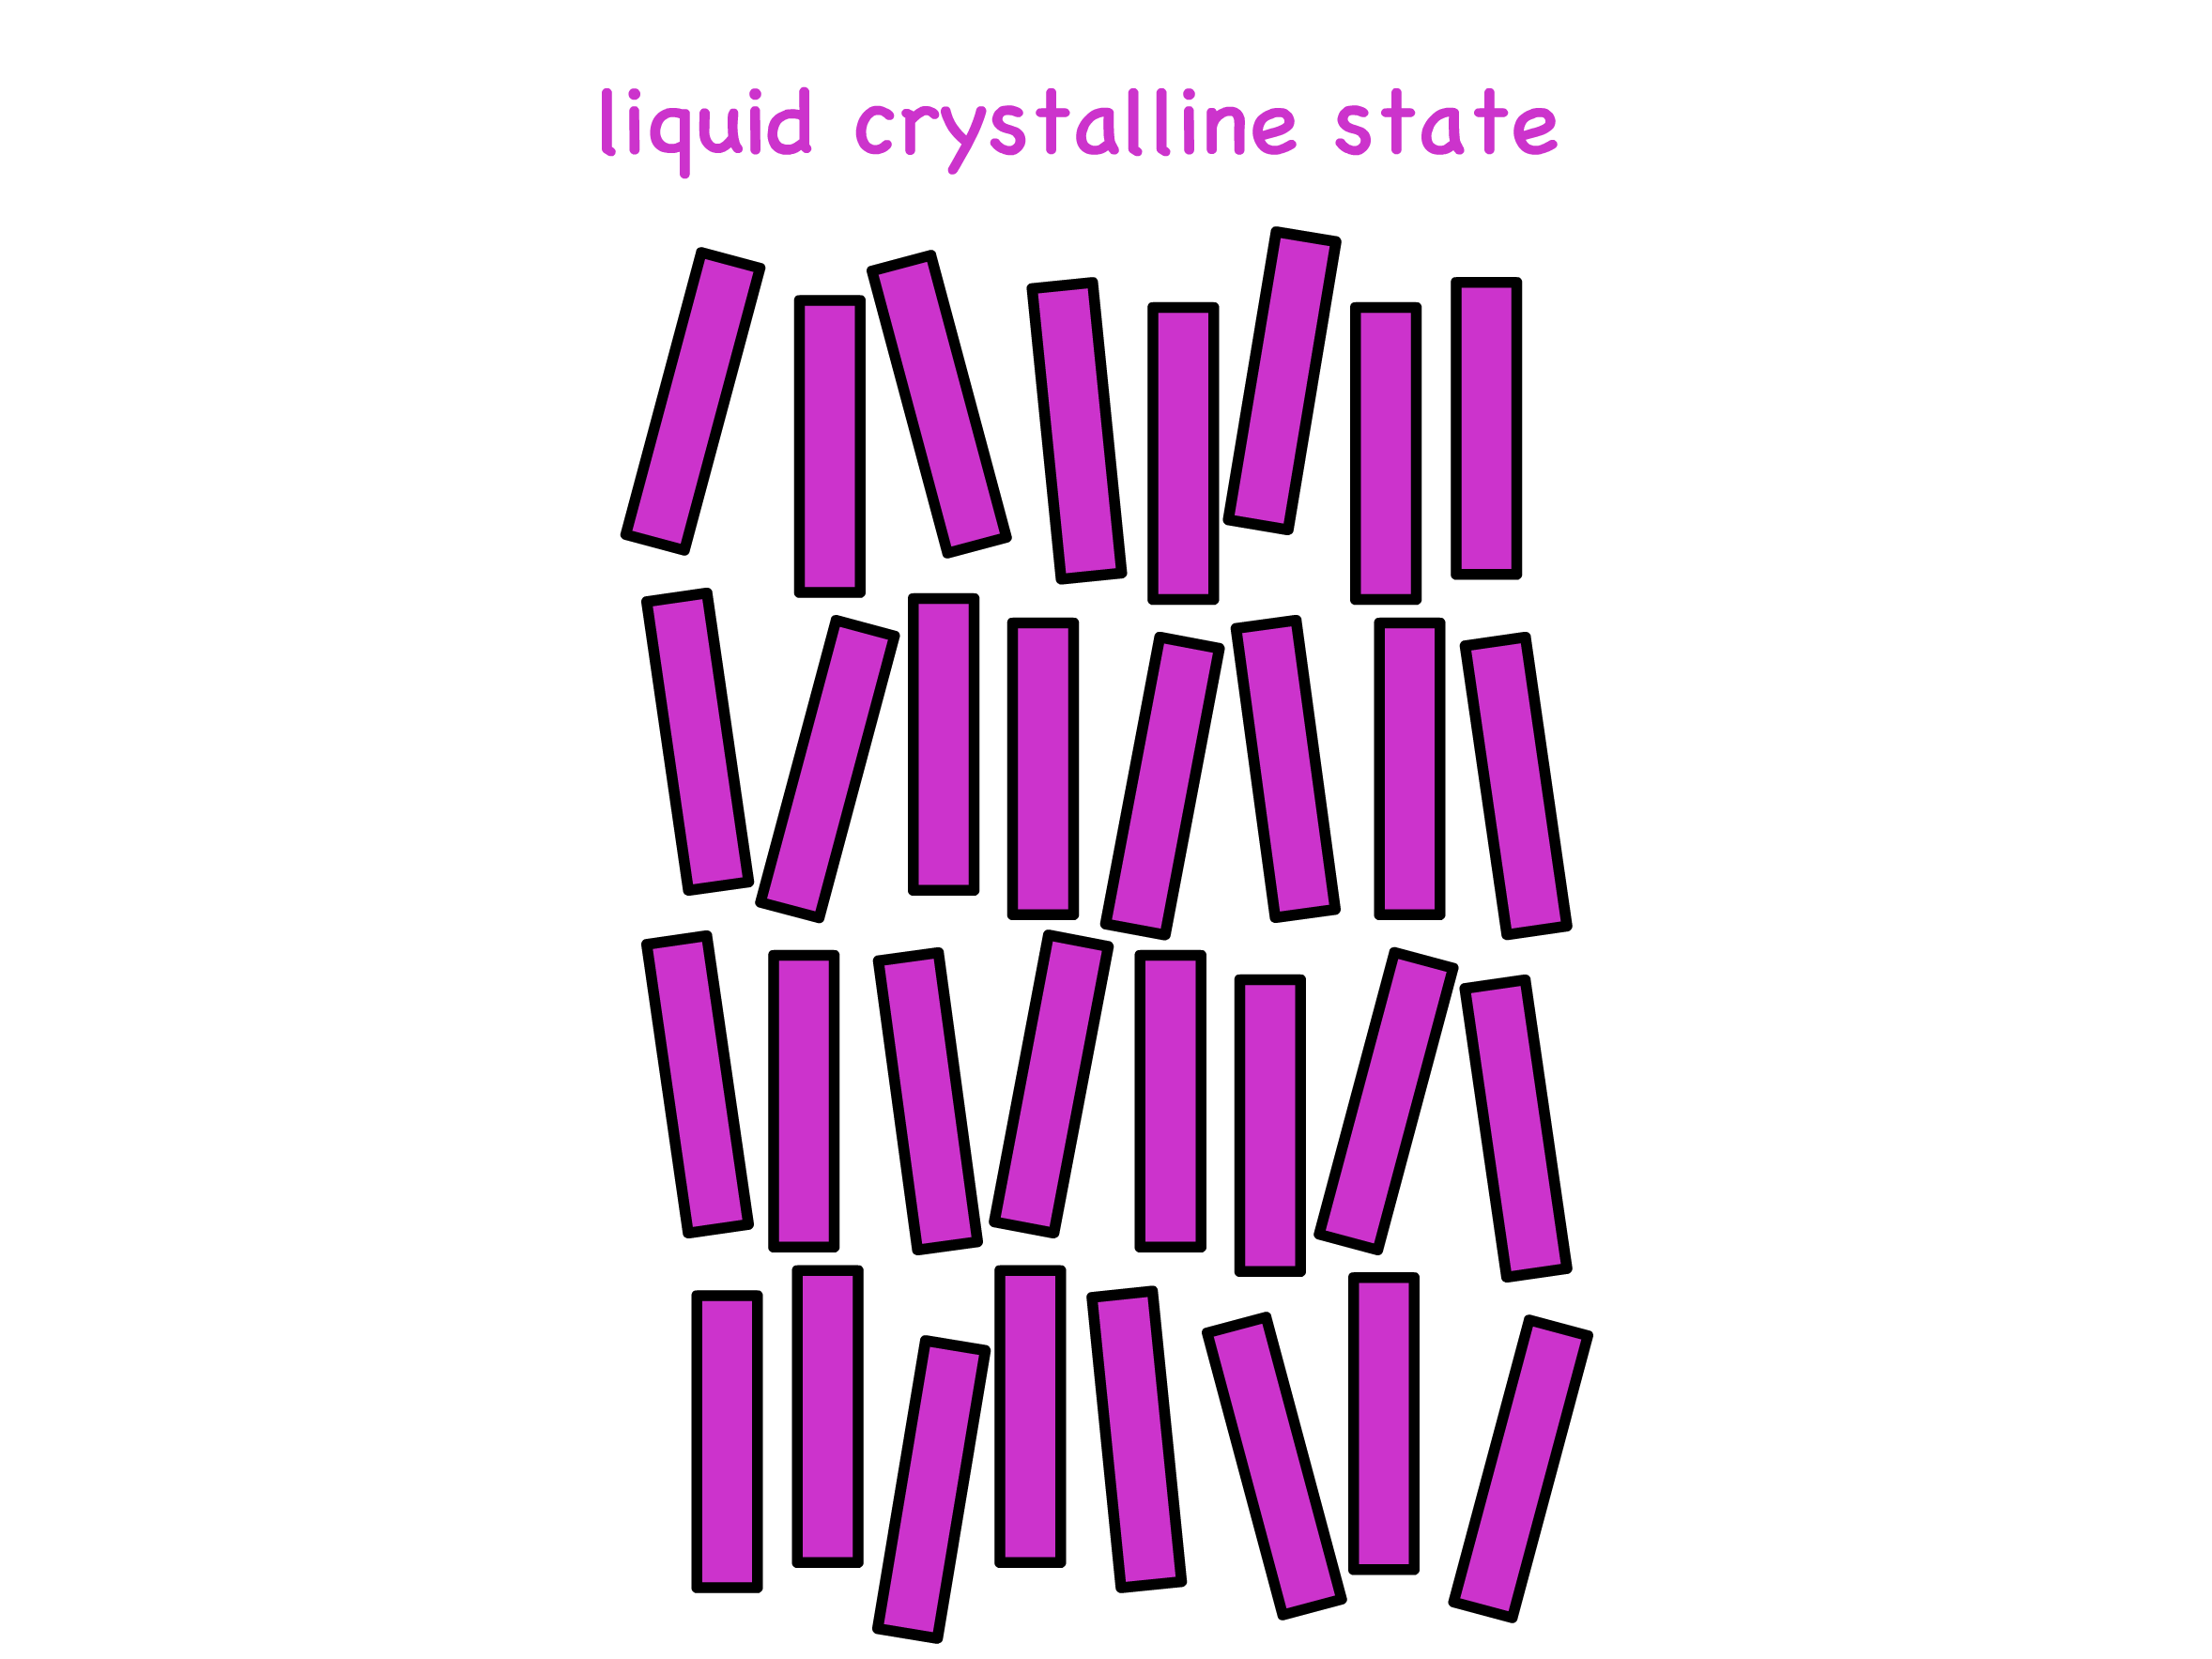
- In the liquid crystalline state, the molecules are intermediately ordered between these two states
Liquid crystal forms ordered structure and move together in a large unit
- Moreover, such movement can be controlled with relatively small electric field
The Common Characteristic
The examples of soft matter includes a large class of materials that are seemingly unconnected, but they all share one key characteristics
- What is common in all of them is that they are not atomic or molecular in nature. They are instead macromolecular aggregates where the structural units lies in the domain 1 nm to 1 micron
- Polymer molecules and colloidal particles typically consist of millions of atoms ; Molecules that make up surfactant and liquid crystals are not big, but they form ordered structures and move together as a large unit
The fact that soft matter consists of large molecule or assemblies of molecules give rise to a few unique properties
1. Large and disproportional response
- Soft matter shows a large response to small perturbations
- Rubbers and gels are easily deformed, the optical properties of liquid crystal can be change by applying a weak electric field
2. Slow and non-equilibrium response
- The collectivity of soft matter slows down their dynamics
- Consequently, the properties and dynamics of the non-equilibrium state is quite significant
3. Fluctuations and Brownian Motion
- Although typical structures in soft matter are larger than atomic sizes, they are small enough where the typical bond energies between structural units is comparable in size to thermal energies
- As a result, soft matter system are still heavily influenced by random Brownian motions
4. Spontaneous Self-Assembly
- Interactions between building blocks of soft matter are relatively weak, so the subtle balance between entropy and energy yields rich phase behaviour in which complex structures arise spontaneously
- Structures of tremendous intricacy and complexity are put together without external intervention, driven soley by the second law of thermodynamics
- An important point to note is that durng self-assembly, such as the folding of protein or the formation of micelles from surfactant, the molecule becomes more ordered and the local entropy decreases, however, the entropy of the entire system must increase by the second law
¶ Mechanical Properties of Soft Matter
One way to define whether a material is solid or liquid is by utilizing the concept of shear
- Since soft matter exists as a chimera of crystalline solid and simple liquid, we expect its response to sheer stress to be a mix a both as well
Before we delve into how each material behave differently to shear stress, it is important to recall some definitions
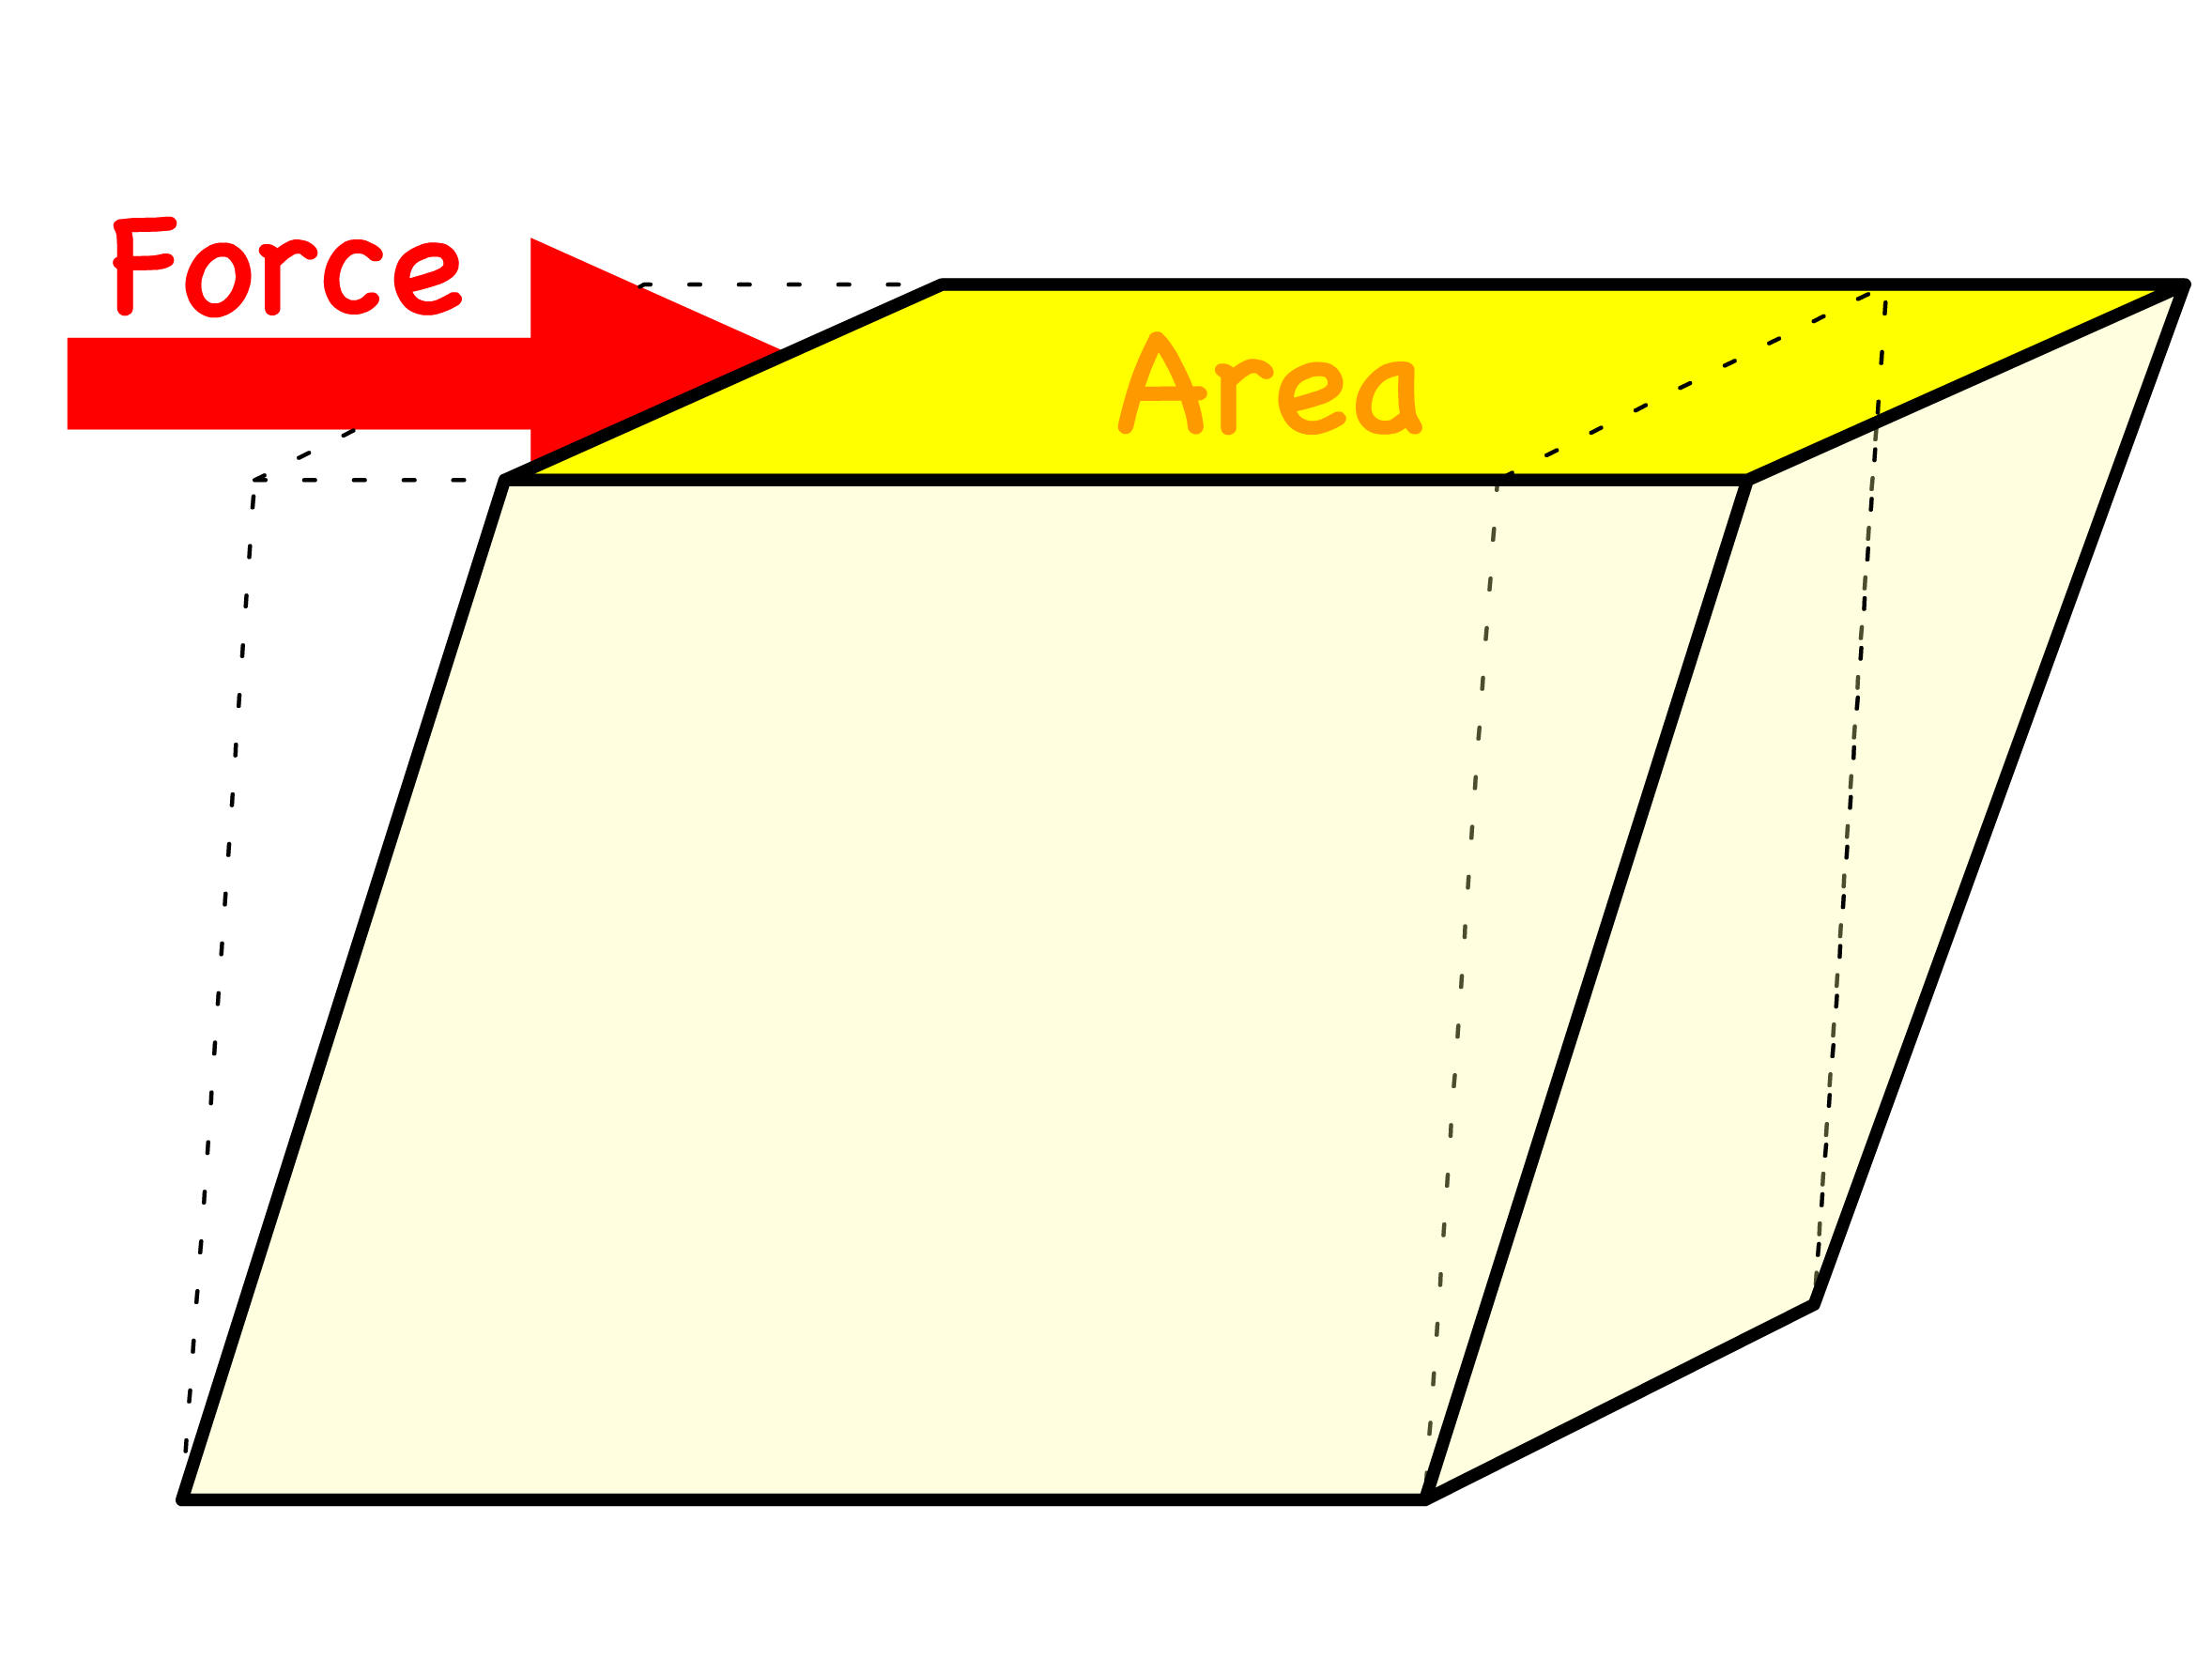
- Shear stress, , is defined as the force per unit area that is created when a tangential force acts on a surface
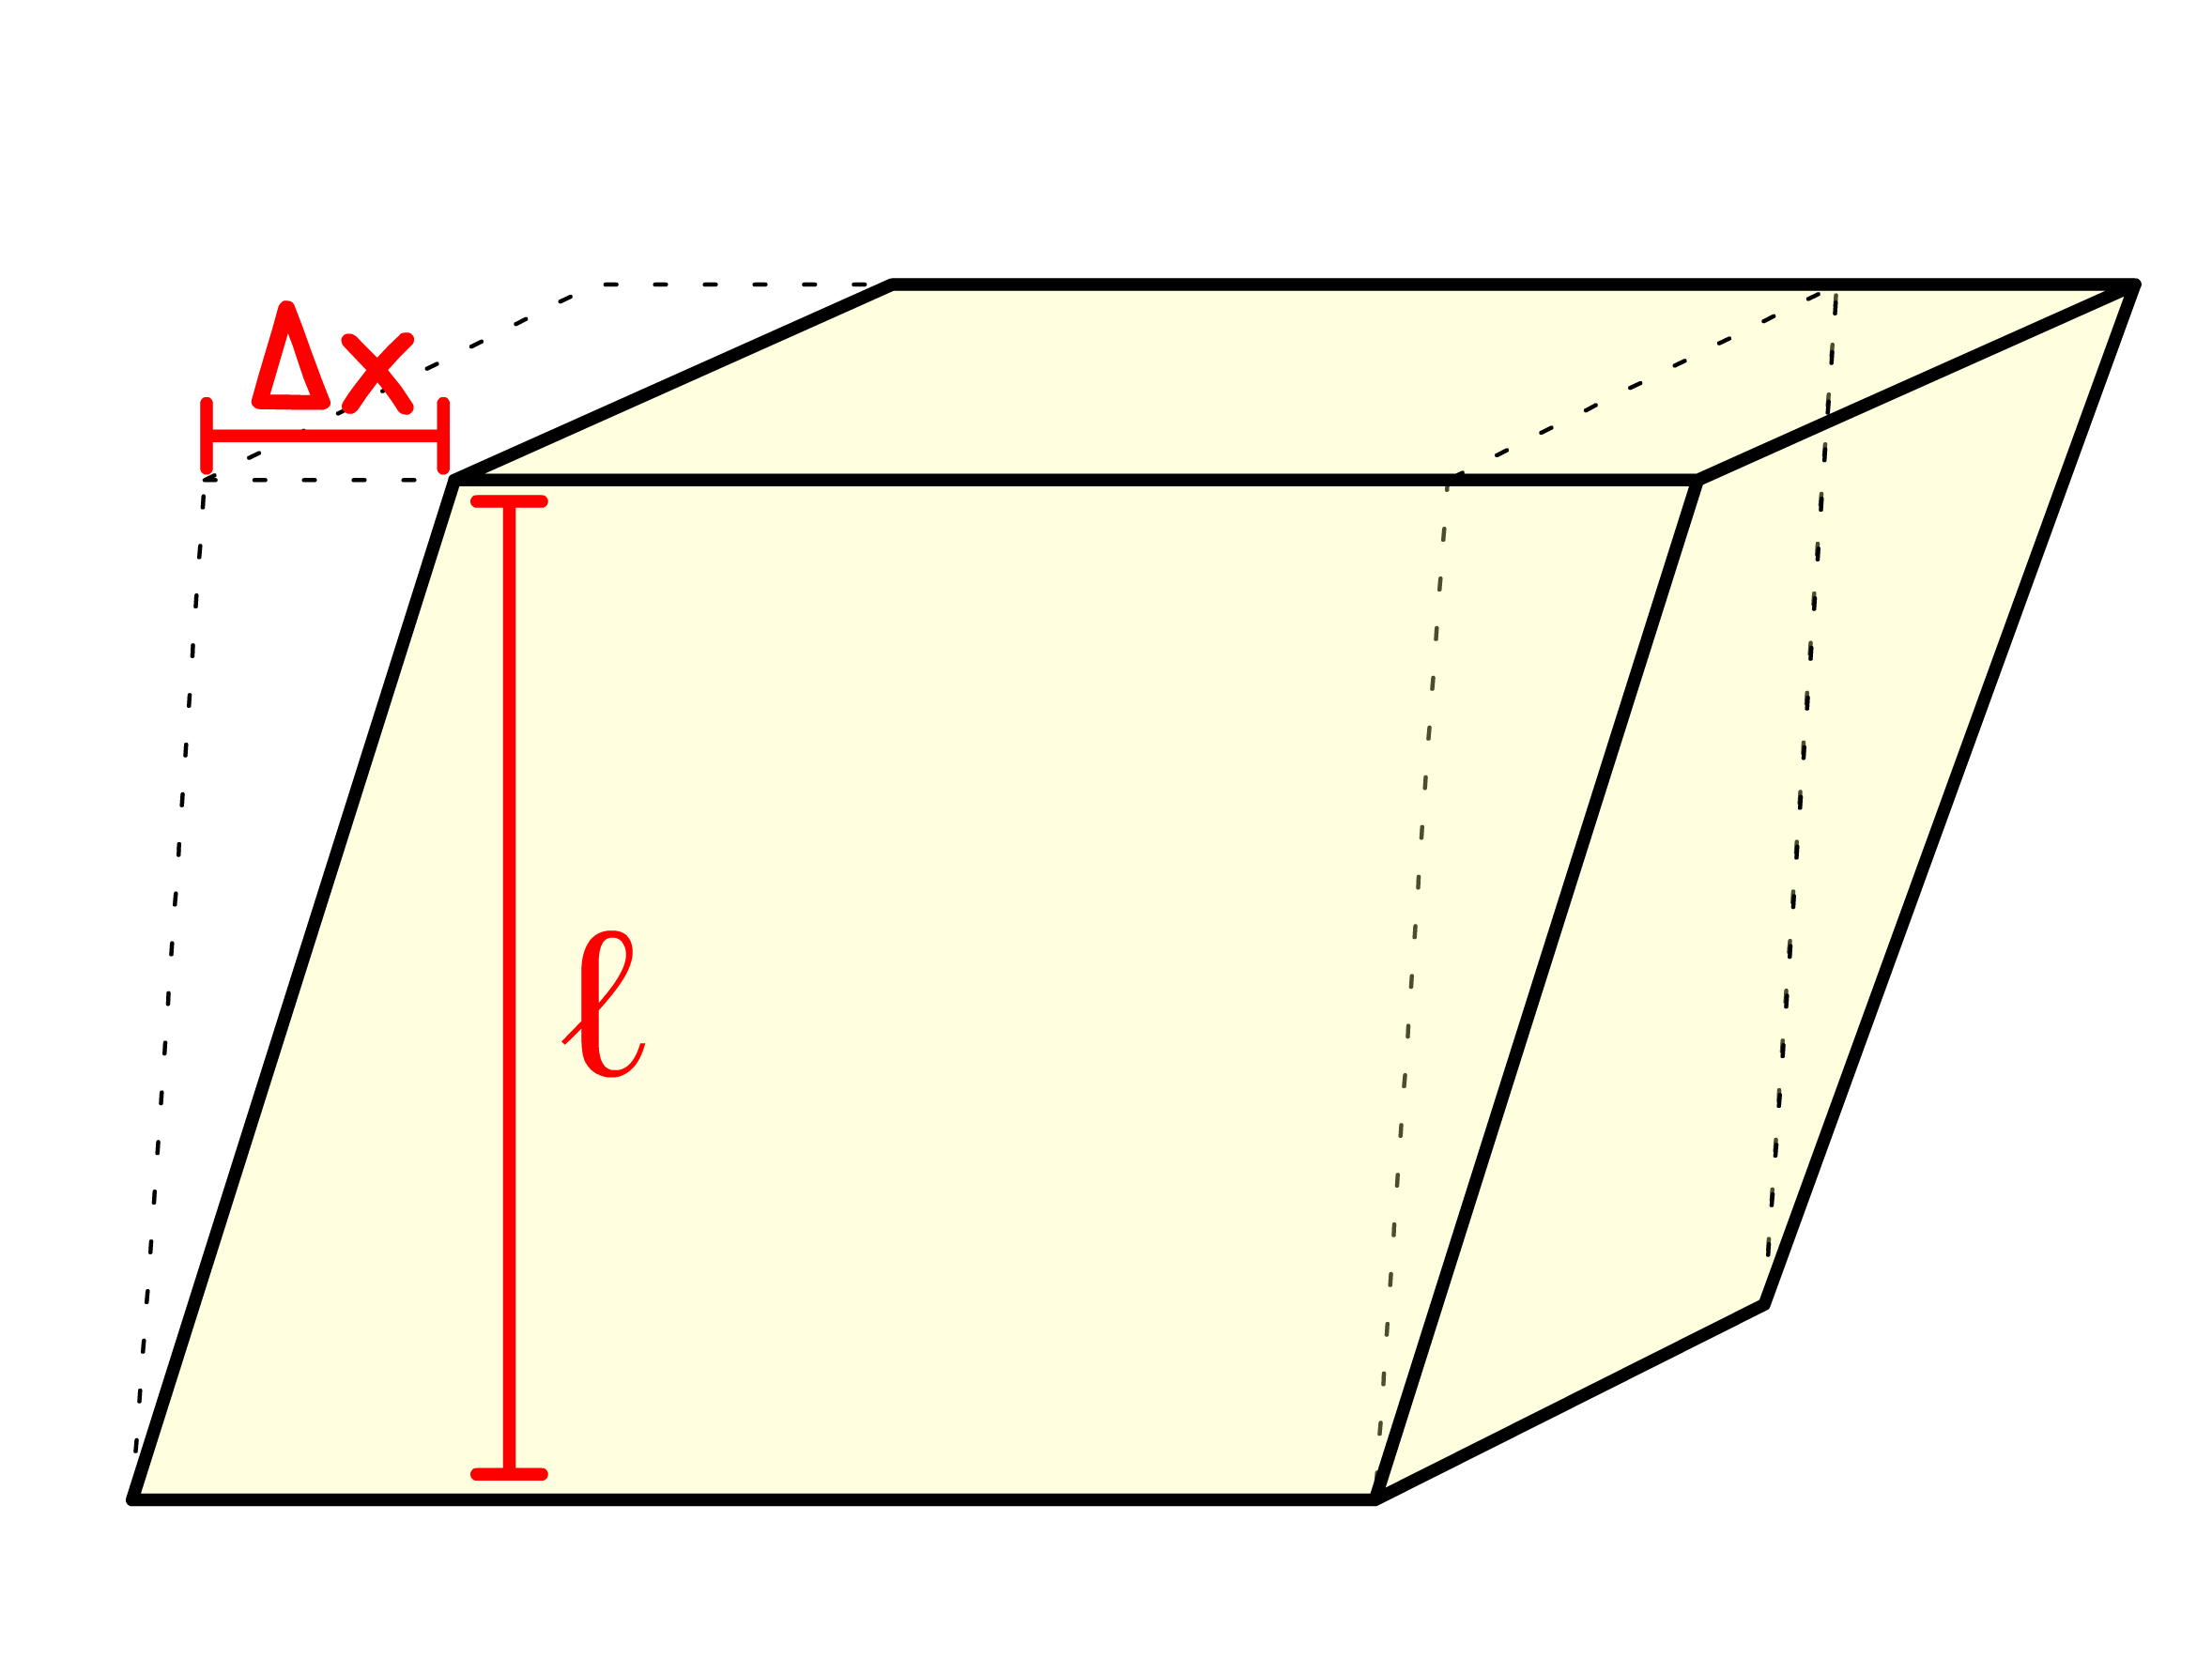
- Shear strain, , is a direct consequence of shear stress. It is used to measure the change in angle between lines that were originally perpendicular and is defined as the ratio of the horizontal displacement ( ) to the height ( ) of the material
Having defined what shear stress and strain is, we can now introduce idealized models for solids and liquids
- The Hookean solid is characterized by its perfectly elastic behaviour
- The Newtonian liquid is characterized by its viscosity
¶ Idealized Extremes
Hookean Solid
The application of stress will produce a constant strain in response in all solids
- The shear strain is directly proportional to the shear stress if the solid is a Hookean solid
- The proportionality constant is the shear modulus ( )
Newtonian Liquid
The application of stress will produce a time-dependent strain in response in all liqiuds
- The rate of change of shear strain with respect to time is directly proportional to the shear stress if the liquid is a Newtonian Liquid
- The proportionality constant is the viscosity ( )
¶ Relaxation Time and Viscoelasticity
It turns out the relative timescale of stress applied plays a pivotal role in determining whether a material displays either viscous or elastic behavior
- This concept is often referred to as viscoelasticity, where all real condensed materials possess a degree of both elastic and viscous properties
- In most cases, simple liquids and solids typically exhibit primarily viscous or elastic responses, respectively. Yet, in the realm of soft matter, which resides between these two extremes, their behavior can shift between viscosity and elasticity based on the nature of the applied stress
The time-dependent viscoelastic nature of materials is intricately linked to the concept of relaxation time
- On a molecular level, relaxation time represents the duration required for molecules to revert to their equilibrium positions following a perturbation. This timescale is crucial in understanding how materials respond to external forces
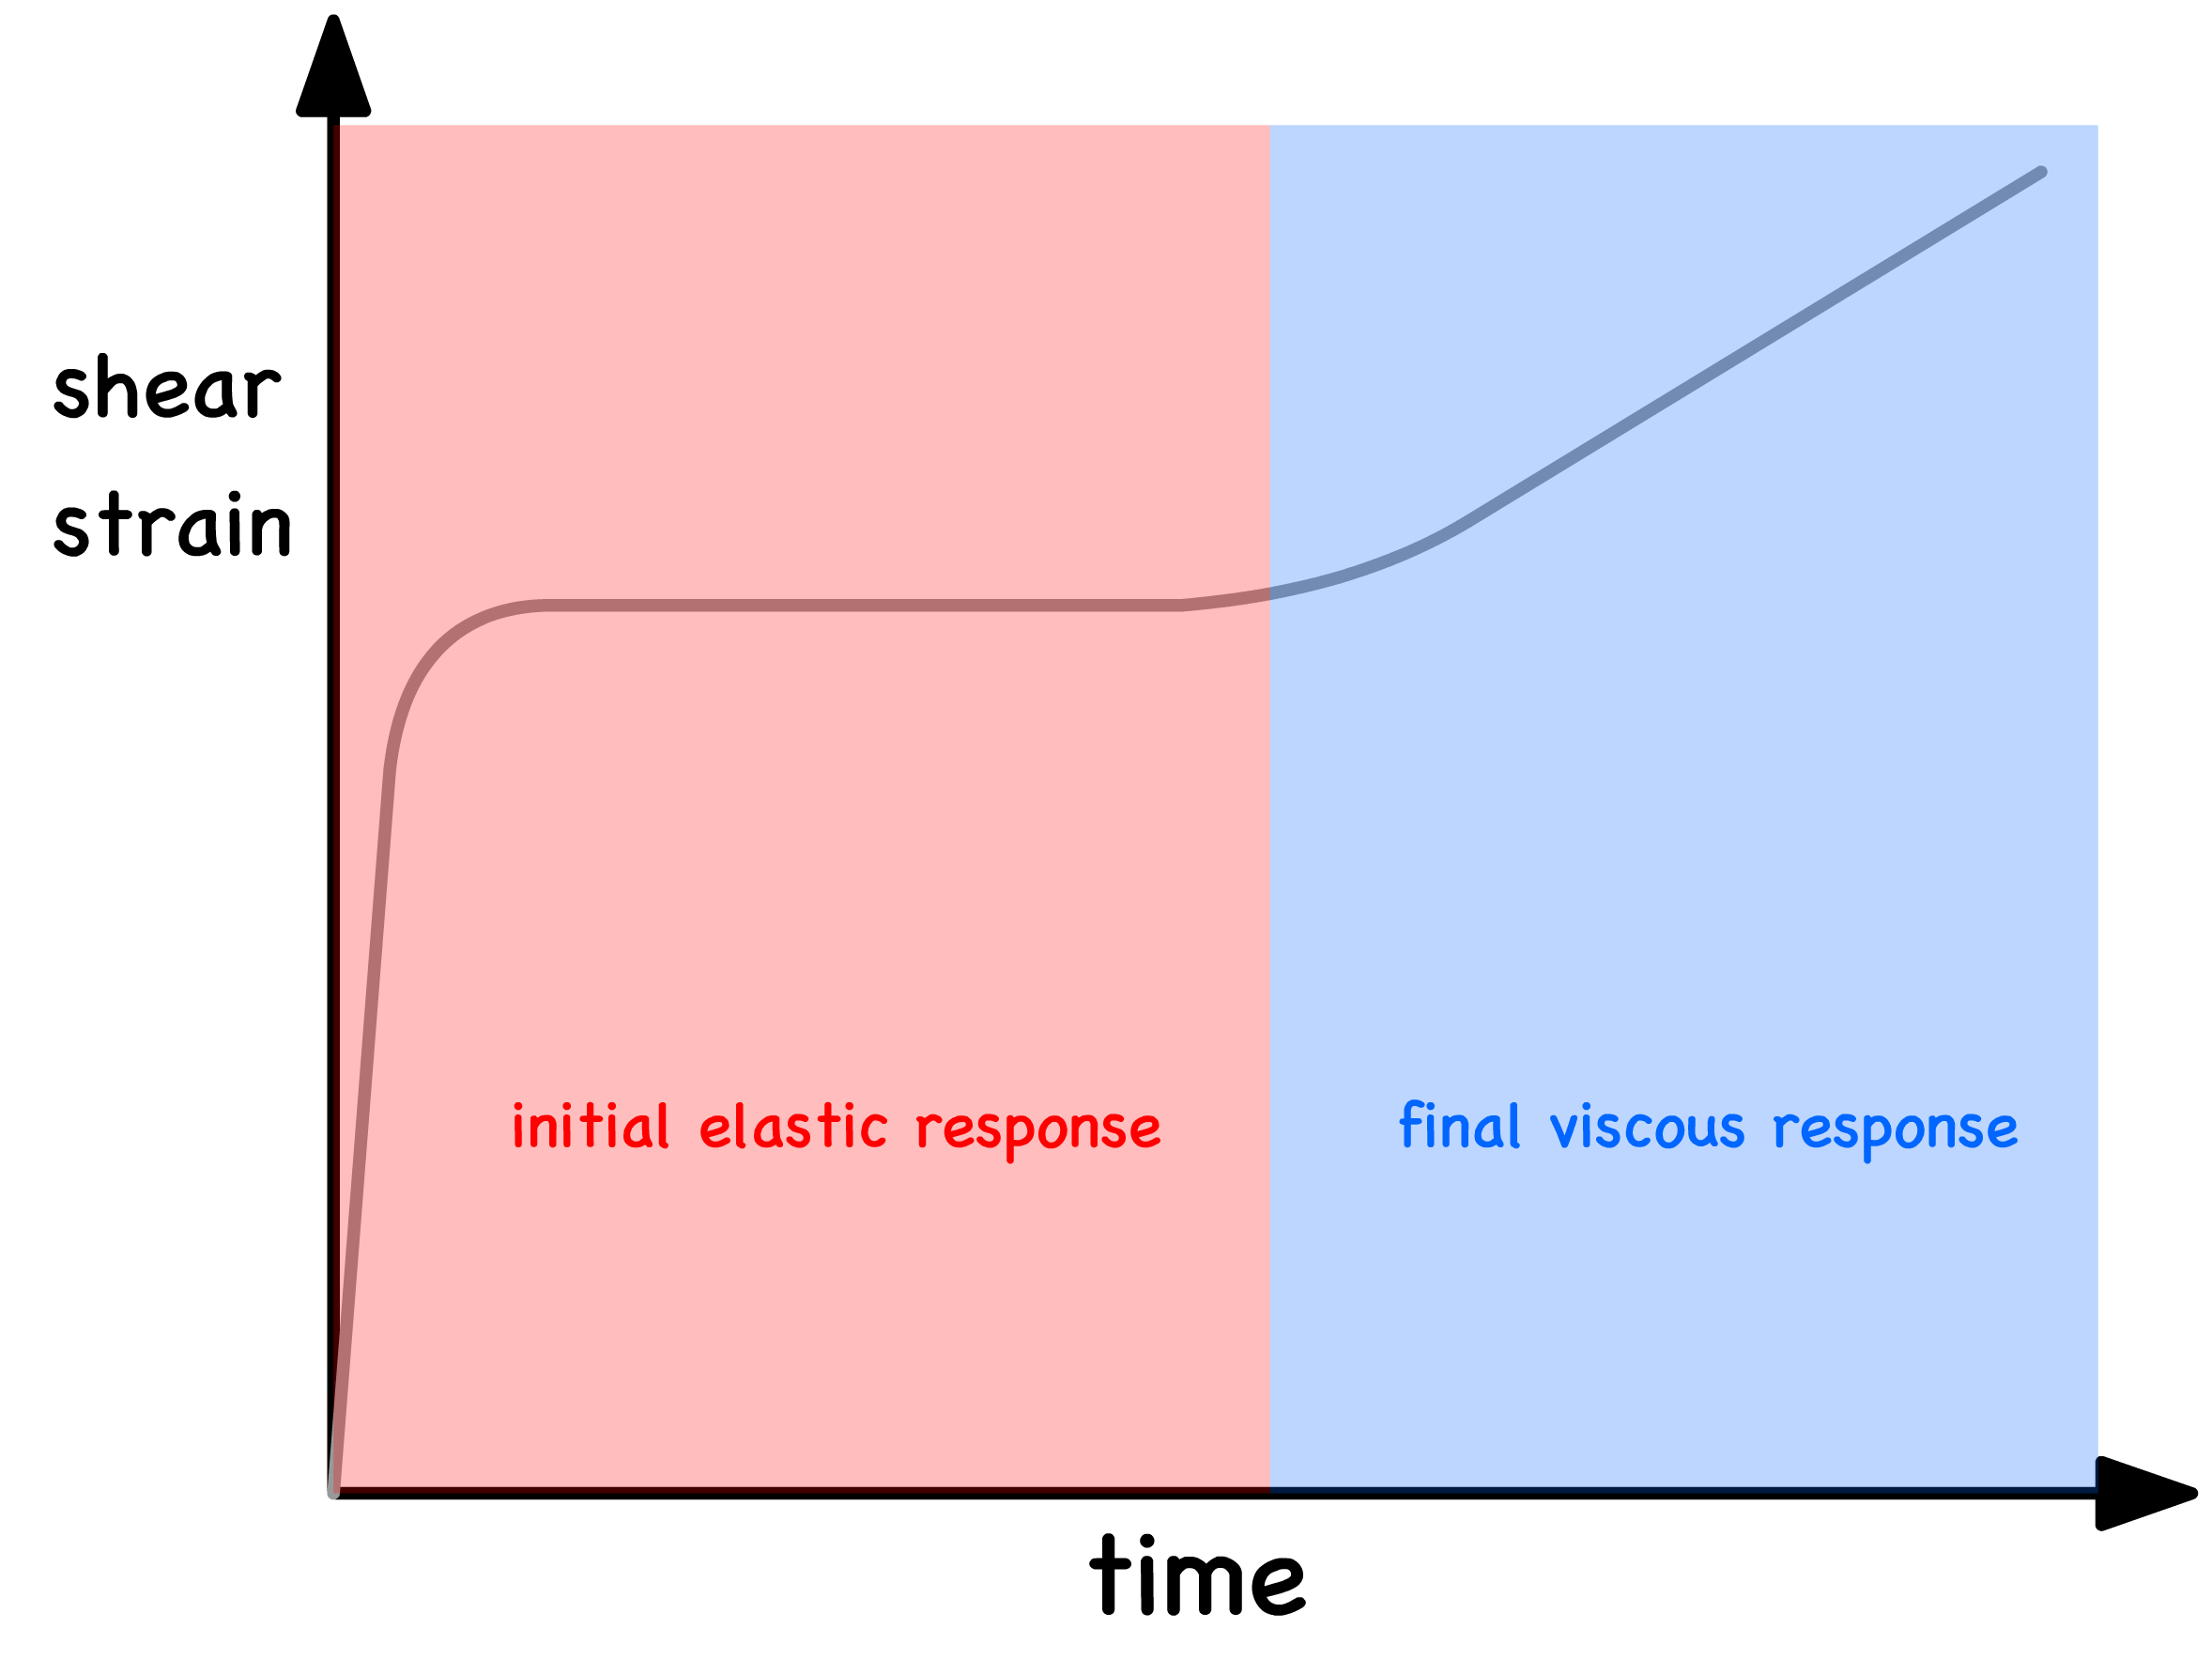
- Viscoelasticity occurs when the timescale of a perturbation is on the order of magnitude of the relaxation time of soft matter
When the applied stress happens at a faster rate than the material's relaxation time, the response leans towards elasticity. In this situation, the material can rapidly return to its original state, showcasing elastic behavior. It stores and releases energy efficiently, resulting in reversible deformations
- When the applied stress occurs more rapidly than the relaxation time, the material's response leans towards elasticity. In this scenario, the material can quickly recover its original state, exhibiting an elastic behavior
- Conversely, if the applied stress unfolds more slowly than the relaxation time, the material's response tends to be viscous. In this case, the material doesn't have adequate time to fully regain its equilibrium, causing it to behave in a more liquid and viscous manner. It dissipates energy, and deformations are typically irreversible
The relaxation time of materials is intricately linked to the size of their building blocks, as described by the equation
- From this equation, we can conclude that the larger the building block, the slower the relaxation time
- In general, simple liquids have very short relaxation times, typically on the order of picoseconds. Conversely, simple solids, such as crystalline materials, can have extraordinarily long relaxation times, extending to millions of years due to the rigidity of their atomic structure
- Soft matter, as noted earlier, encompasses materials with building blocks significantly larger than individual atoms but still small enough to follow Brownian motion. As a result, their relaxation times fall within the range of seconds to minutes. This characteristic allows soft matter to easily exhibit both elastic and viscous properties under various conditions
Viscoelastic materials show a combination of these two behaviors over a relaxation period
- Soft matter therefore possesses both an instantaneous shear modulus, , and an effective viscosity, and they are related by
- Over the relaxation period the shear strain increases deforming the material from a Hookean solid to a Newtonian liquid
¶ Molecular Origin of Mechanical Response
As chemists, we are often more concerned with the microscopic world than the macroscopic one
- We will therefore delve into the mechanical response of matter at a molecular level
- Doing so will allow us to connect the macroscopic measurements with the microscopic properties
Modeling Elastic Response
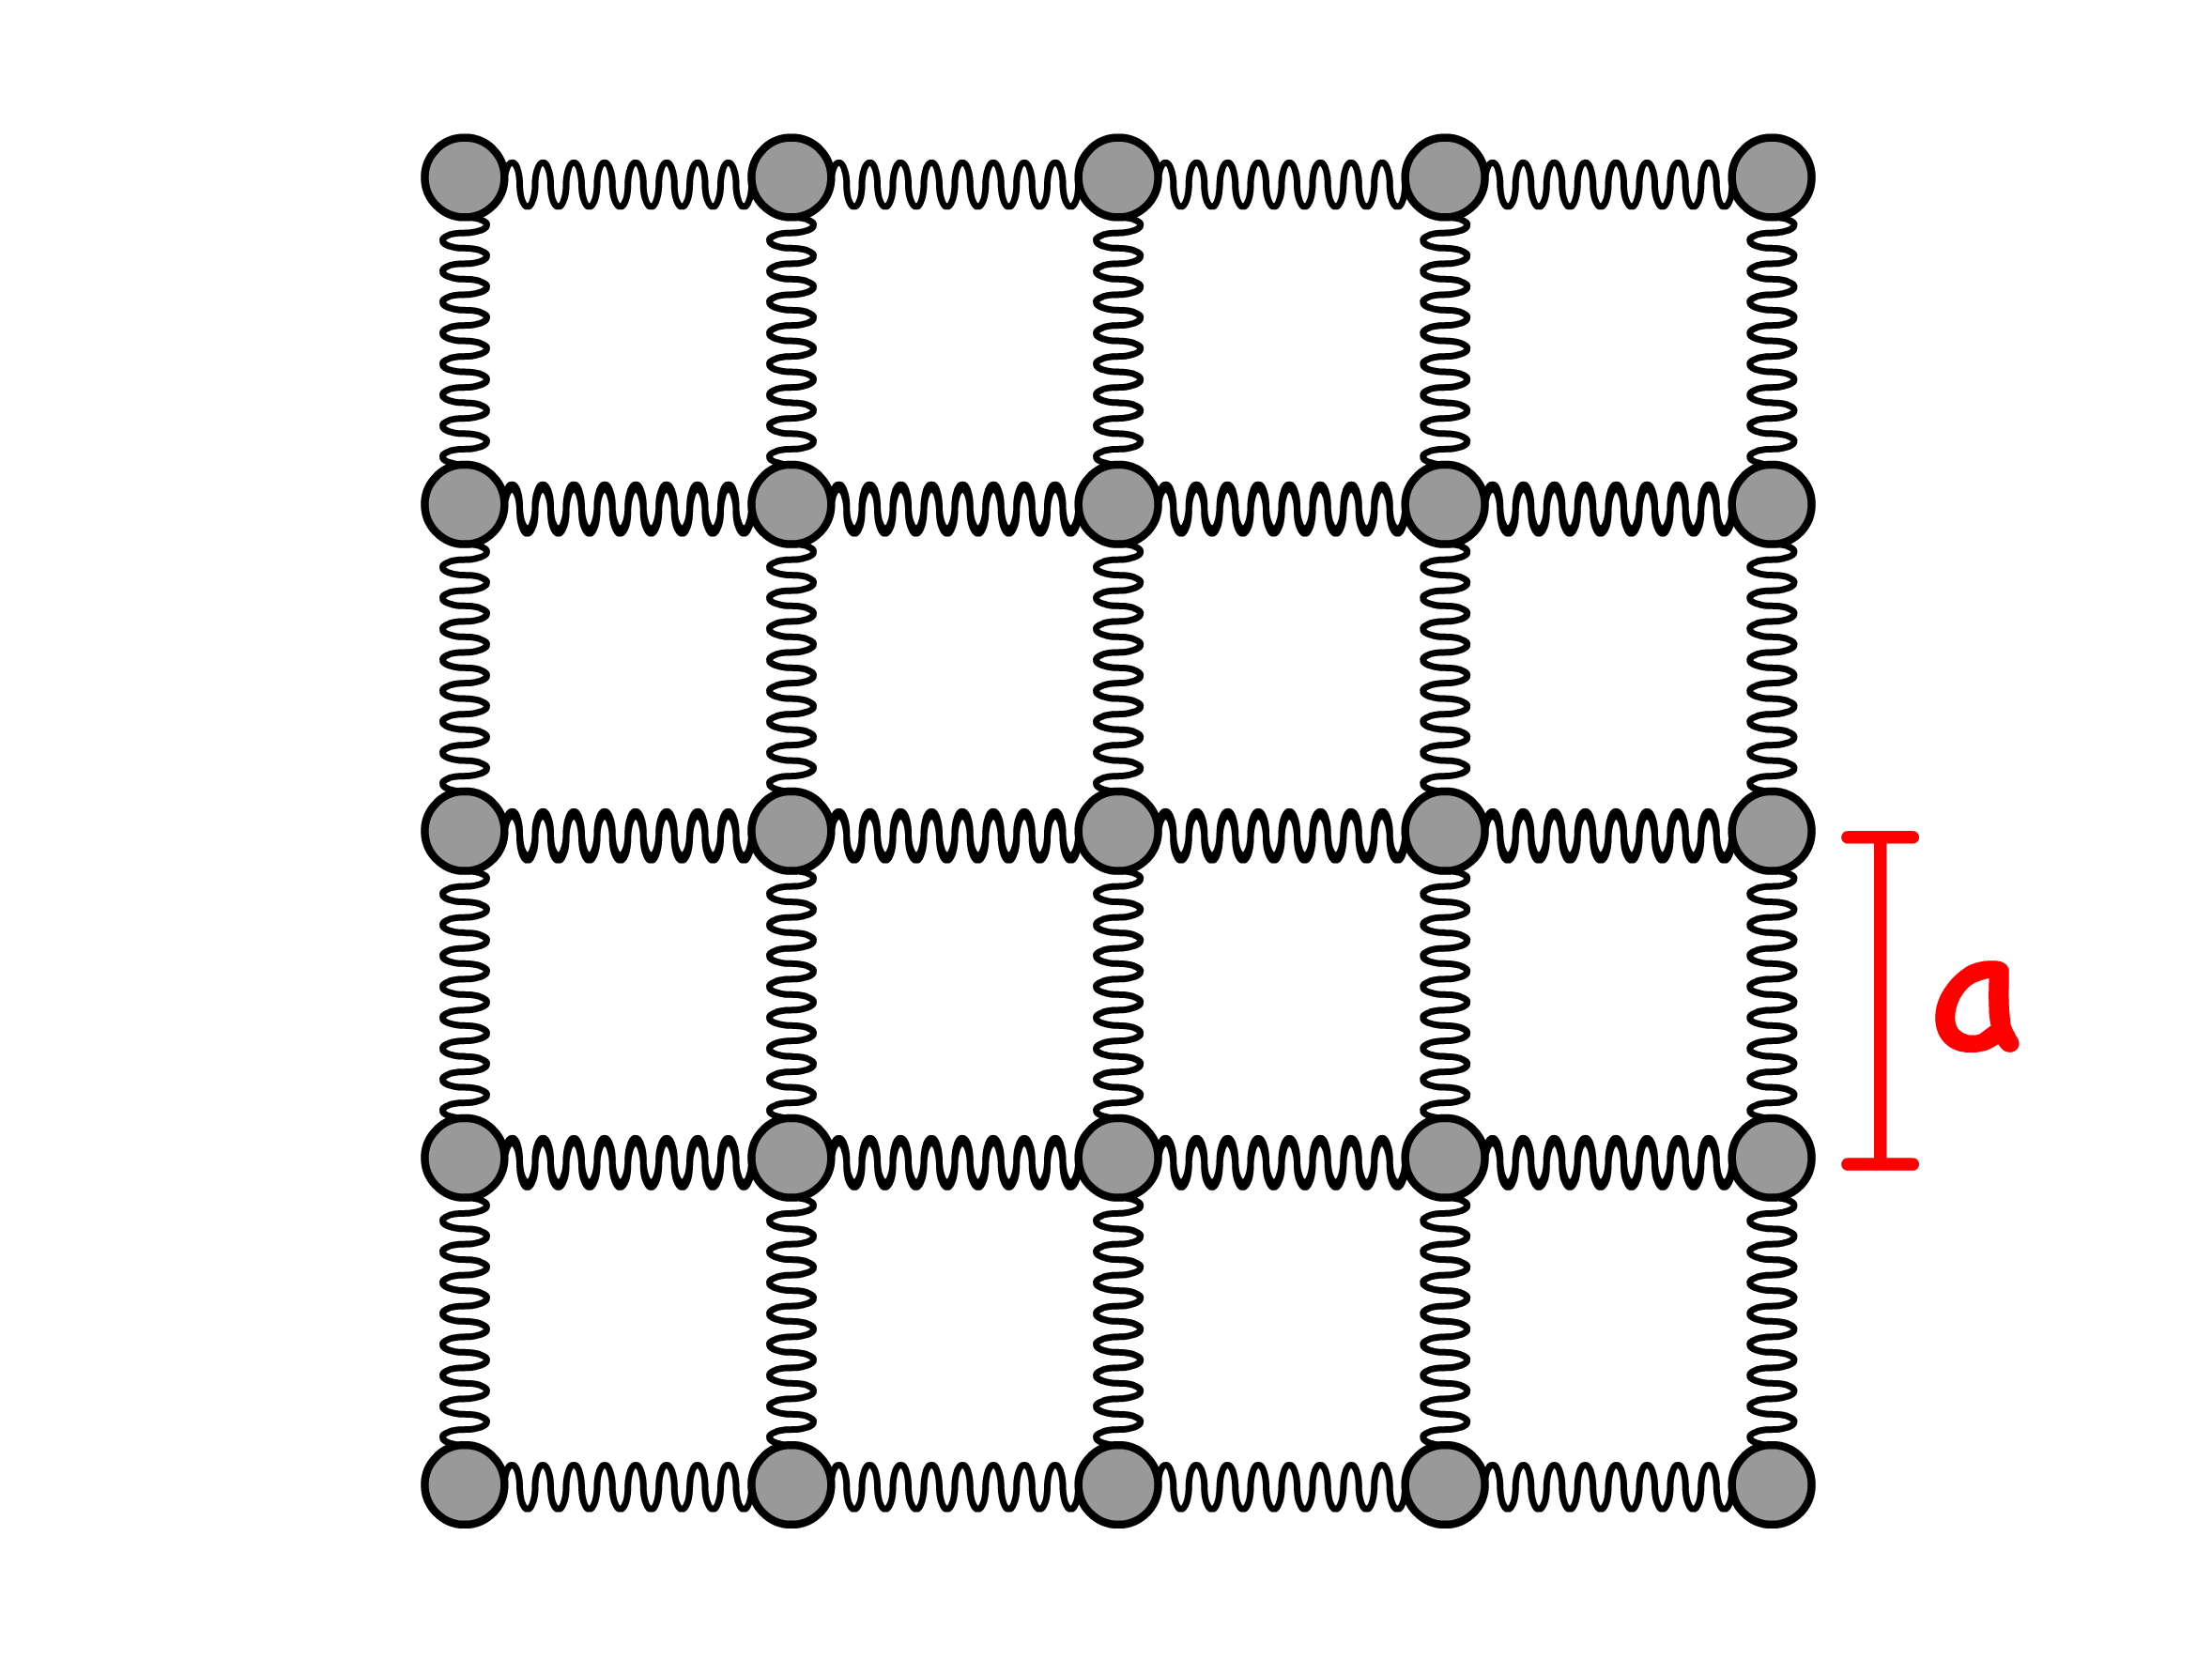
In condensed matter, strong intermolecular interactions are prevalent. To model this, we'll consider building blocks connected by springs in a cubic lattice arrangement
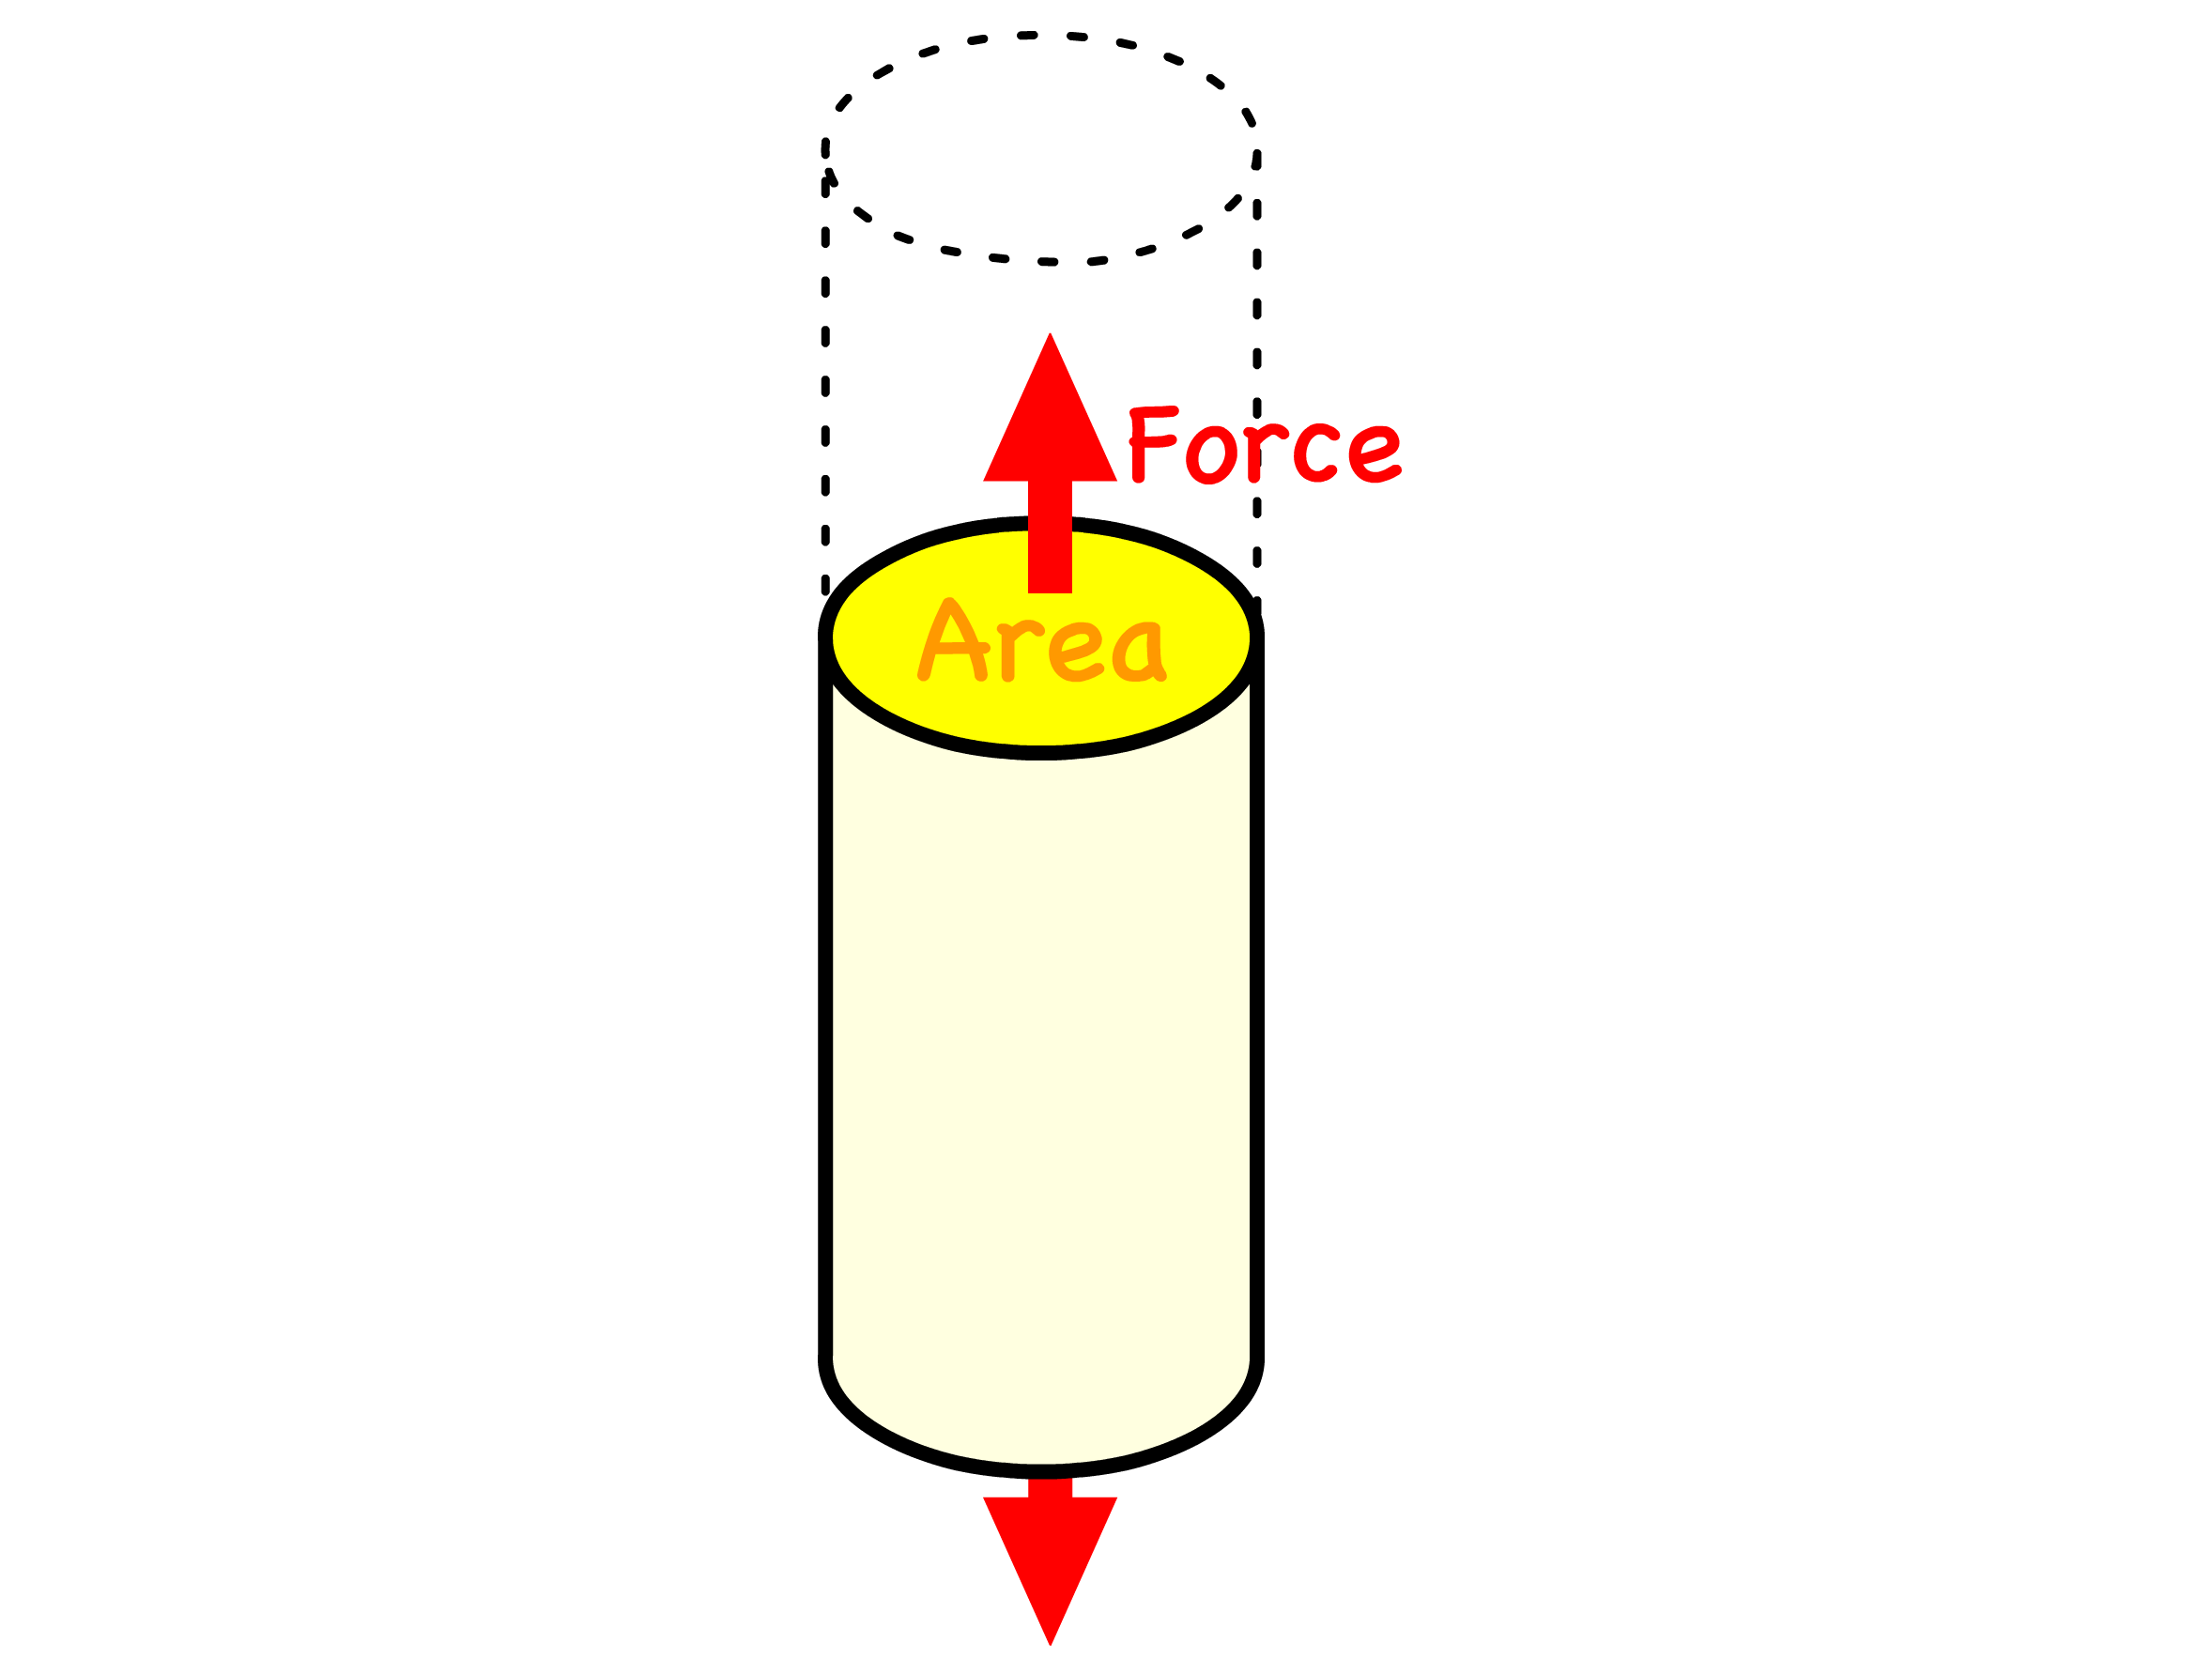
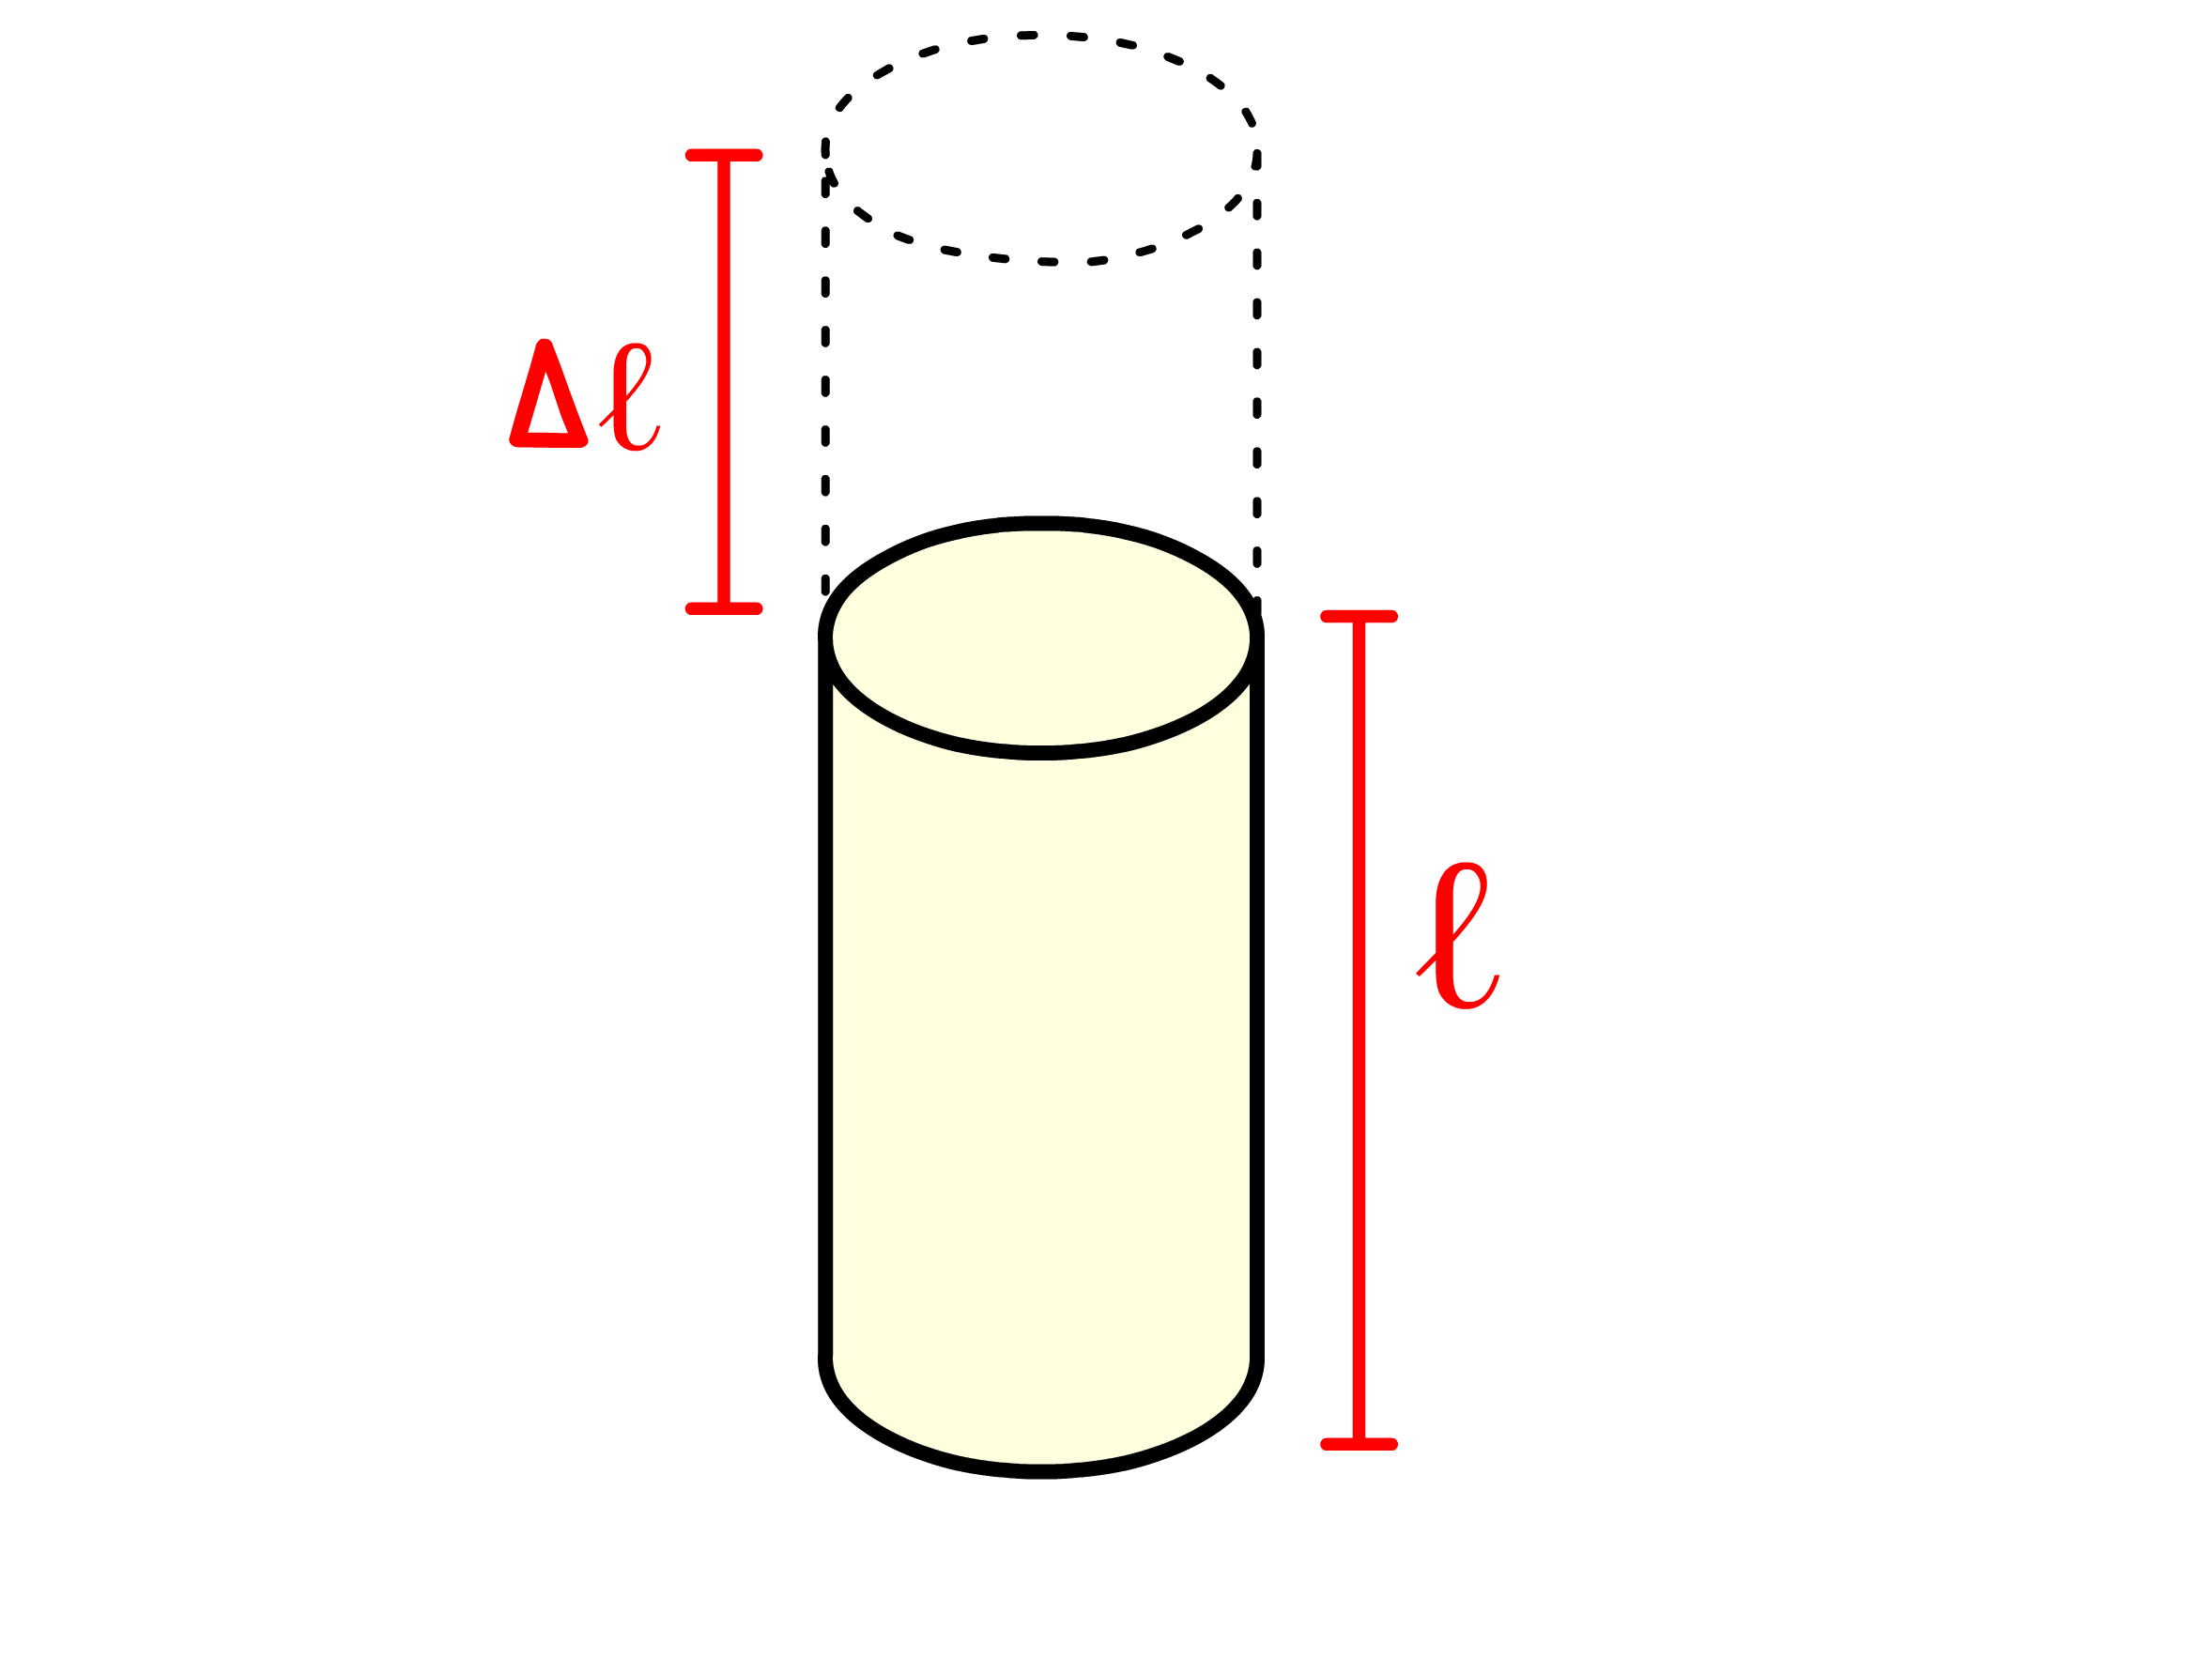
Since we are modelling the stretching and compressing behaviour, it is convenient to introduce the concept of tensile stress, tensile strain and the Young Modulus
- Tensile stress is the force per unit area applied to a material, causing it to stretch or elongate
- Tensile strain is the resulting deformation or change in length, expressed as a ratio of the change in length to the original length
- The Young's Modulus, , is a material property that quantifies a material's ability to resist deformation under tensile stress, providing a measure of a material's stiffness
We can now return to our model and derive an expression for the Young Modulus
- By applying Hooke's Law, we can determine the force on each spring when stretching the material from an interatomic distance of to is
- The area per spring is , so the tensile stress is given by
- The original length of the spring is and it is stretched to , so the tensile strain is given by
- The Young Modulus is therefore given by
In the expression , represents a measurable macroscopic property, and denotes the desired microscopic property. To complete the equation, we need to derive an expression for
- We shall begin by deriving an expression for the interatomic potential, which is just the integral of the force
- Alternatively, we can also express the interatomic potential as a Taylor Series
- By comparing the two different expressions of the interatomic potential energy, we have found an expression for
- The magnitude of at the equilibrium position provide insights into the curvature of the potential energy curve and the bond strength, which, in turn, is related to the bond energy density
- Putting this expression back to our original equation will yield a new expression for Young's Modulus
From the derived expression, we can infer a direct relationship between the Young's Modulus, a measure of material stiffness, and bond energy density
- This relationship has intuitive implications: materials with a high density of strong bonds tend to be stiff, whereas materials with a low density of weak bonds tend to exhibit flexibility
Modeling Viscosity
Thinking of elastic moduli in terms of energy densities clarifies why even flowing materials can possess an instantaneous shear modulus
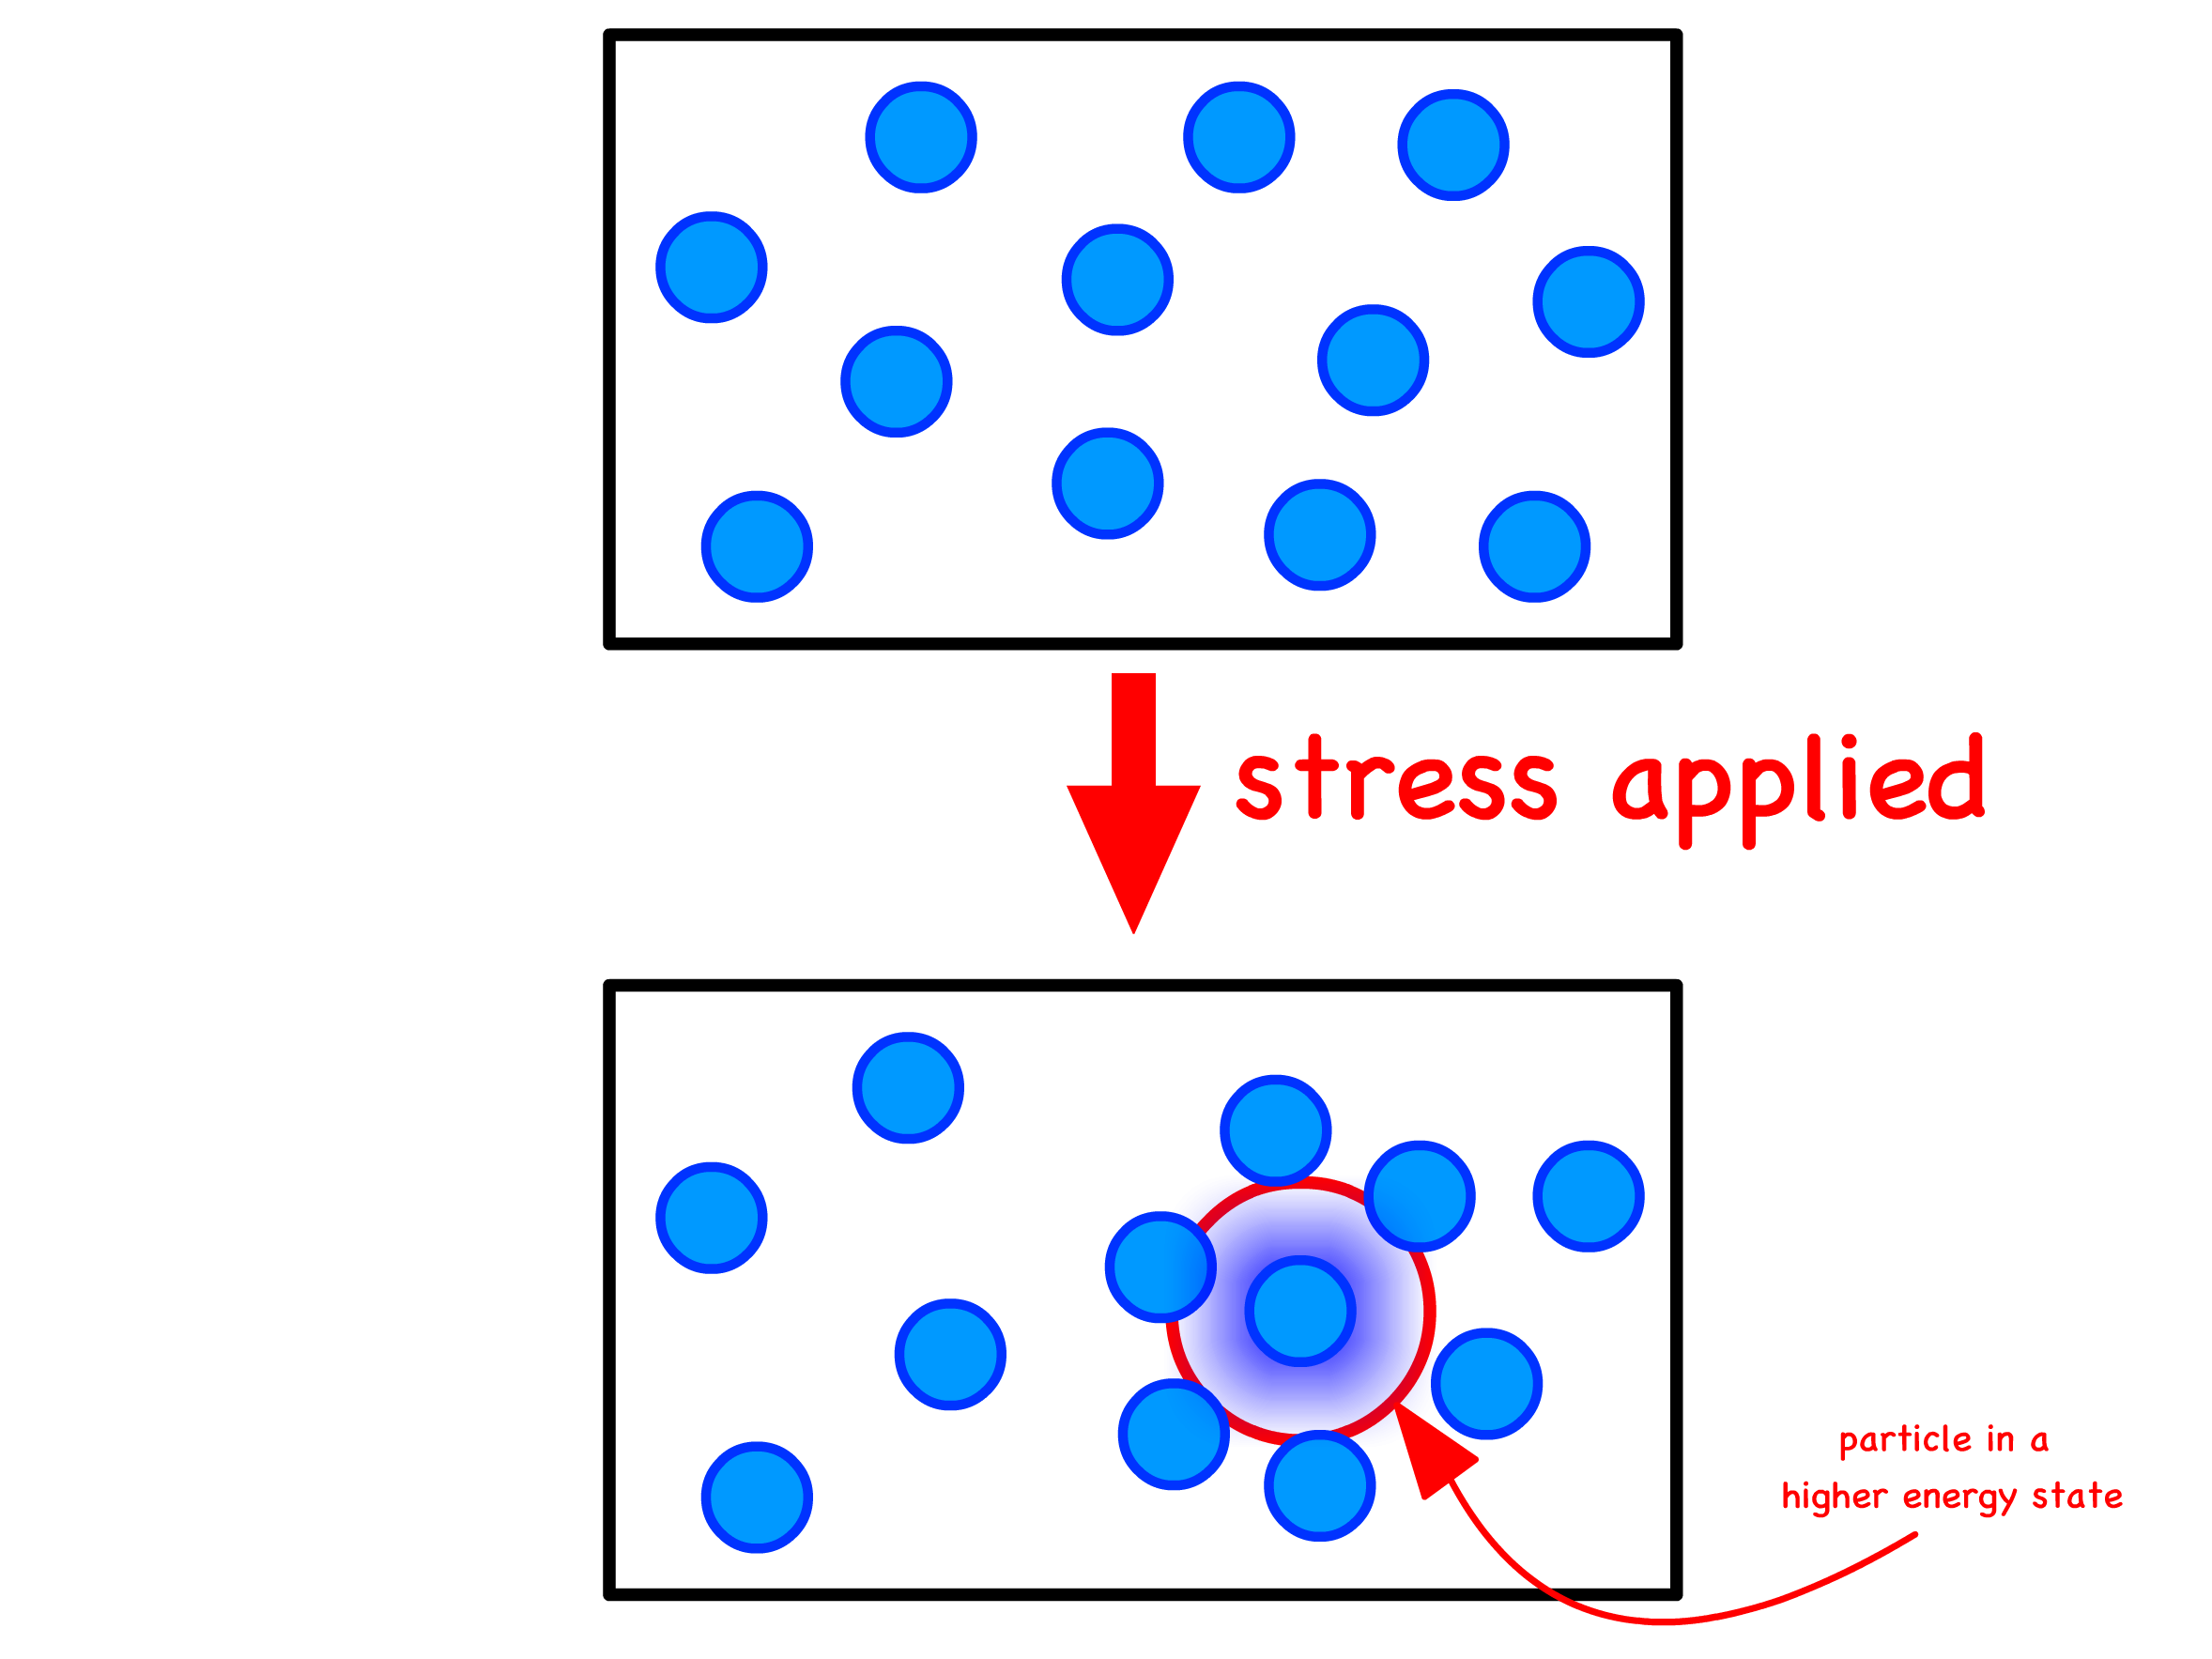
- Applied stress deforms the material, elevating its energy state above the unstressed equilibrium
- In a perfect crystalline solid, stress relief necessitates wholesale atomic rearrangements. Conversely, in a liquid, individual particle motions can alleviate stress without the need for collective particle movements
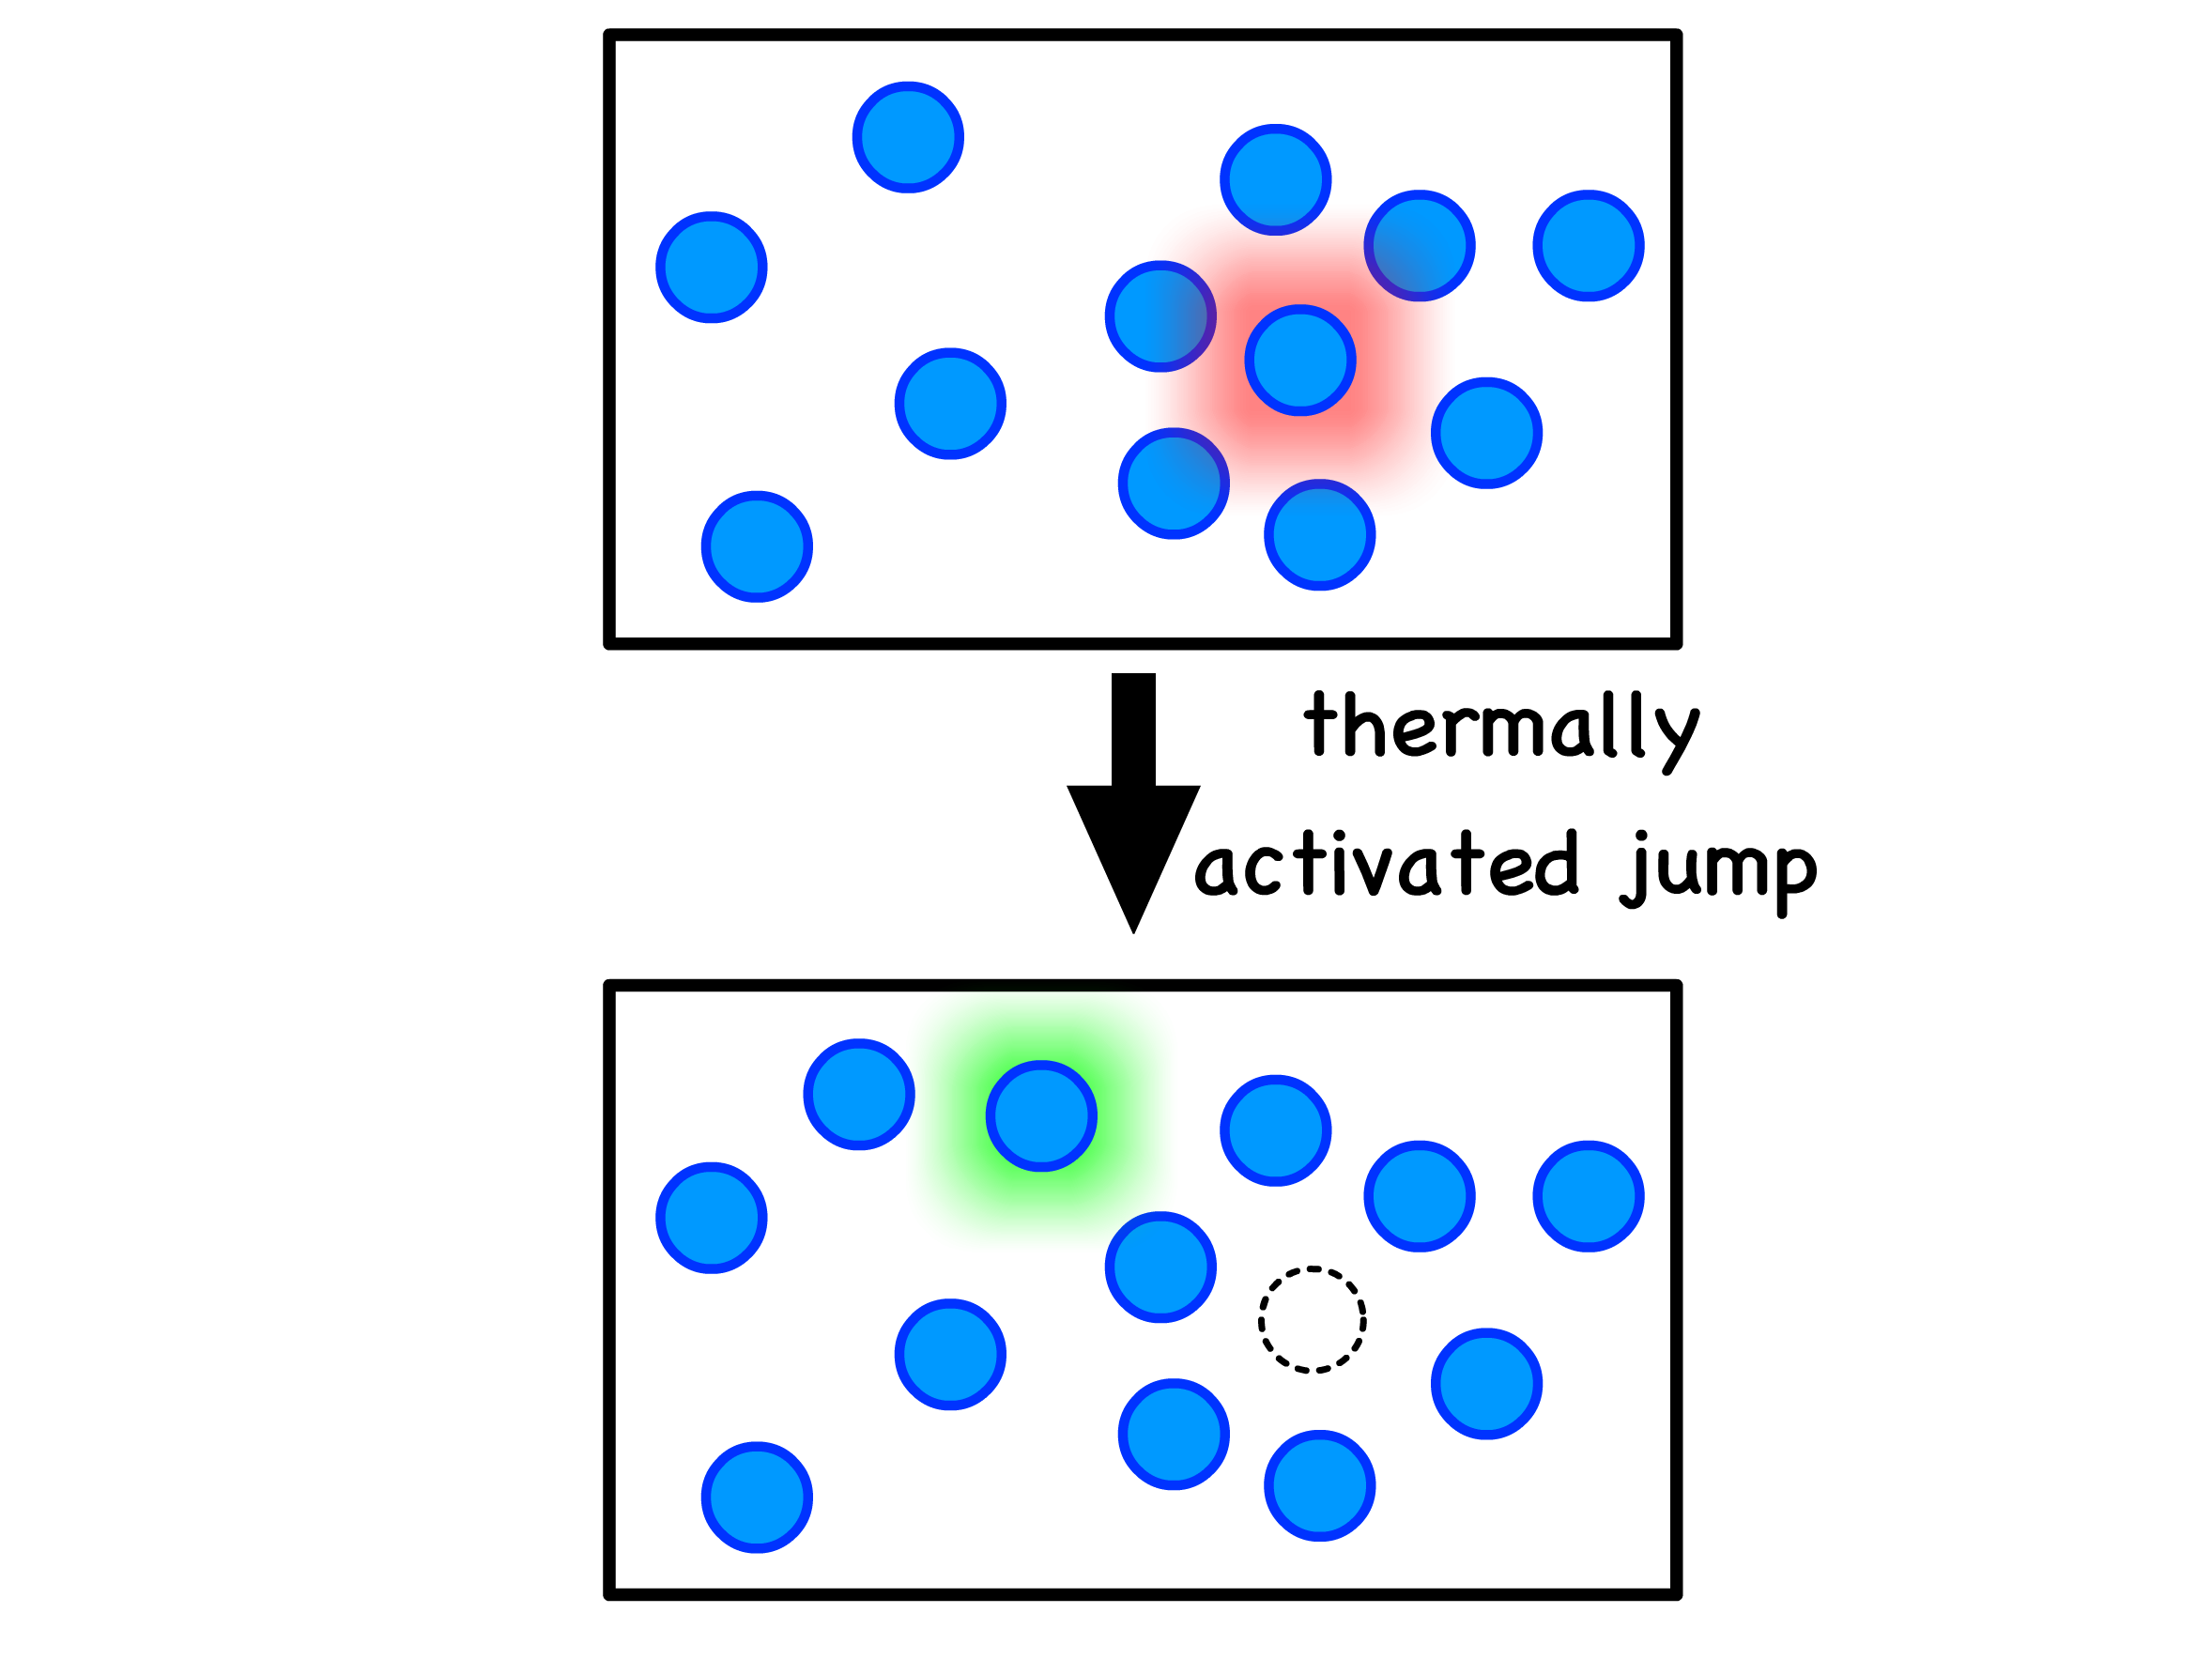
We can gain a deeper understanding by envisioning a particle trapped in a high-energy state due to its neighboring particles
- To reduce its energy, the confined particle can break free from its confinement through a thermally activated jump to a lower-energy location
- The time it takes for such a jump to occur is the relaxation time, denoted as
By connecting the relaxation time to this physical process, we can derive an expression for it
- TThe vibrating particle within its cage has a characteristic frequency , and it faces an energy barrier that it must surmount to escape the cage
- Using the Boltzmann distribution, we can estimate as
We can take this one step further and relate it to viscosity
- Combining the equation relating effective viscosity and relaxation time and the one above, we derived a new expression for viscosity
The relaxation process in soft matter is primarily governed by diffusion, which is an activated process
- Greater activation energies lead to reduced viscosity and an increase in elastic response. Soft matter resides in this middle ground, where the relaxation time, determined by activation energy, is a key indicator of viscoelastic behavior
- Notably, the activation energy for diffusive processes tends to rise as we transition from liquids to soft matter to solids/glasses
¶ Phase Separation in Soft Matter
As mentioned earlier, one of the distinctive features of soft materials is their remarkable ability to self-assemble
- This self-assembly often takes place during a phase transition, where a quantitative change in the external environment results in a qualitative transformation of the soft material itself
Interestingly, merely knowing which equilibrium phases possess the lowest free energy is insufficient for predicting the structure of soft materials
- This is because the fact that a system will assume a certain minimum energy structure at equilibrium does not guarantee an instantaneous transition to a new structure during a phase transition
- To fully comprehend the process, one must also have a grasp of the kinetics involved in the phase ordering and disordering
Model
In our approach, we adopt a lattice model that organizes all particles within the two liquids in a grid-like structure
- In the context of modeling liquids, this lattice doesn't conform to the regular, well-defined patterns found in crystalline structures
- The model serves as a discrete representation of the system, with each lattice site being uncorrelated and each having nearest neighbors
We employ Mean-Field Theory to construct equilibrium phase diagrams for phase transitions in soft matter
- Mean-Field Theory neglects quantum mechanical effects and assumes a lack of fluctuations in concentration
- Our analysis is carried out within the canonical ensemble
In our investigation, we consciously select the ensemble as opposed to the ensemble
- In this ensemble, temperature , volume , and the number of particles are the key parameters that dictate the system's behavior
- This choice allows us to construct a lattice model that mirrors the key aspects of solution behavior without unnecessary complexities
Free Energy
With our deliberate choice of the ensemble, the Helmholtz energy ( ) emerges as the ideal candidate for predicting the miscibility of two liquids
- Our goal is to compare the size of the Helmholtz energy of two liquids mixing ( ) and the Helmholtz energy of the two liquids remaining separate ( )
- To calculate the Helmholtz energies, we need to calculate the corresponding entropy and internal energy
To see whether mixing is spontaneous or not, we will need the change in Helmholtz energy
- Hence, we can also express it as
At this stage, our primary focus lies in understanding how the system's behavior changes concerning relative composition, rather than temperature or total volume
- To achieve this, we will normalize by dividing it by two key quantities: Boltzmann's constant times temperature ( ) and the total number of moles ( )
- This normalization allows us to obtain dimensionless quantities, making them comparable across systems with varying temperatures and volumes
- Our objective is then to find the corresponding dimensionless values for both the changes in internal energy ( ) and entropy ( )
Entropy
The entropy of mixing the solution can be calculated using the Boltzmann equation
- Utilizing the concept of combinatorics, we can expand the multiplicity in terms of the number of particles
- Using logarithmic properties and the Stirling's approximation ( ), we can expand the expression
- We can express it in terms of mole fraction instead
The entropy of the separated solution is just the sum of entropy of the two liquids
- Using the above derived expression, we can conclude that the entropy of pure liquid is zero
- Hence, the entropy of the separated solution is zero
We are most concerned about the dimensionless change in entropy
- Substituting the corresponding terms will give us
Internal Energy
The internal energy of mixing in a solution can be approximated by summing the contact interactions between pairs of nearest neighbors in the mixture
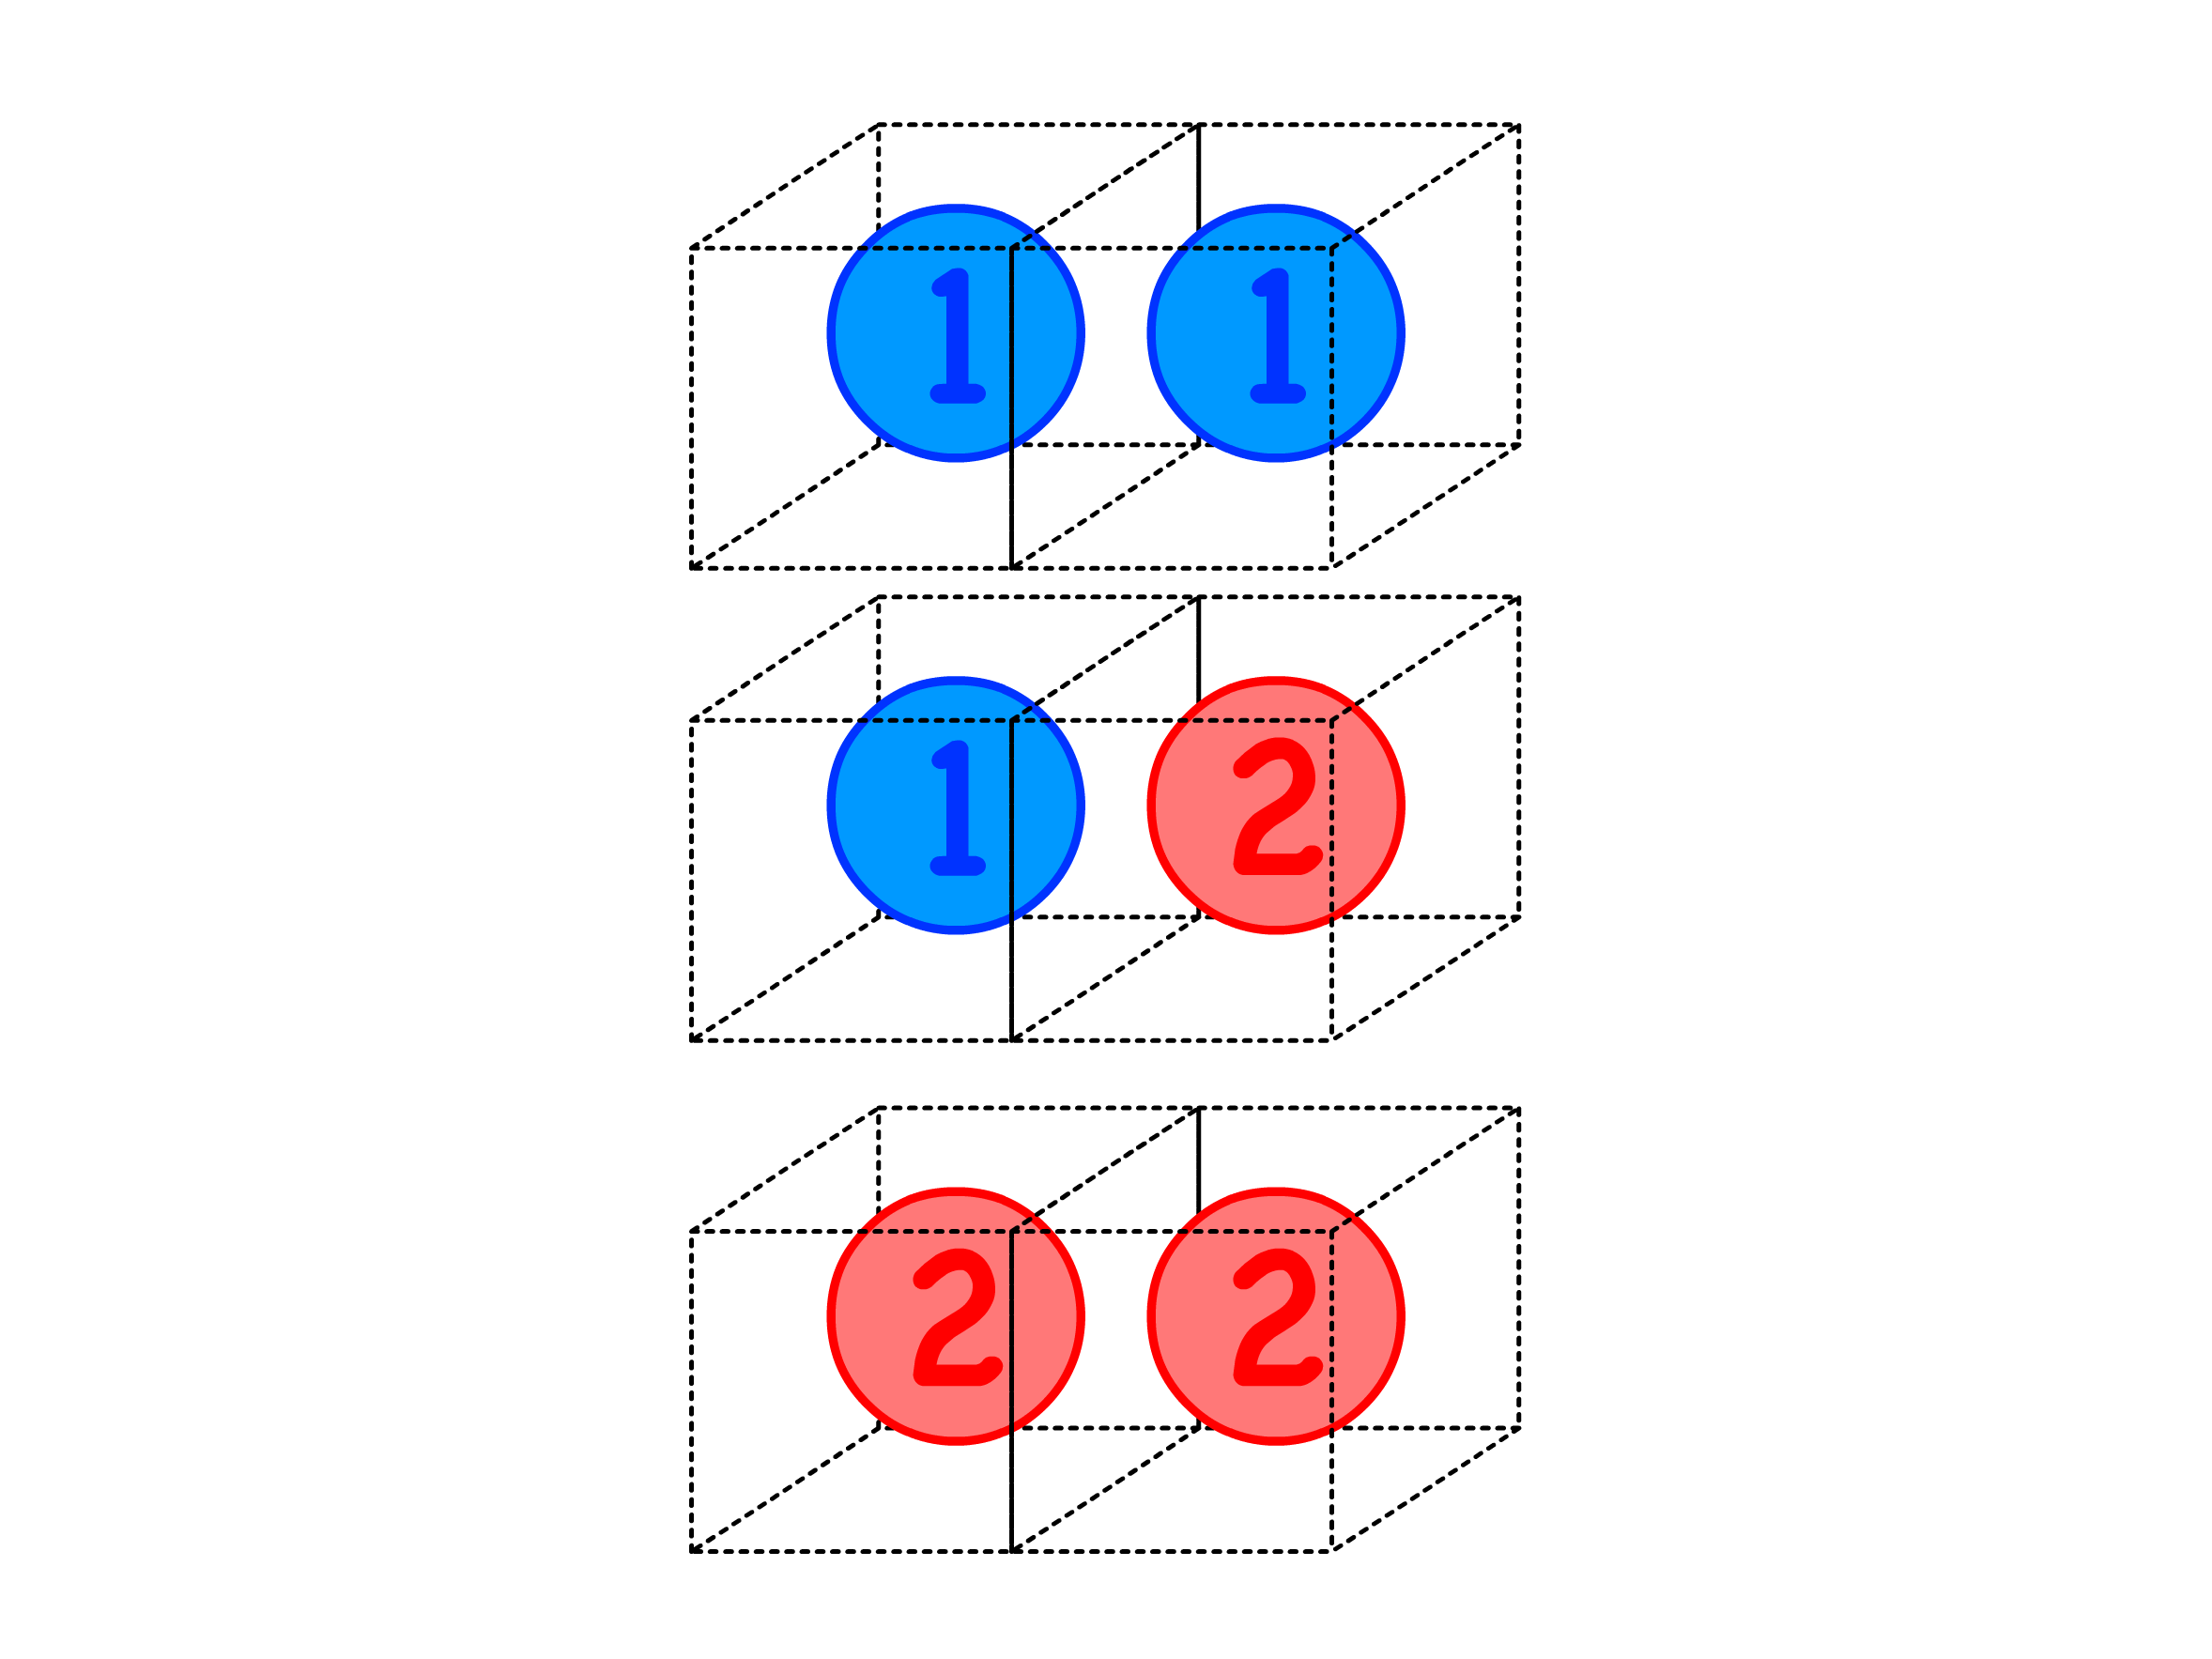
- In the case of a lattice solution with two components, denoted as 1 and 2, the possible types of contact are 1–1, 1–2, and 2–2
- The total energy can be expressed as the sum of individual contact energies over these three types of contacts
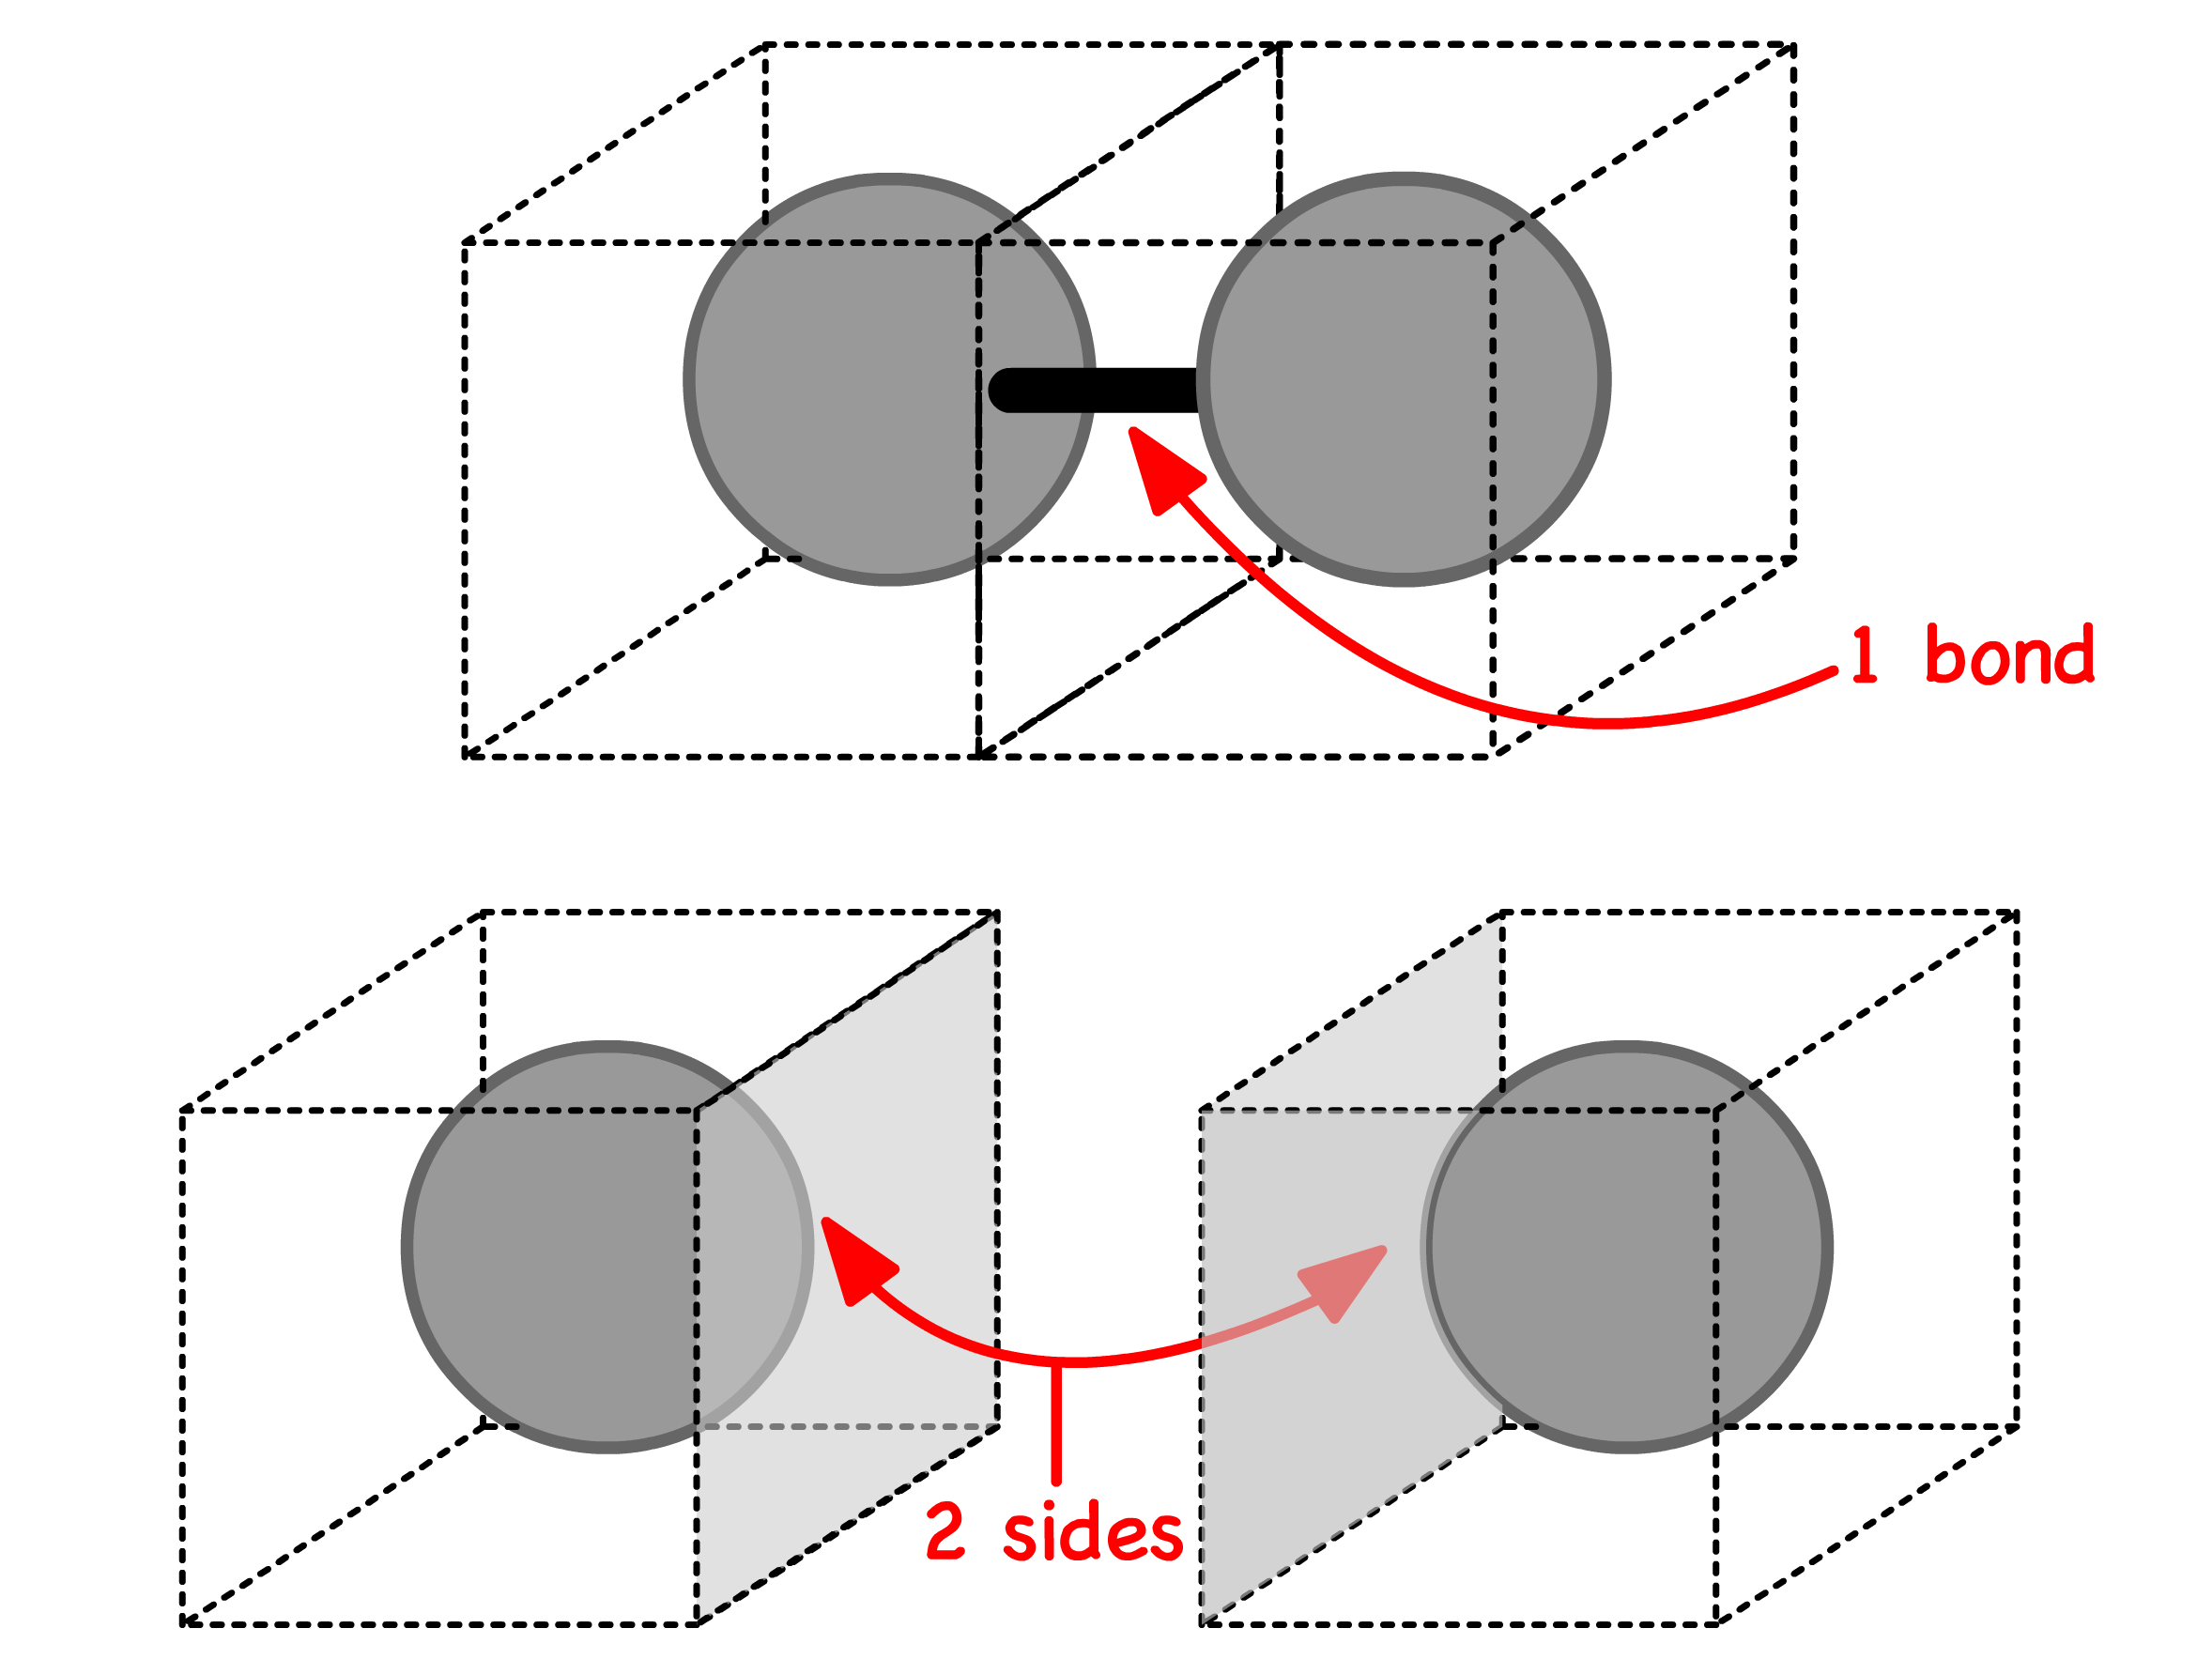
- We know that each bond uses up two contact sides
- Since each lattice site has immediate neighbours, the total number of sides for particle 1 and 2 are and respectively. We can then relate them to the number of bonds
- We can then express in terms of
- Substituting this back to our original equation will give us
- The probability of a particle appearing on a site is , so the average number of particle being the immediate neighbour of any site is . Therefore, the total number of contact between particle and is n_j\times z\times\frac{n_i}
- Substituting this back to the main equation will give us the final expression
The internal energy of the separated solution can be calculated by summing the internal energies of the individual liquids
- The internal energy of each liquid is determined by the sum of bond energies
- Therefore, the total internal energy of the separated solution is given by
We are most concerned about the dimensionless change in internal energy
- By substituting the relevant terms, we obtain
- We shall define a dimensionless quantity known as the Flory-Huggins parameter , which represents the energy change in units of when a molecule of component 1 is transferred from an environment of pure liquid 1 to an environment of pure liquid 2
¶ Free Energy vs Composition
Shape of the Curve
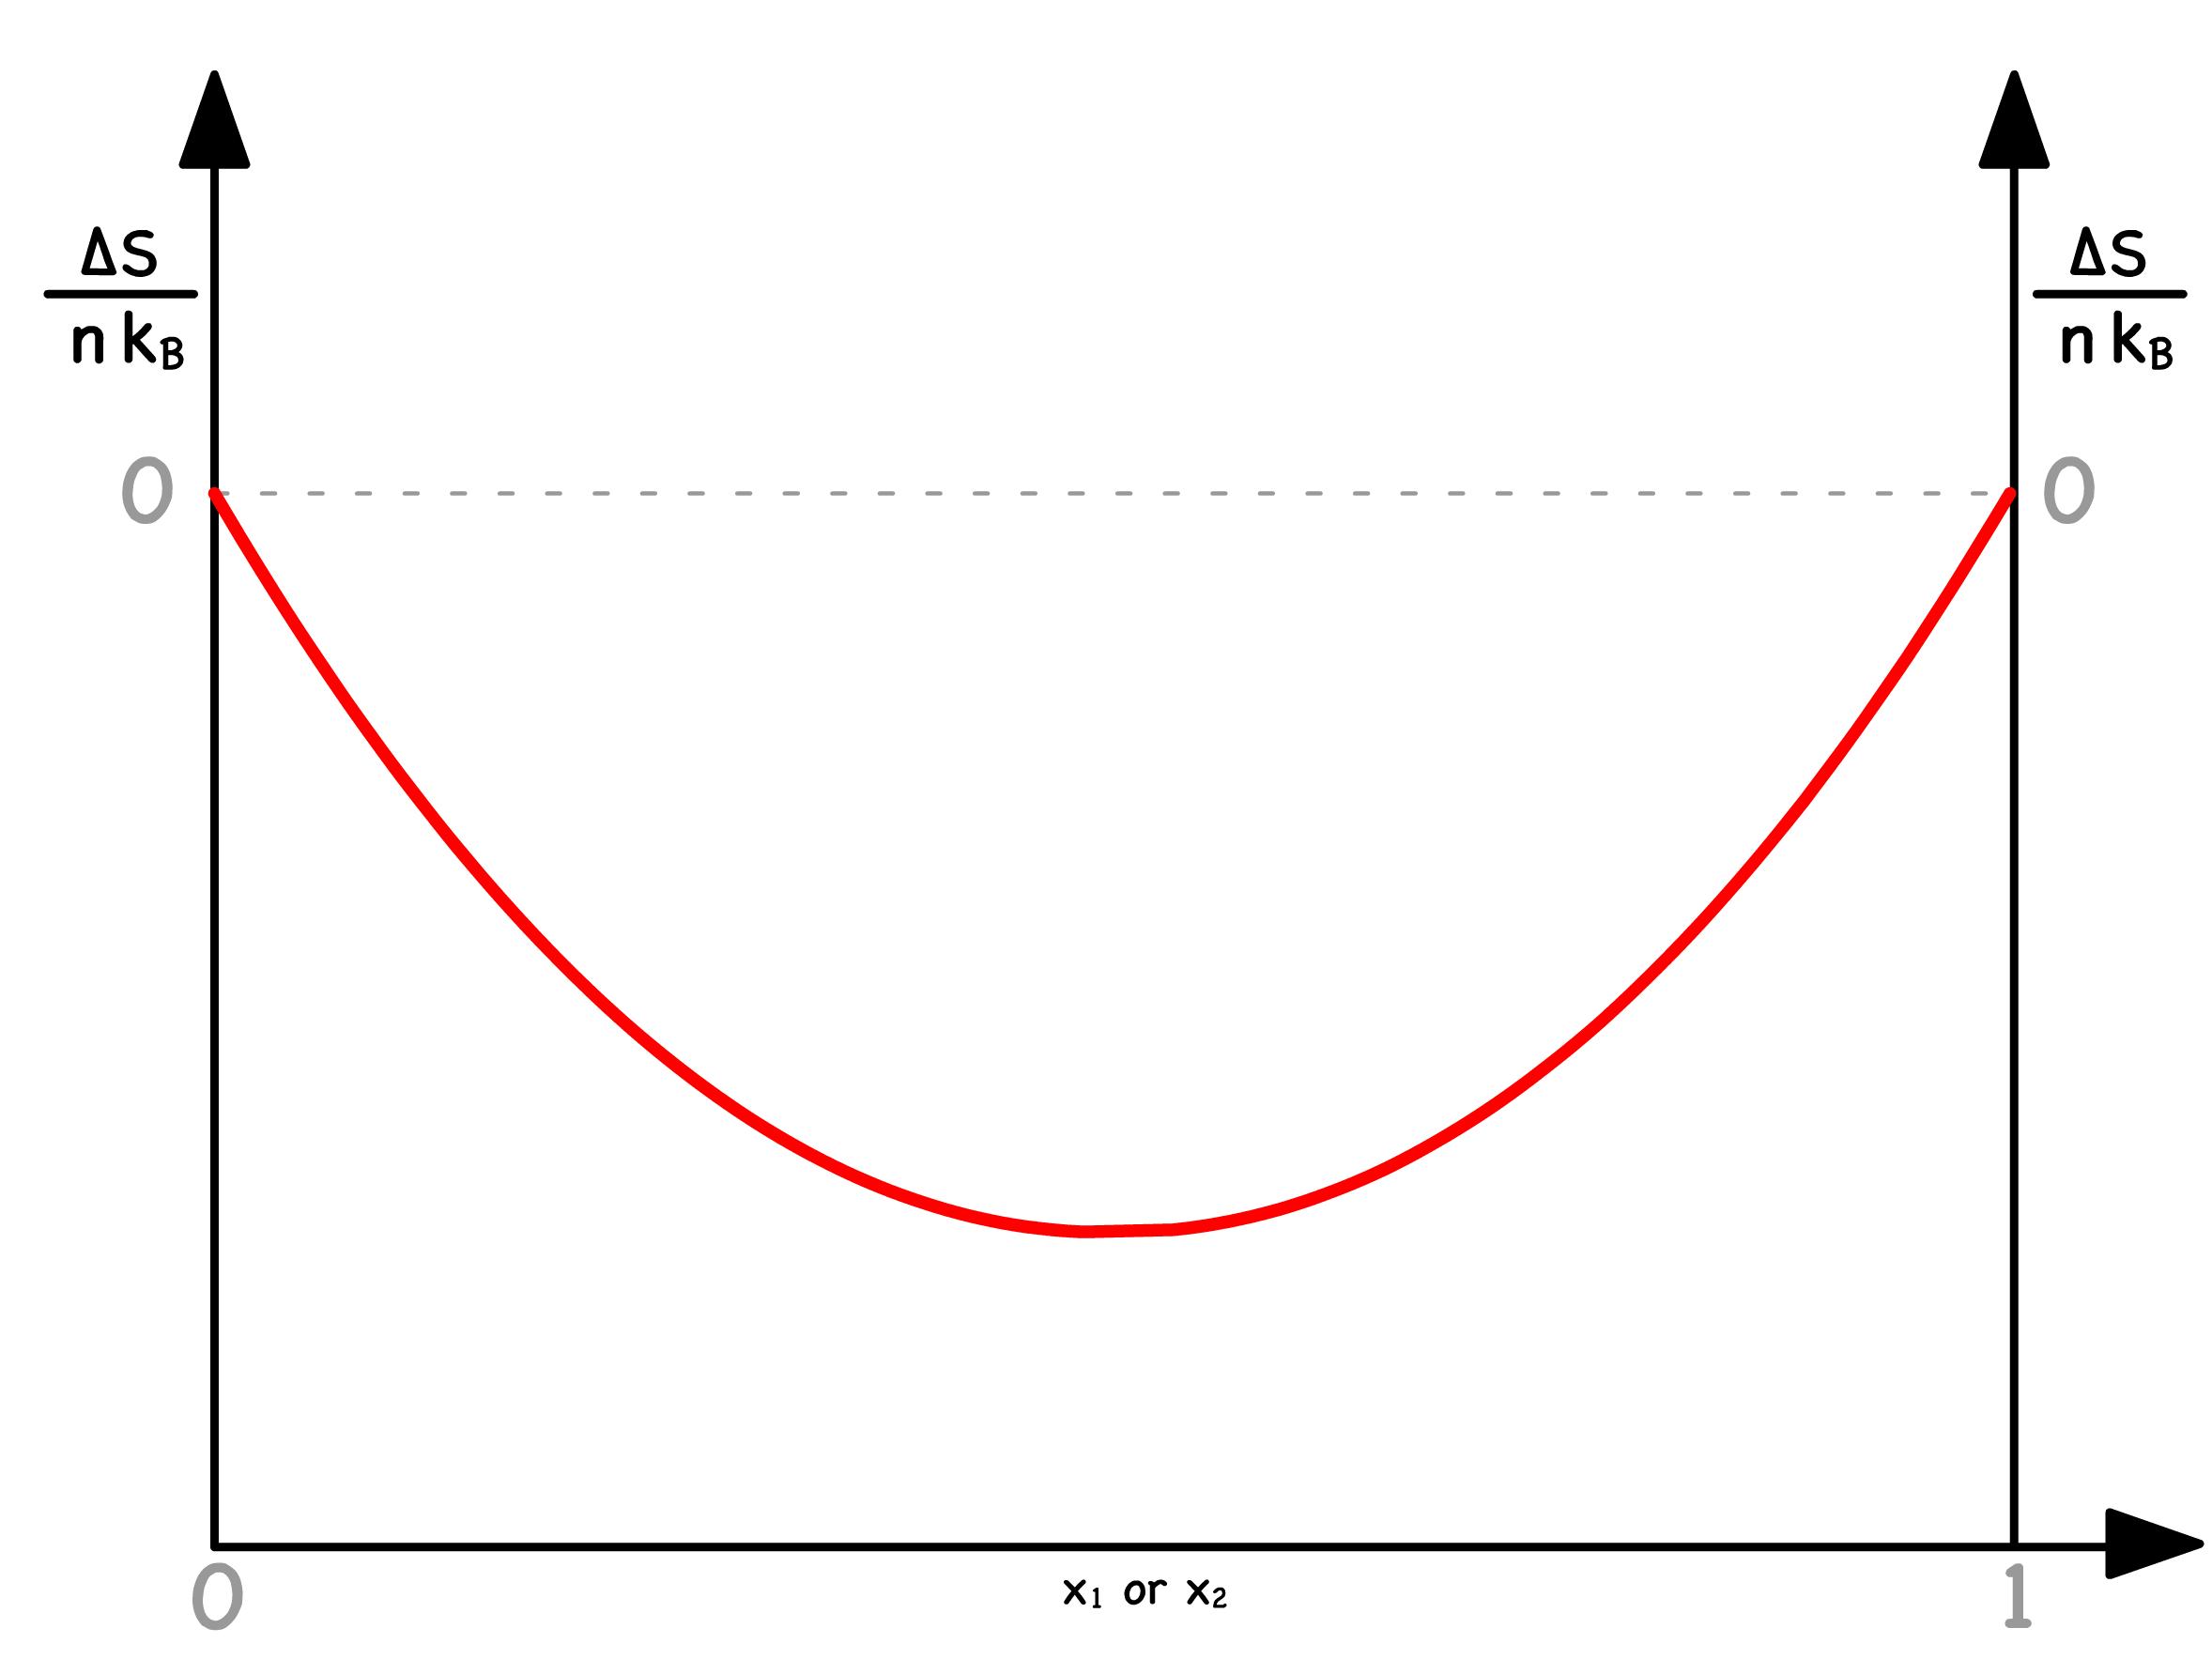
We have derived an expression of how the normalized change in entropy varies with composition
- Since and must be between and , must be negative at any composition
- This makes intuitive sense because mixing is entropically favoured
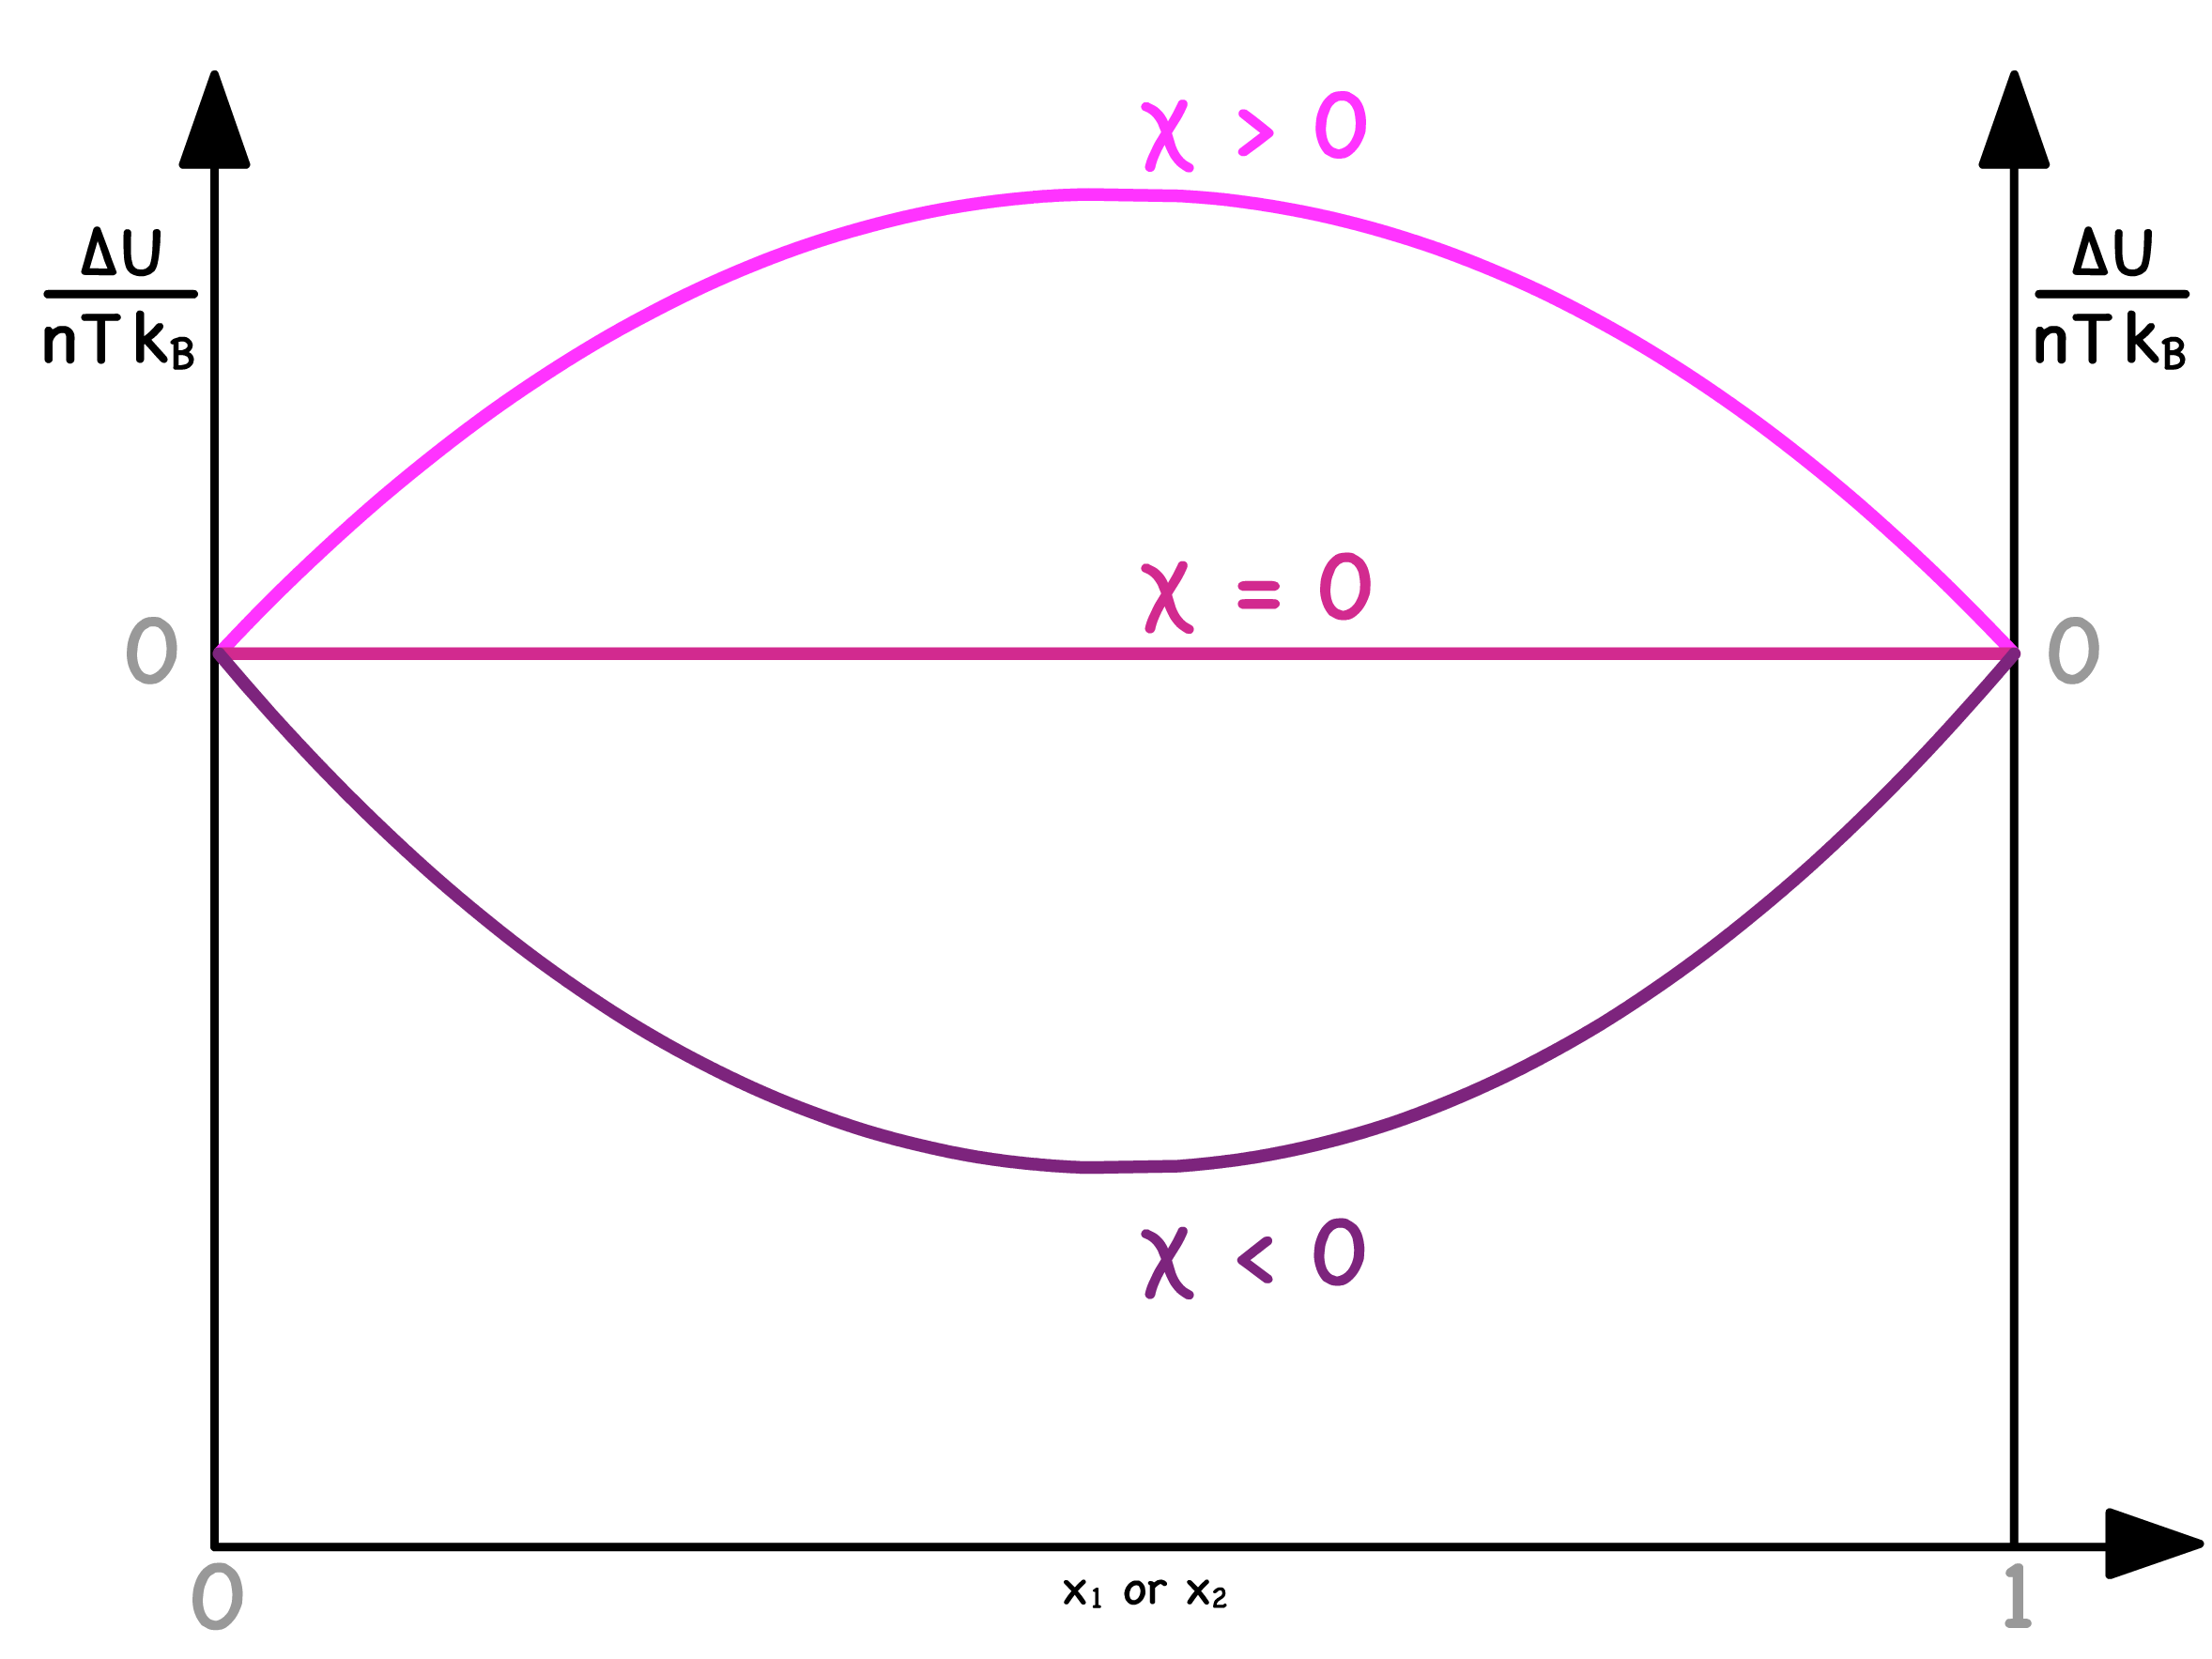
We have derived an expression of how the normalized change in internal energy varies with composition
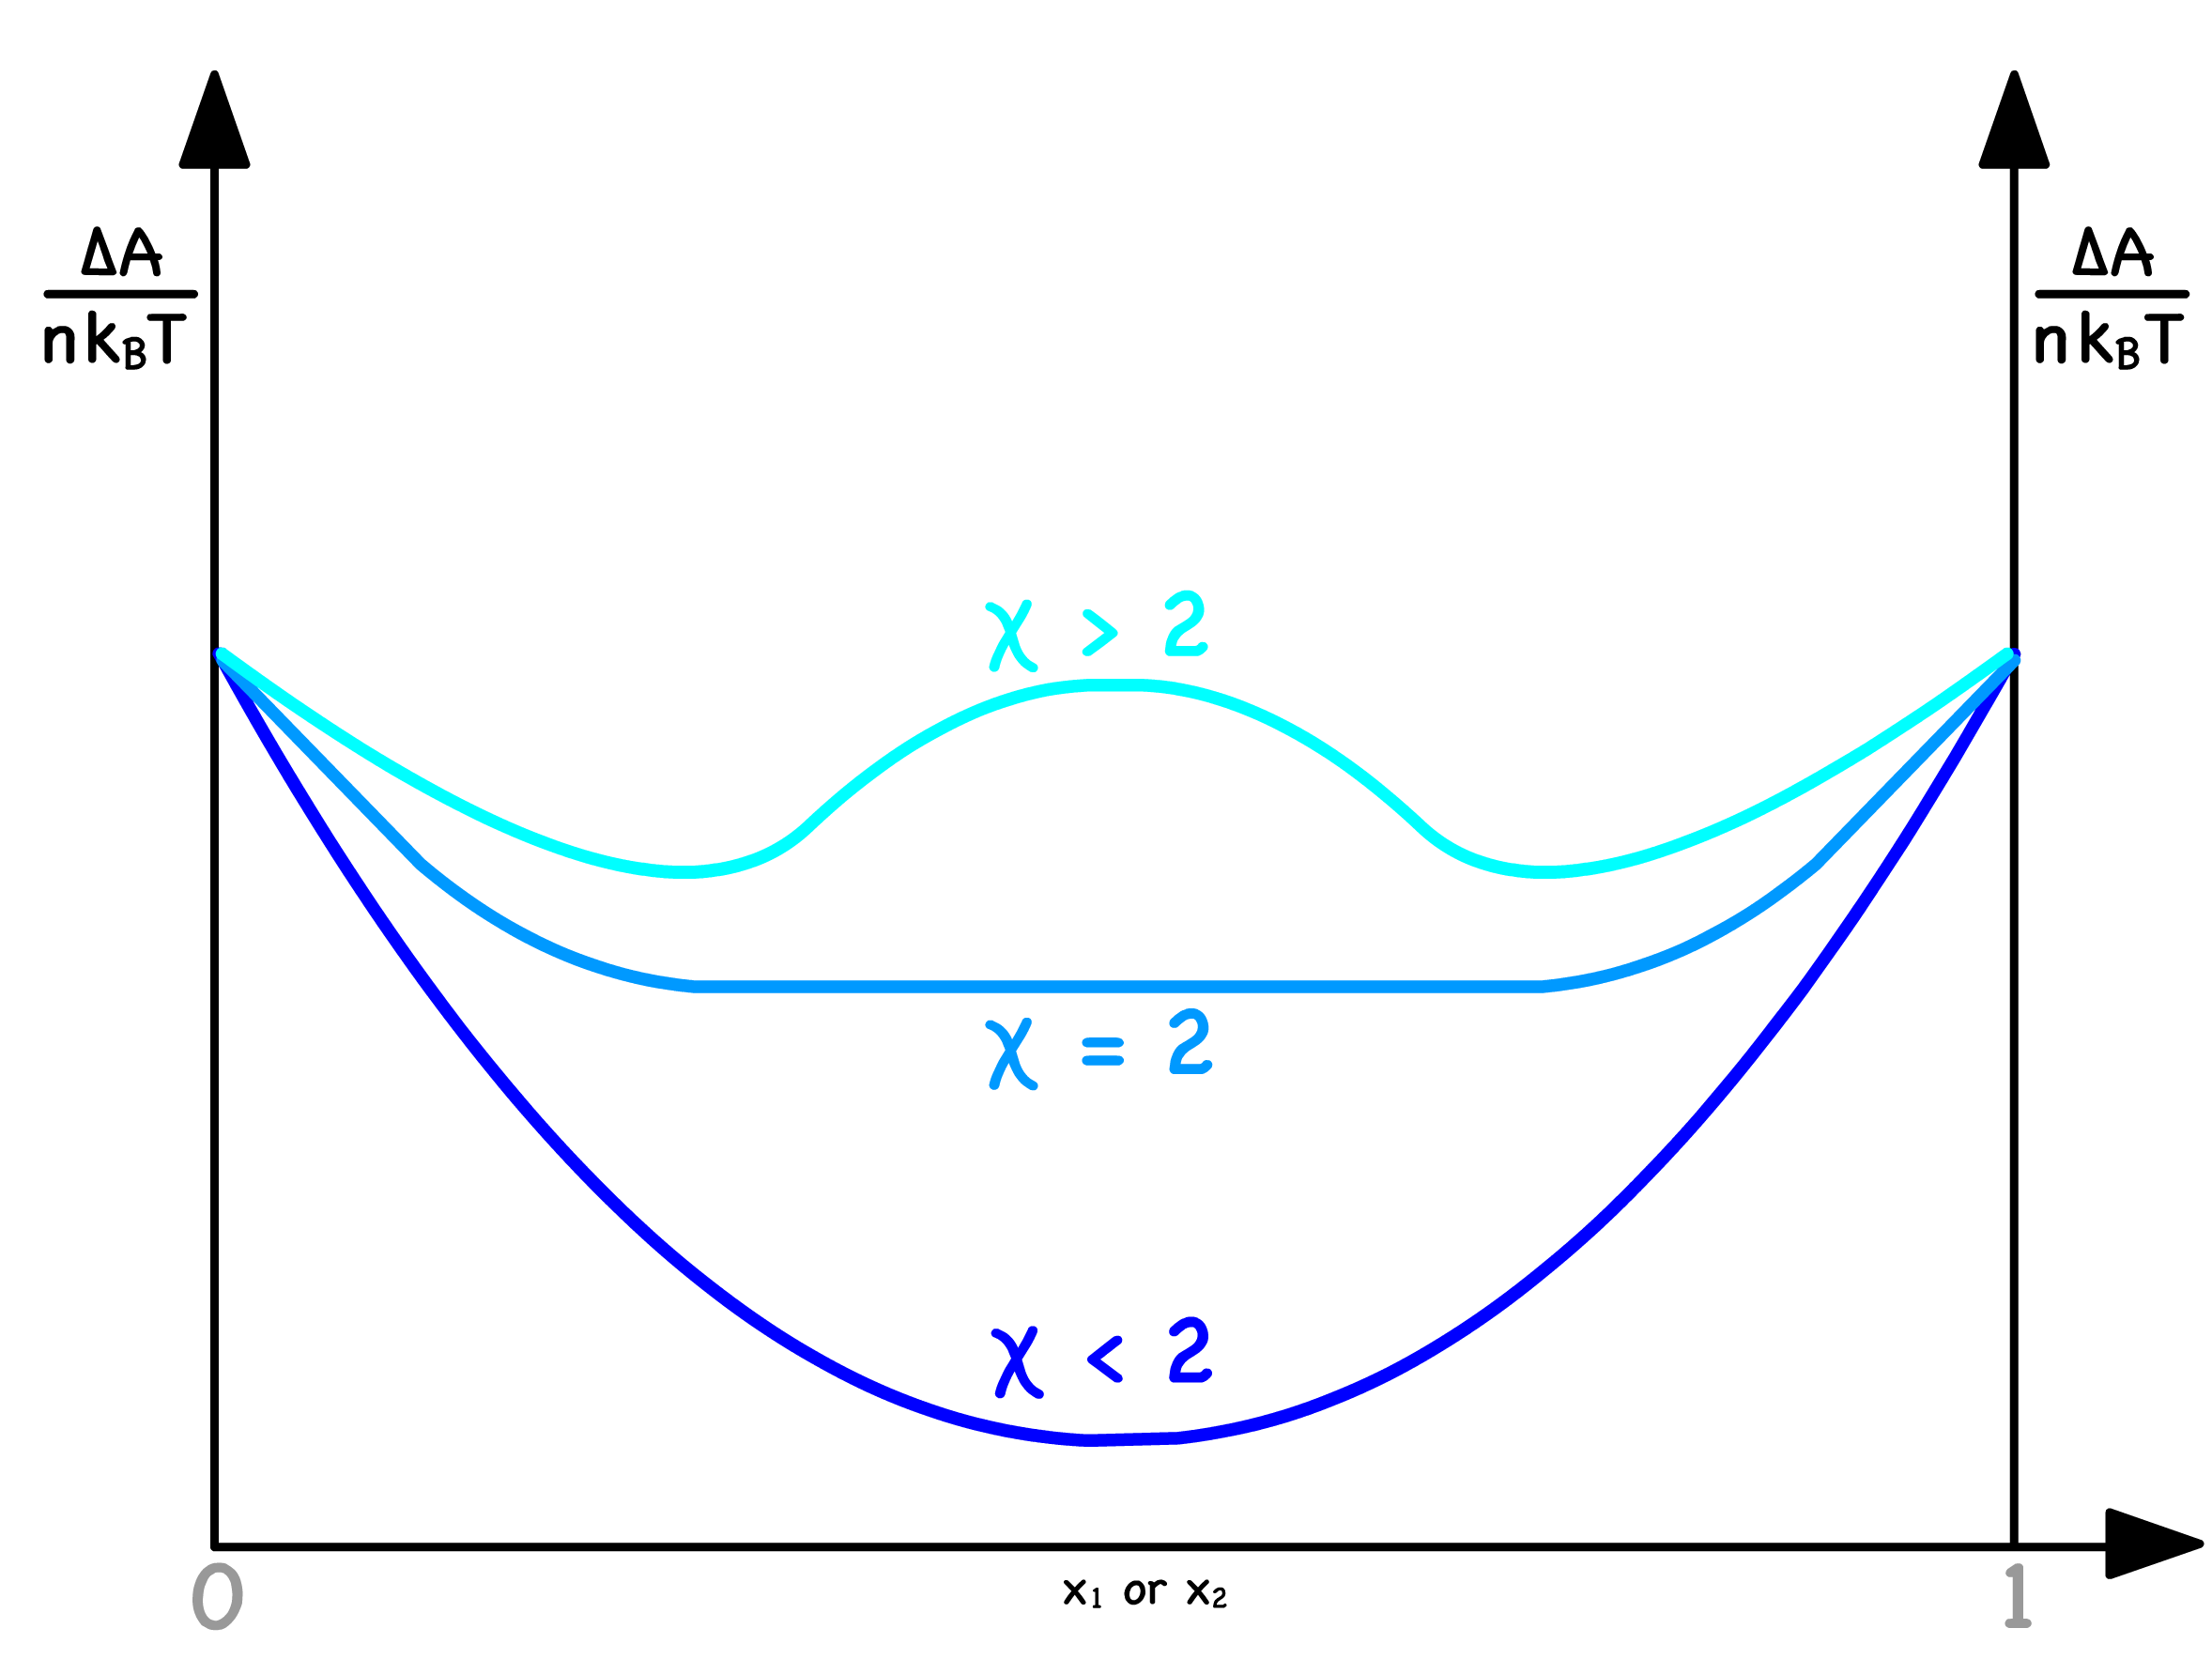
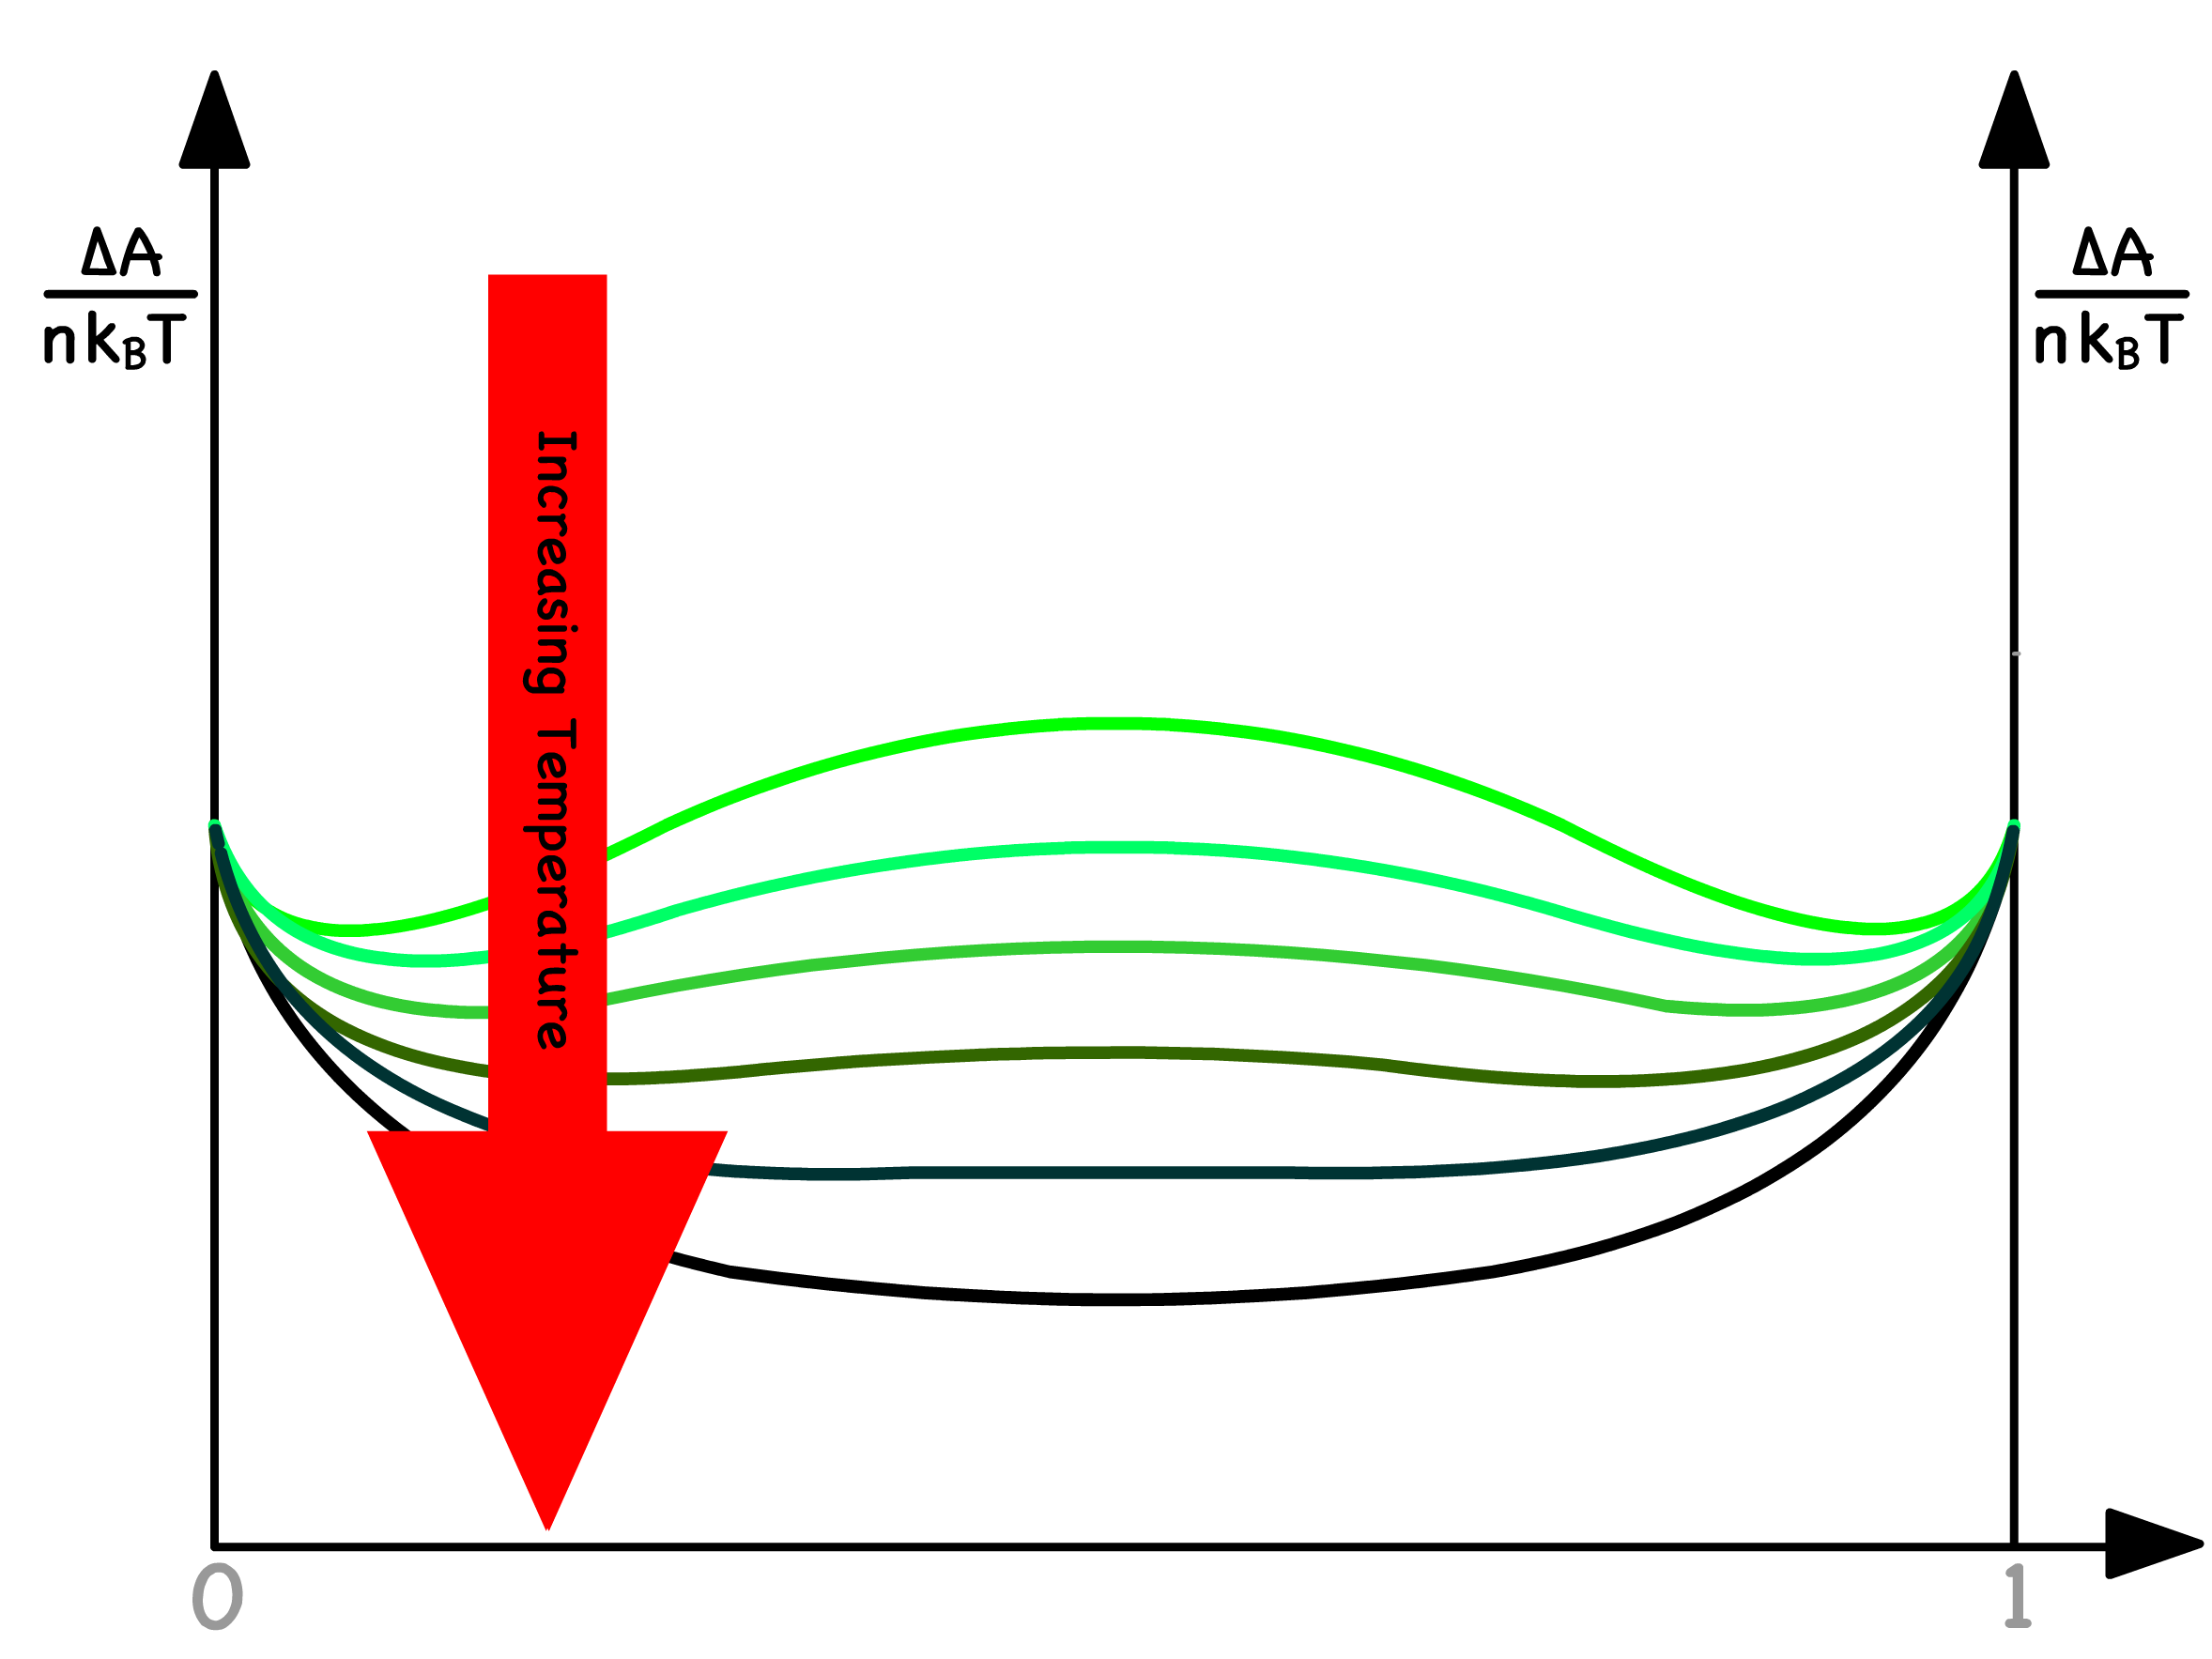
- The shape of the curve depends solely on
- When , mixing is energetically favorable ; When , ideal mixing occurs ; When , mixing is energetically unfavorable
Using the expression of normalized change in entropy and internal energy, we can derived an expression for the normalized change in Helmholtz energy
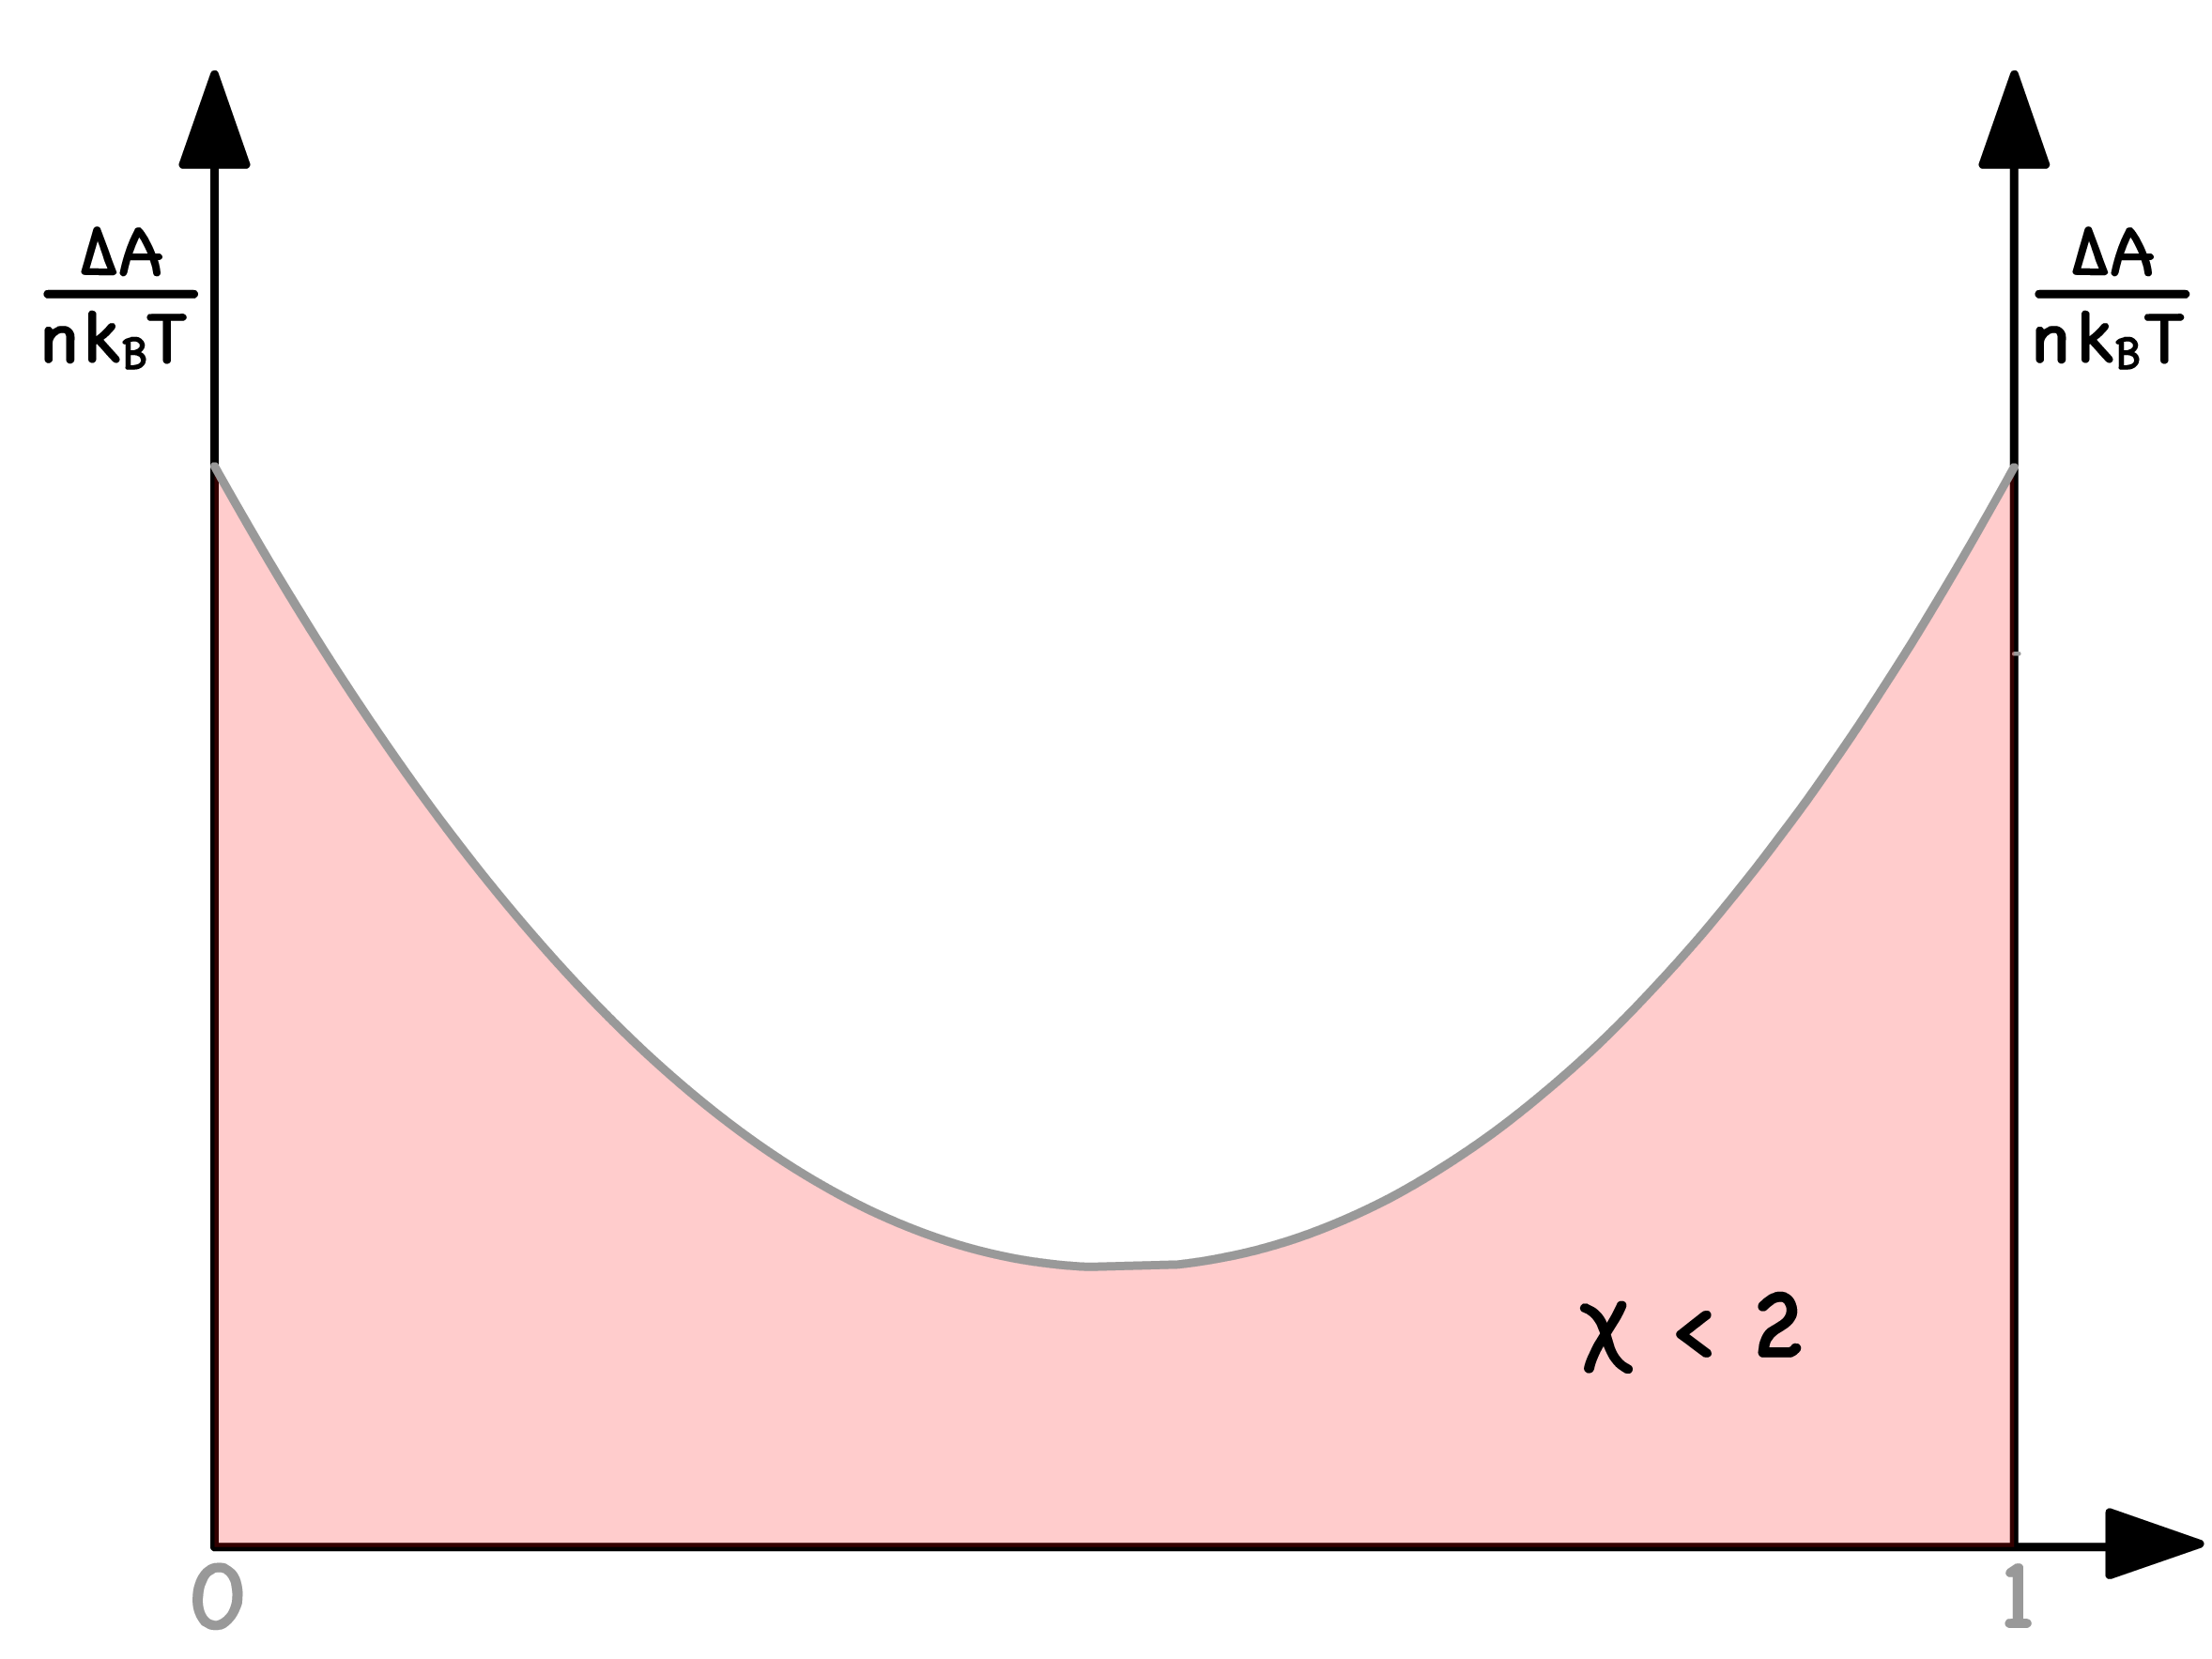
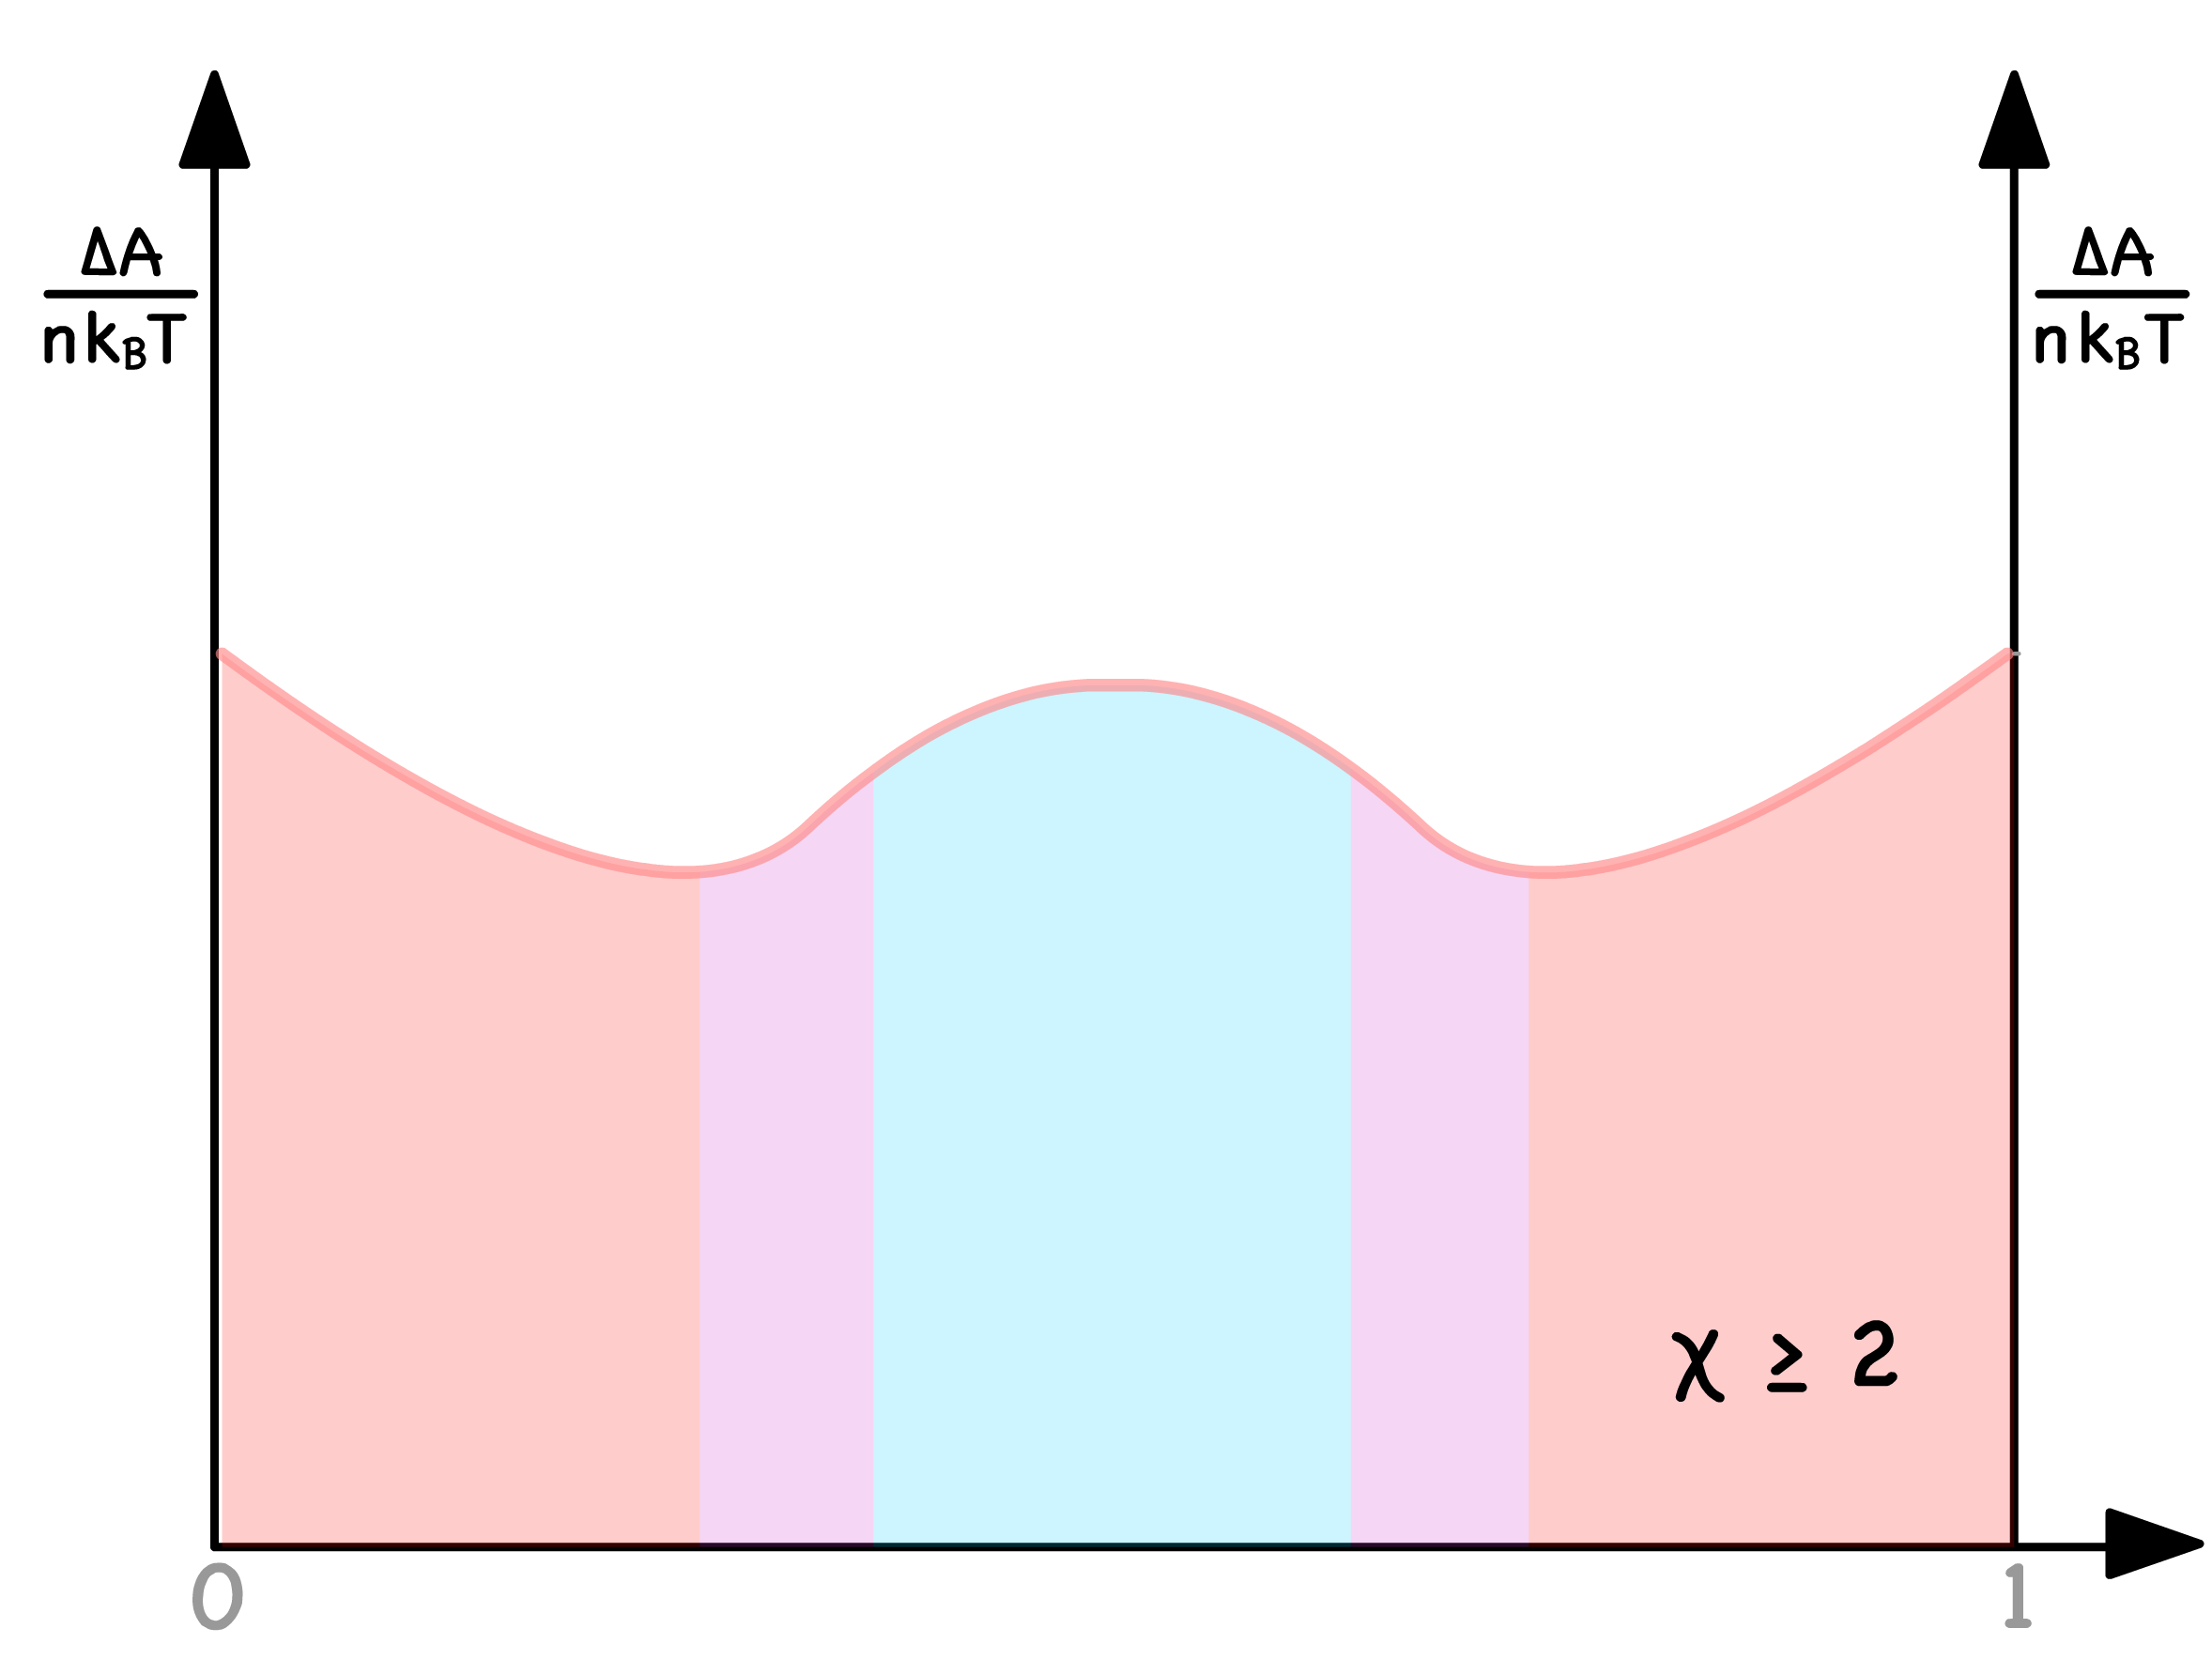
- The shape of the curve depends solely on
- The curve exhibits a single minimum at for ; The curve has two minima and one maximum when
Separated vs Mixed
To predict the spontaneity of a reaction, we need to compare the value of the free energy of the mixed and the separated situation
- Now that we have plotted it out, we should be able to make the comparison graphically
- Sicne we are dealing with binary systems, we only need to know the mole fraction of one component
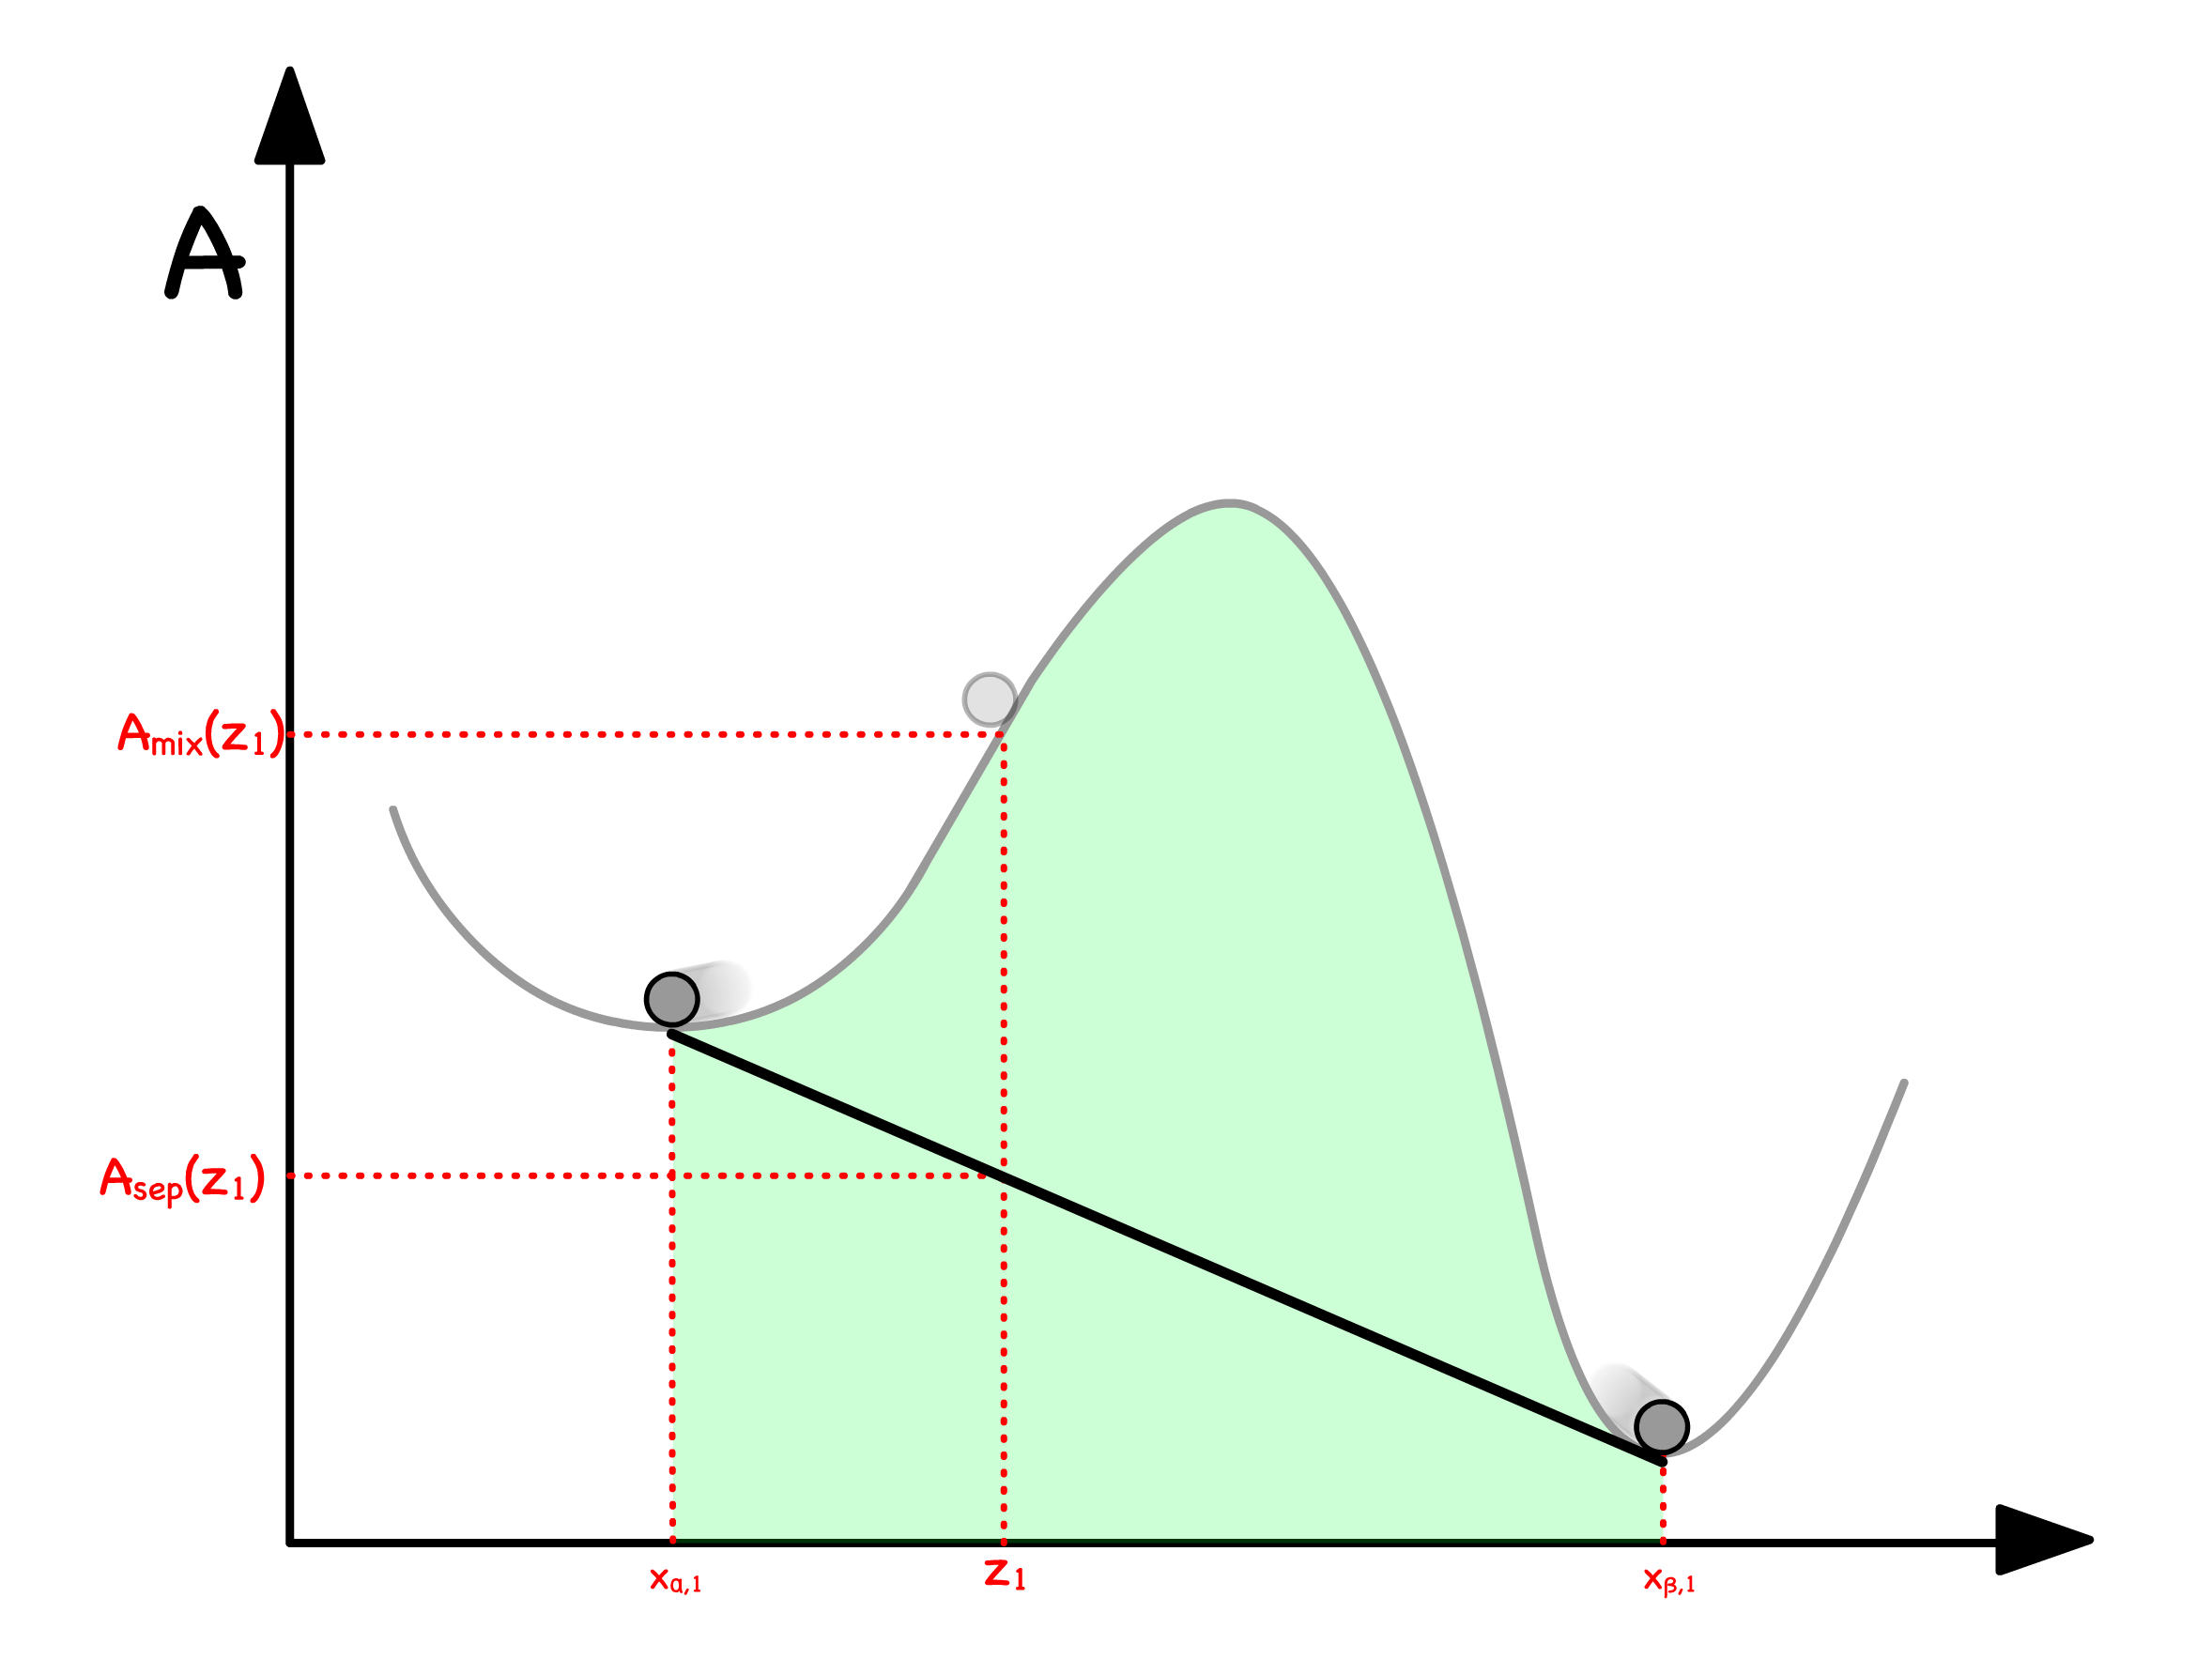
We can determine the free enrgy of separation from the curve
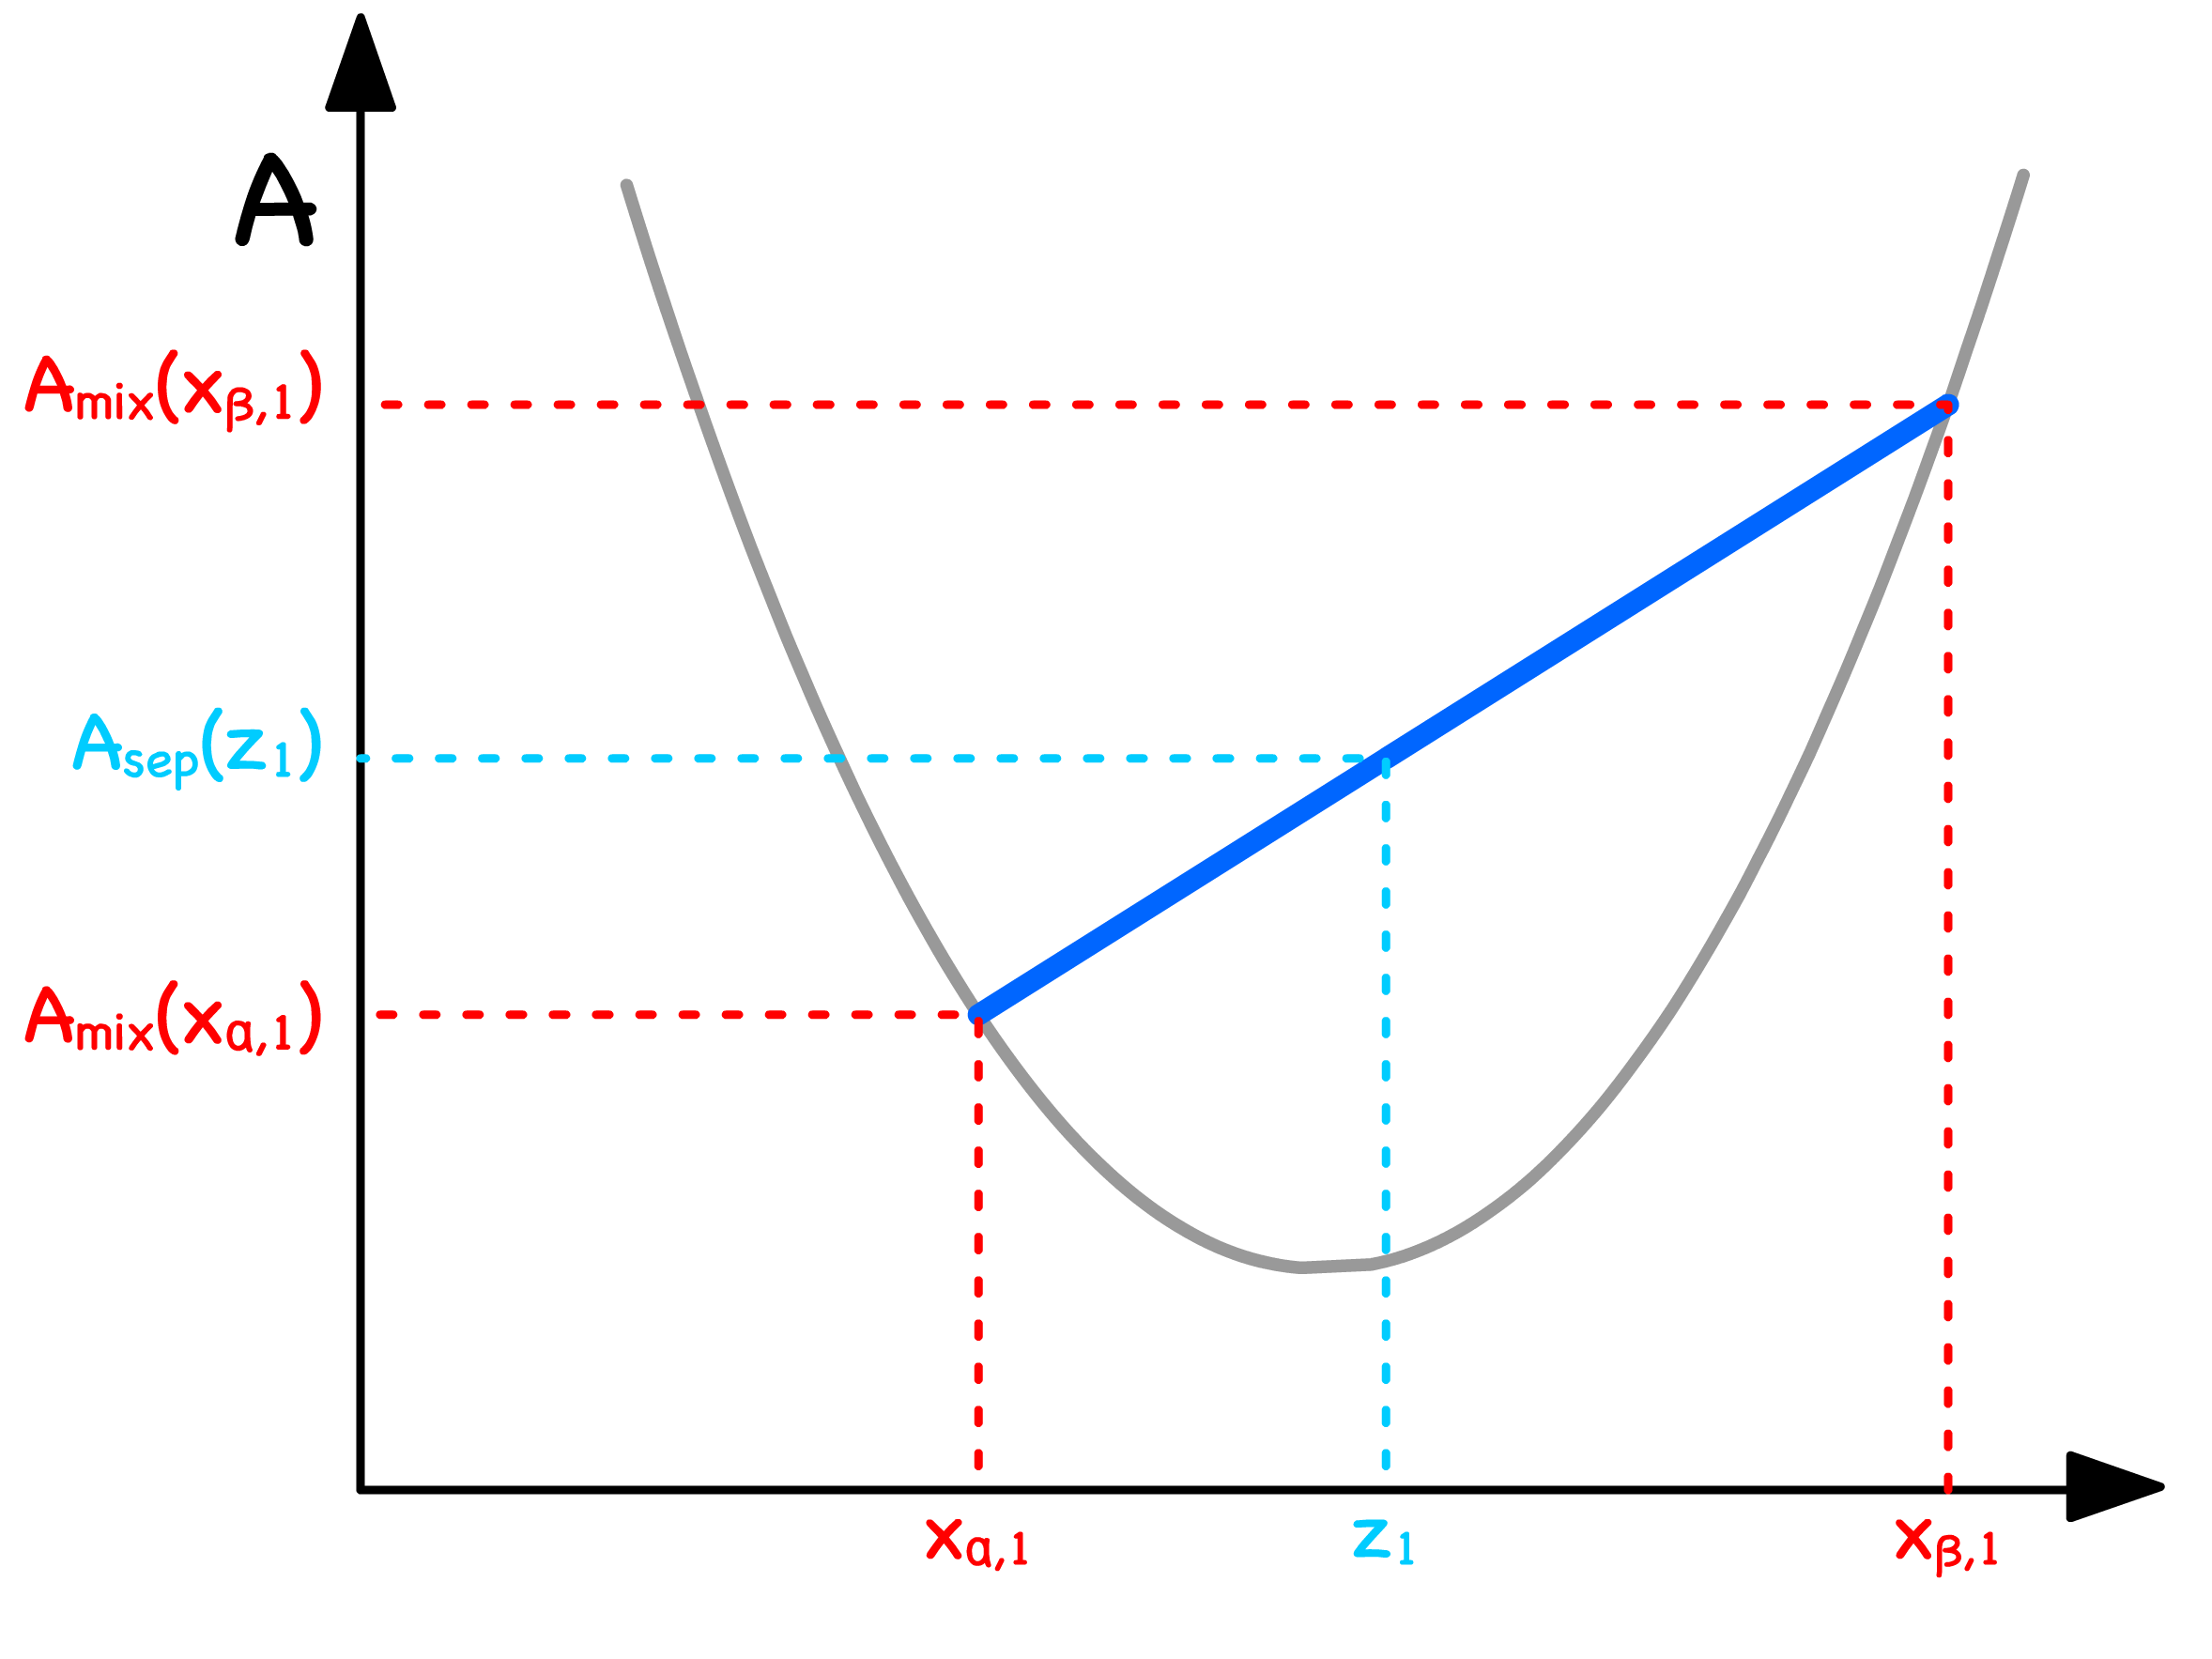
- Let us consider a situation where a mixture with mole fraction separates into two phases ( Phase and Phase )
- The total free energy will just be the weighted sum of free energy of the two phases
- The Volume fraction can be expressed in terms of mole fractions
- Substituting that back to the original equation will give us
- Graphically, this means that we can read off by drawing a line in between and
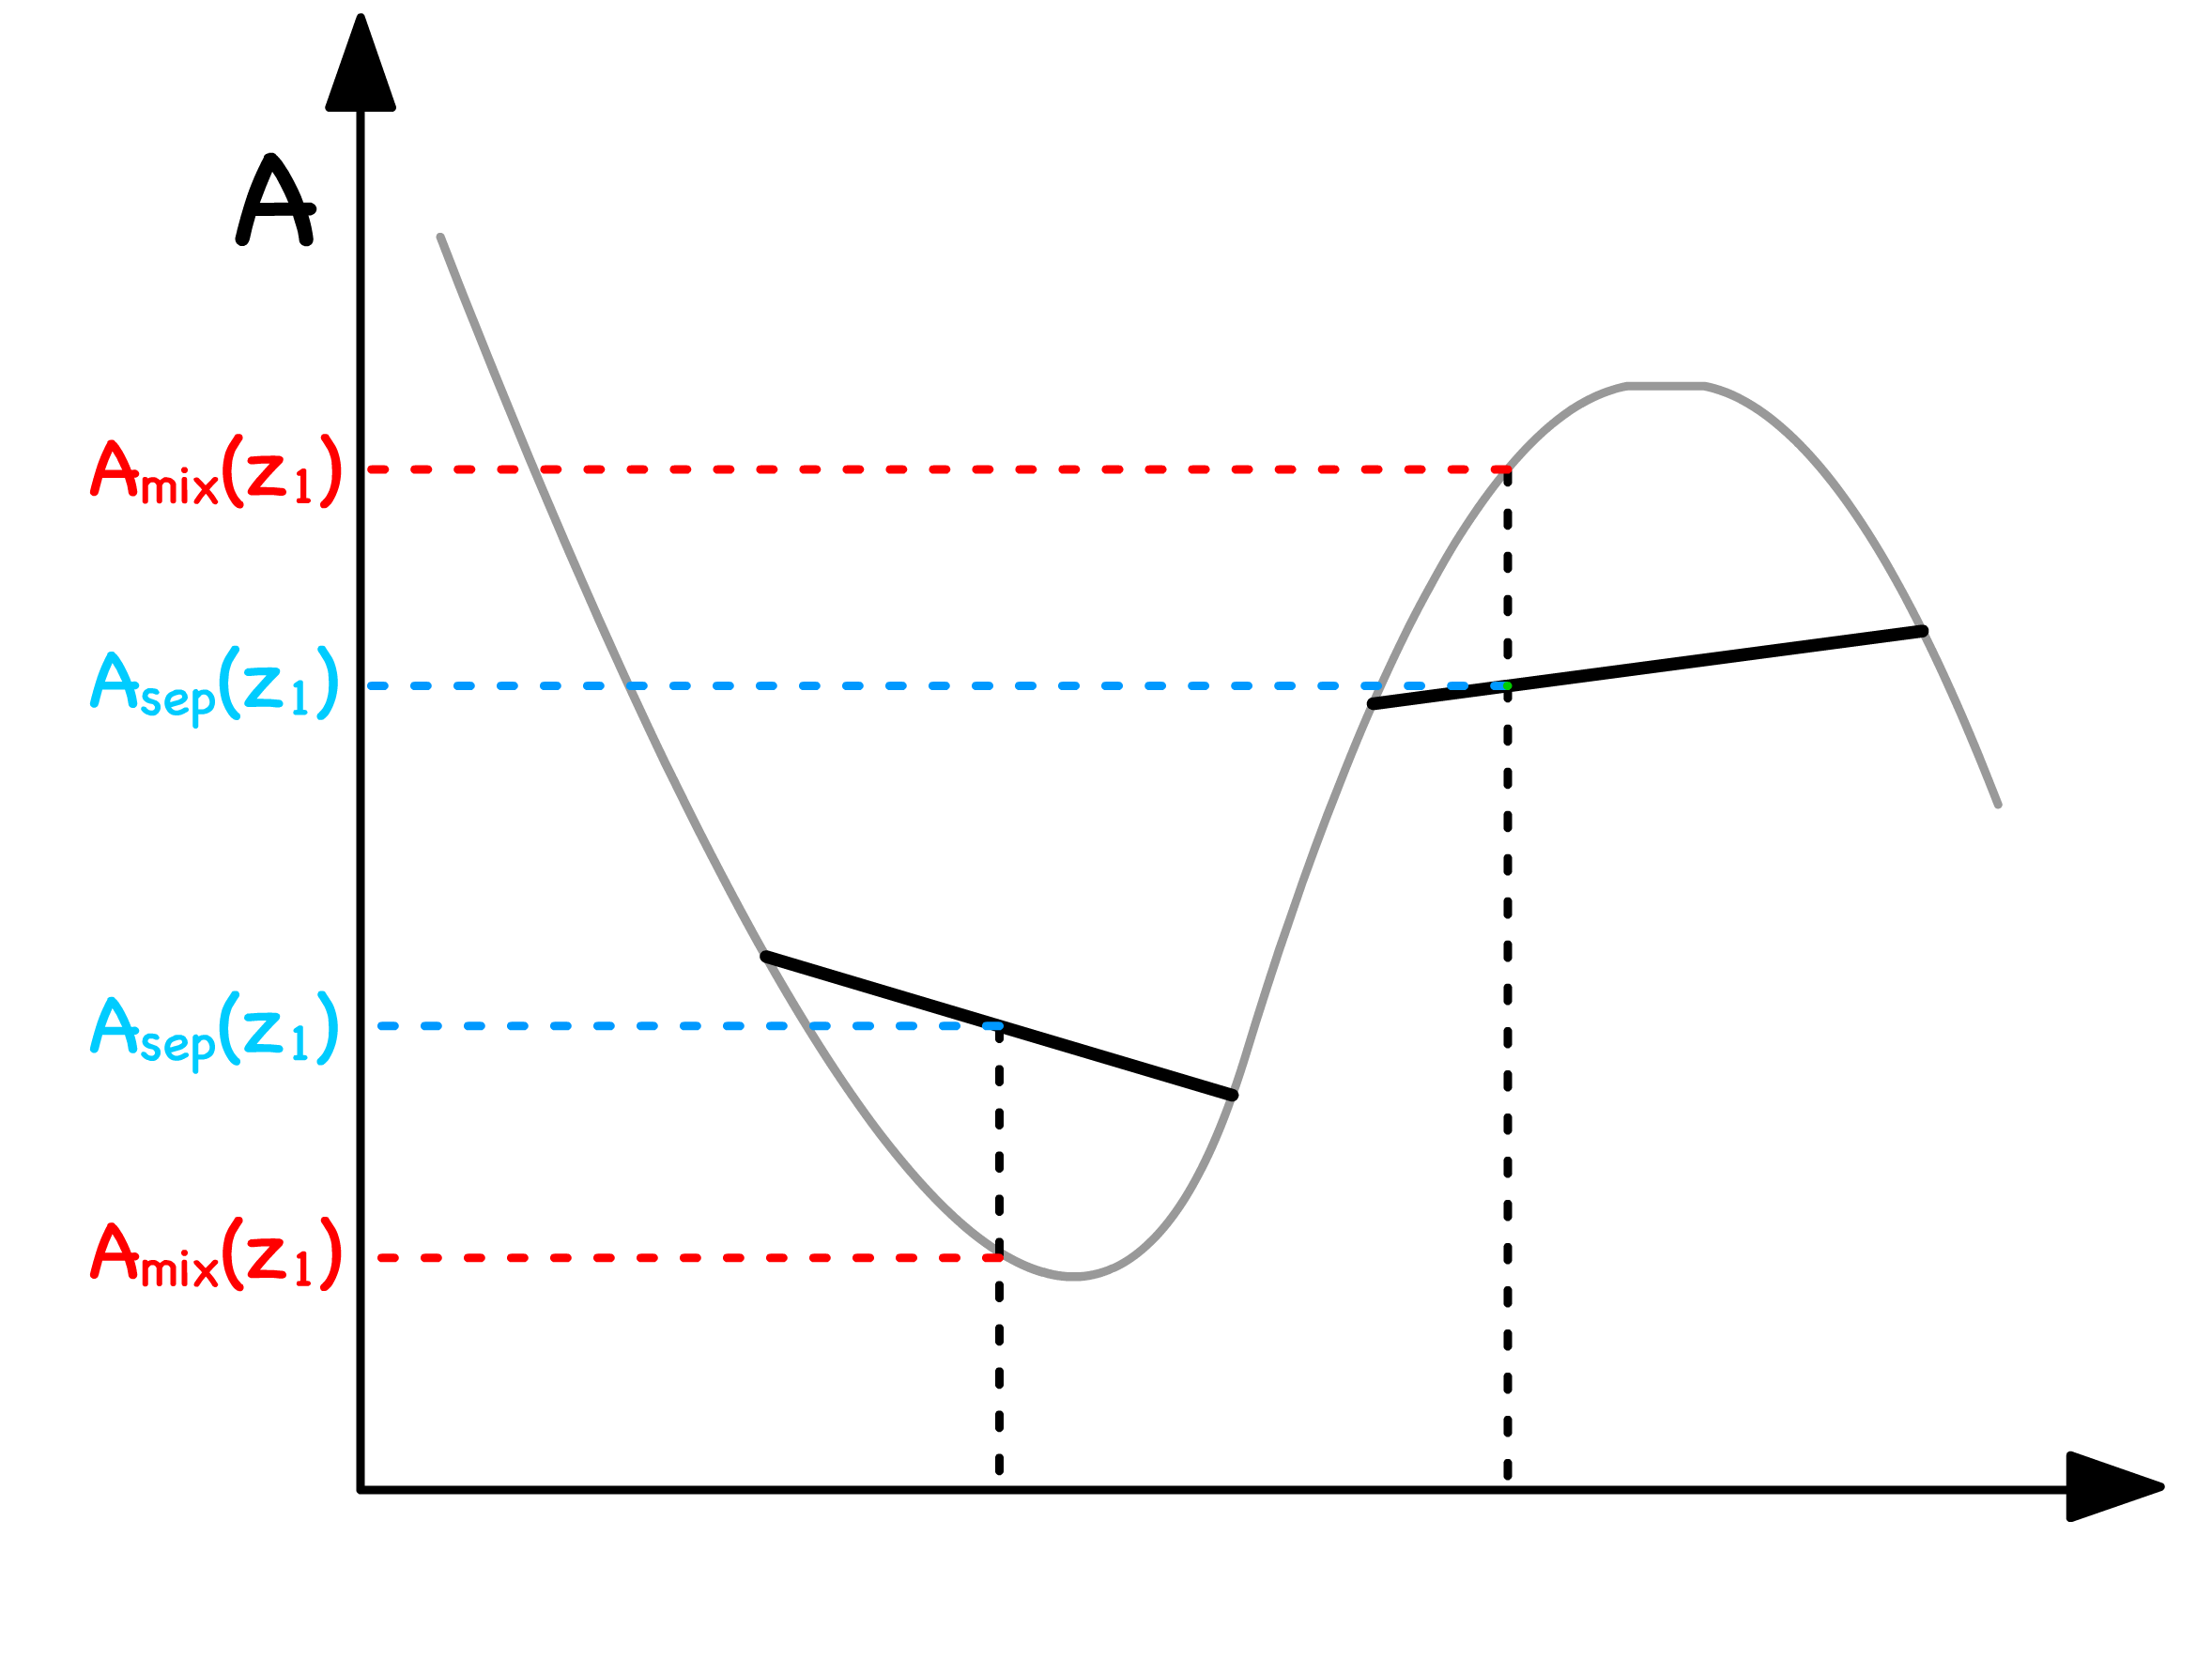
We are now in a position to graphically determine whether separating or staying mixed has a lower free energy
- If the line is above the curve, the separated state has a higher free enrgy ; If the line is below the curve, the separated state has a lower free enrgy
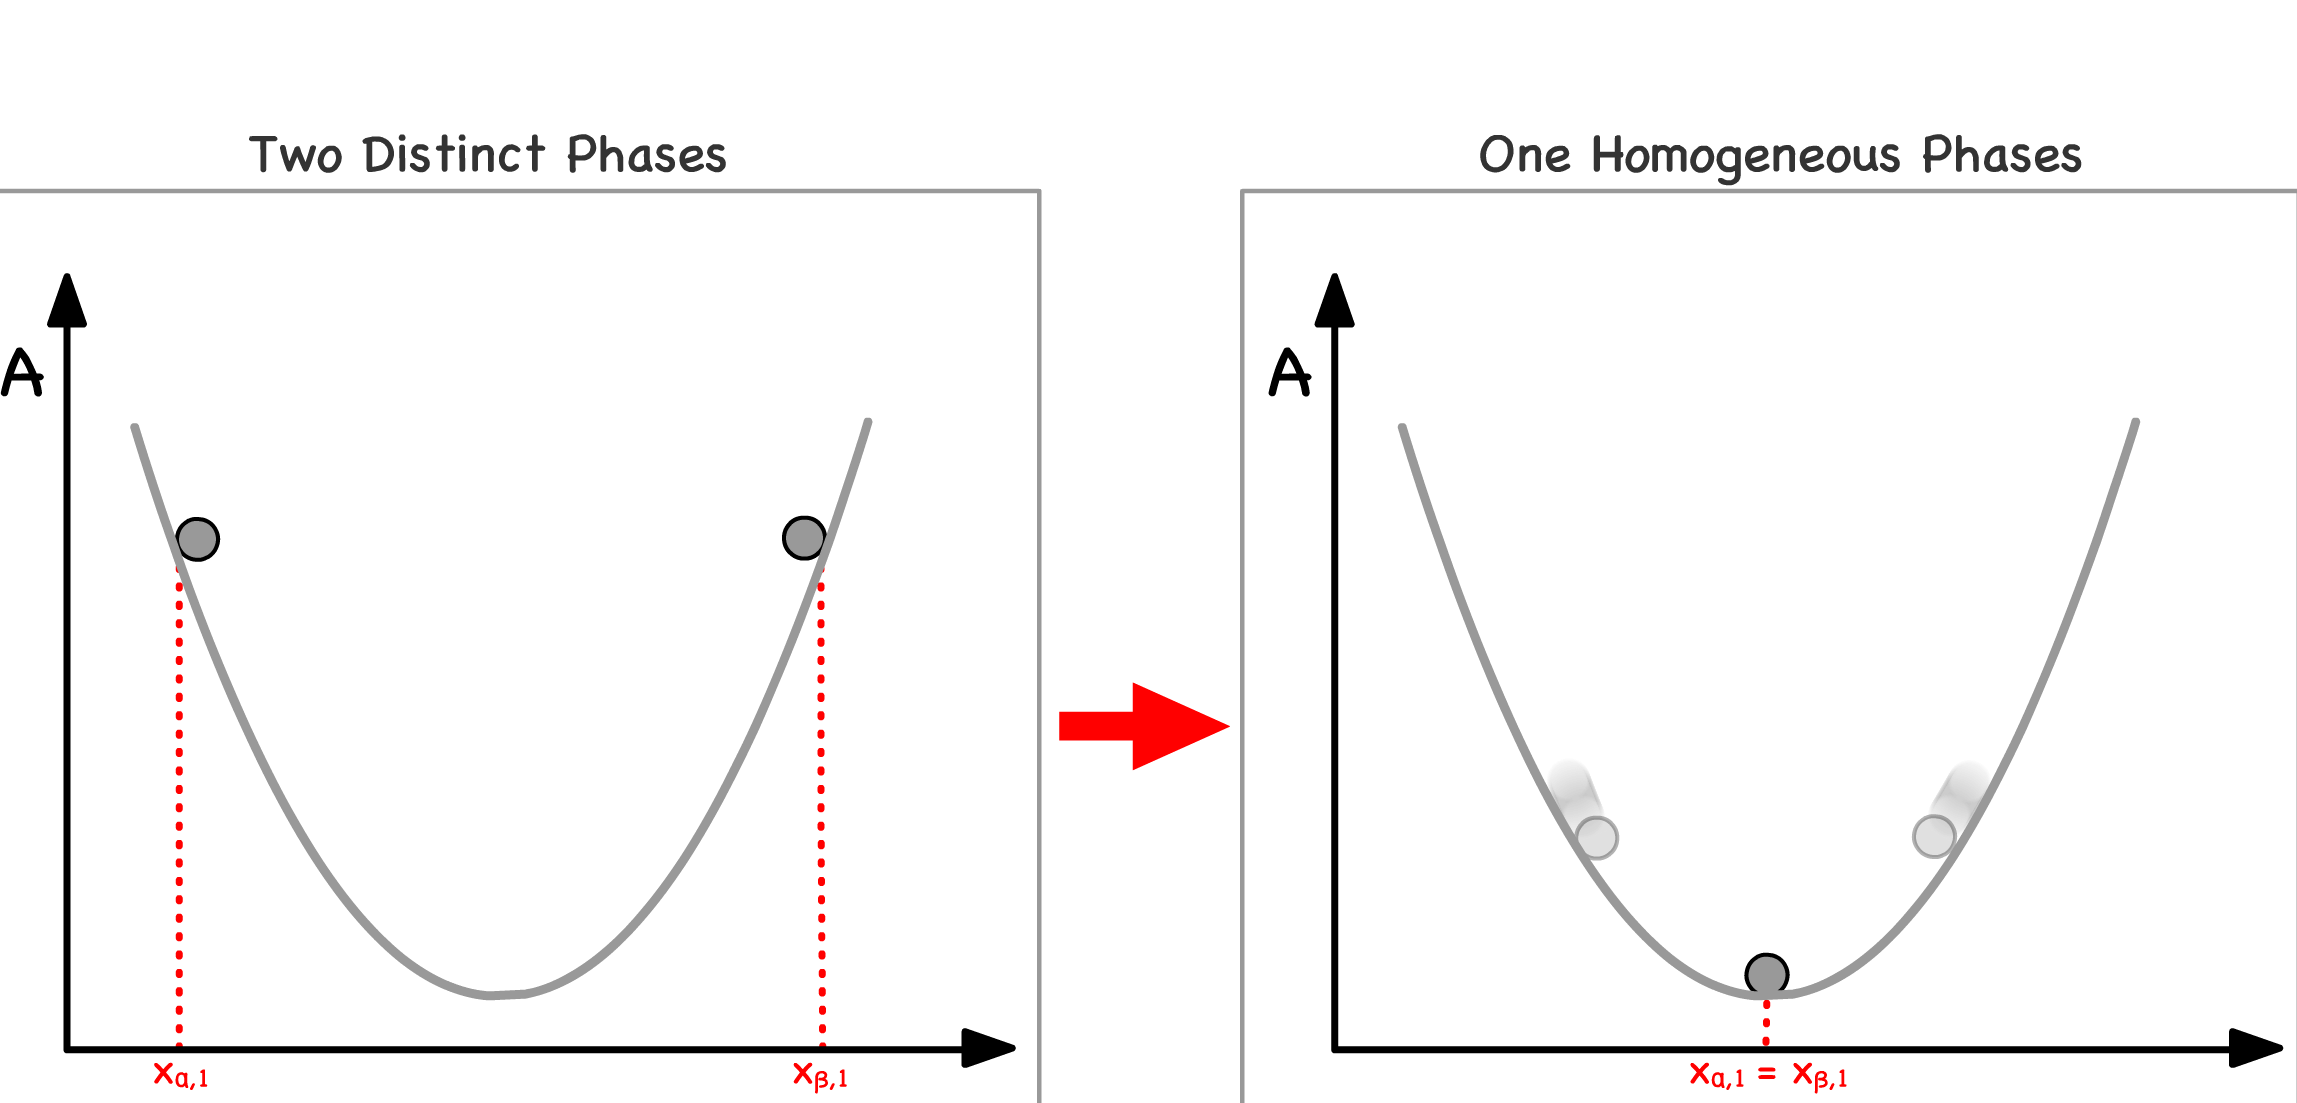
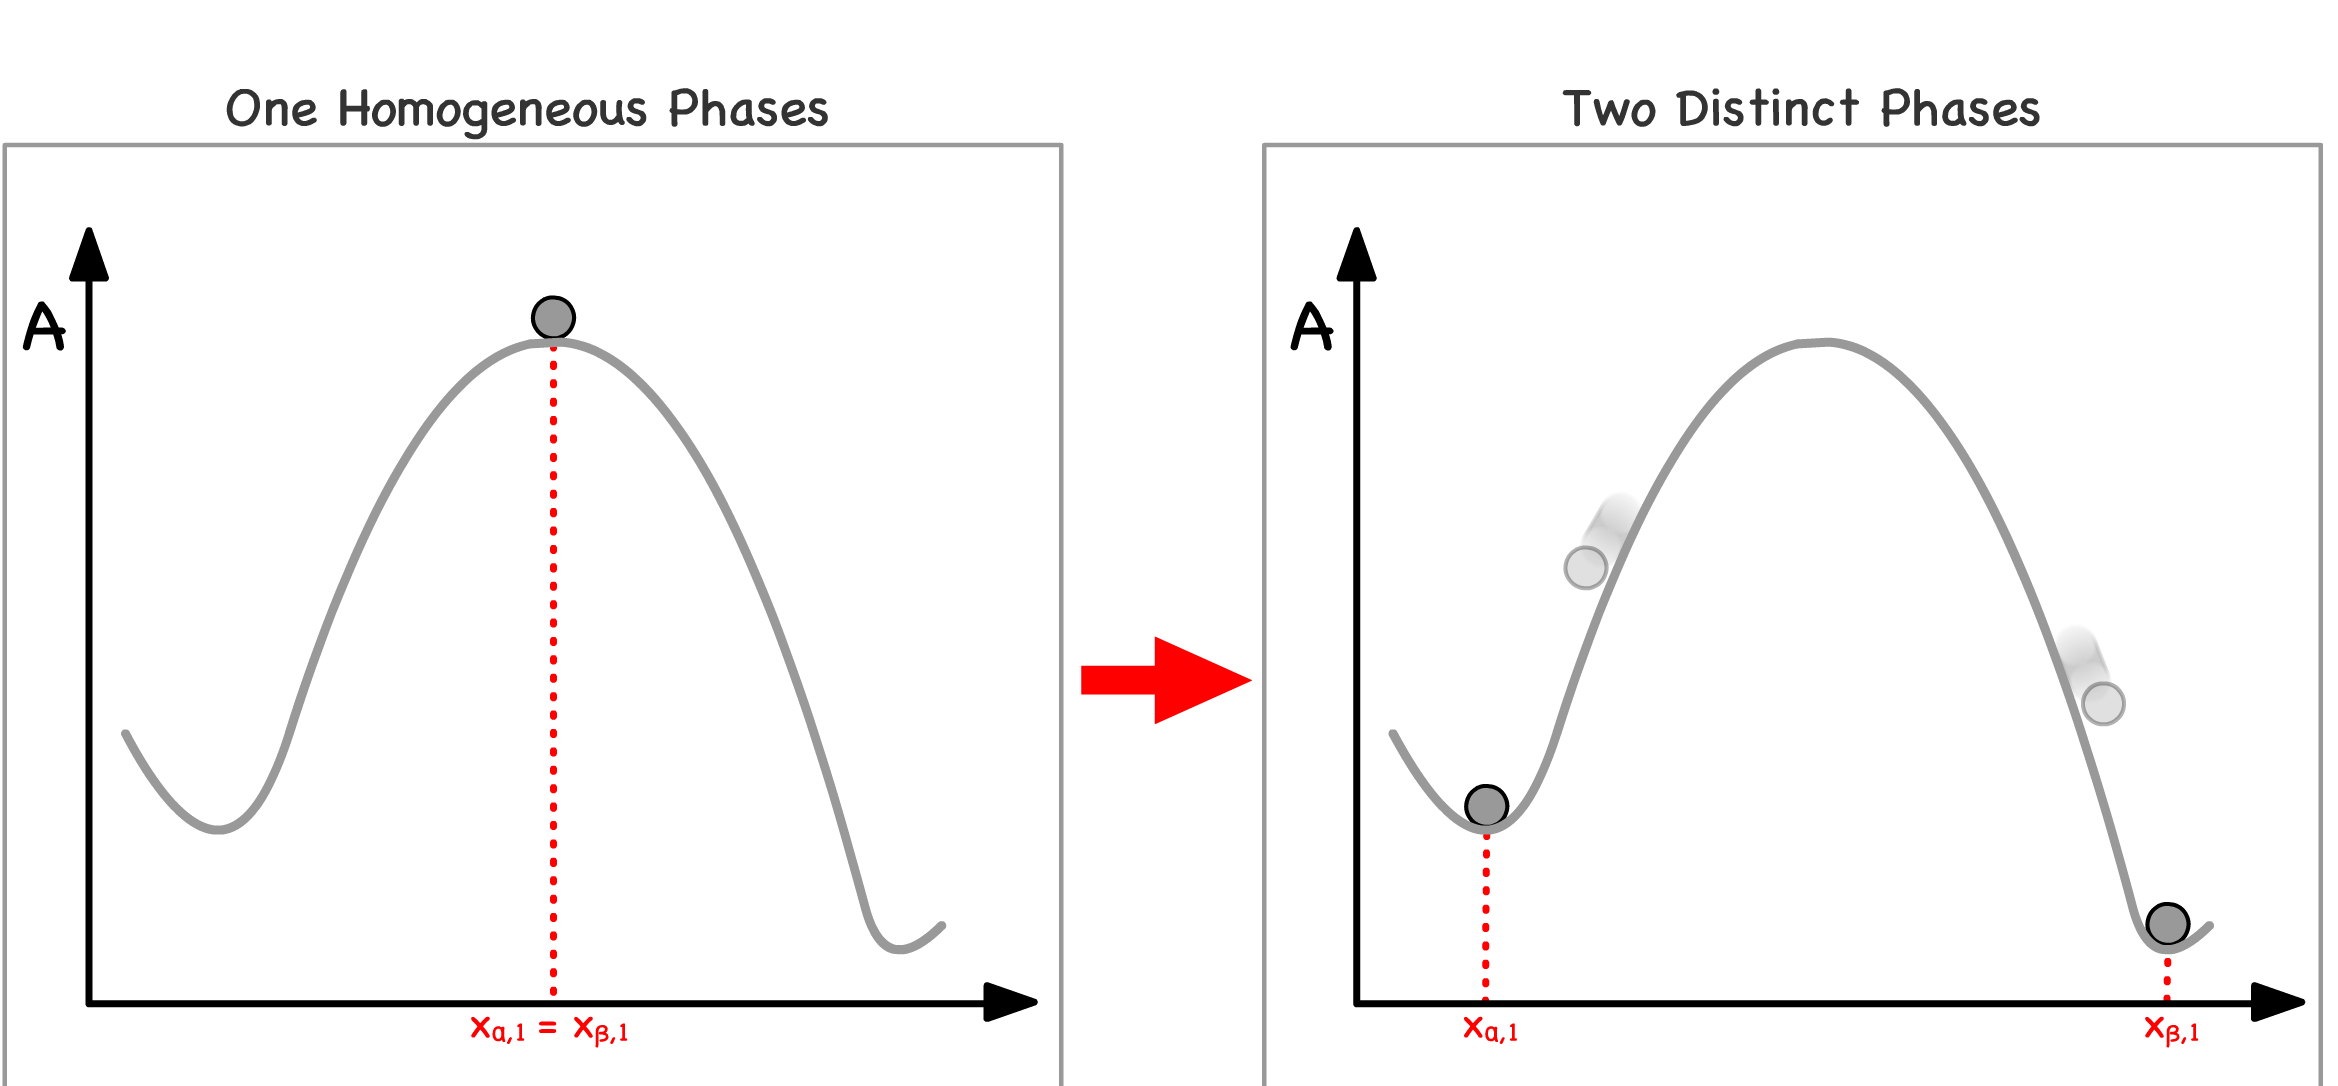
A Pair of Balls
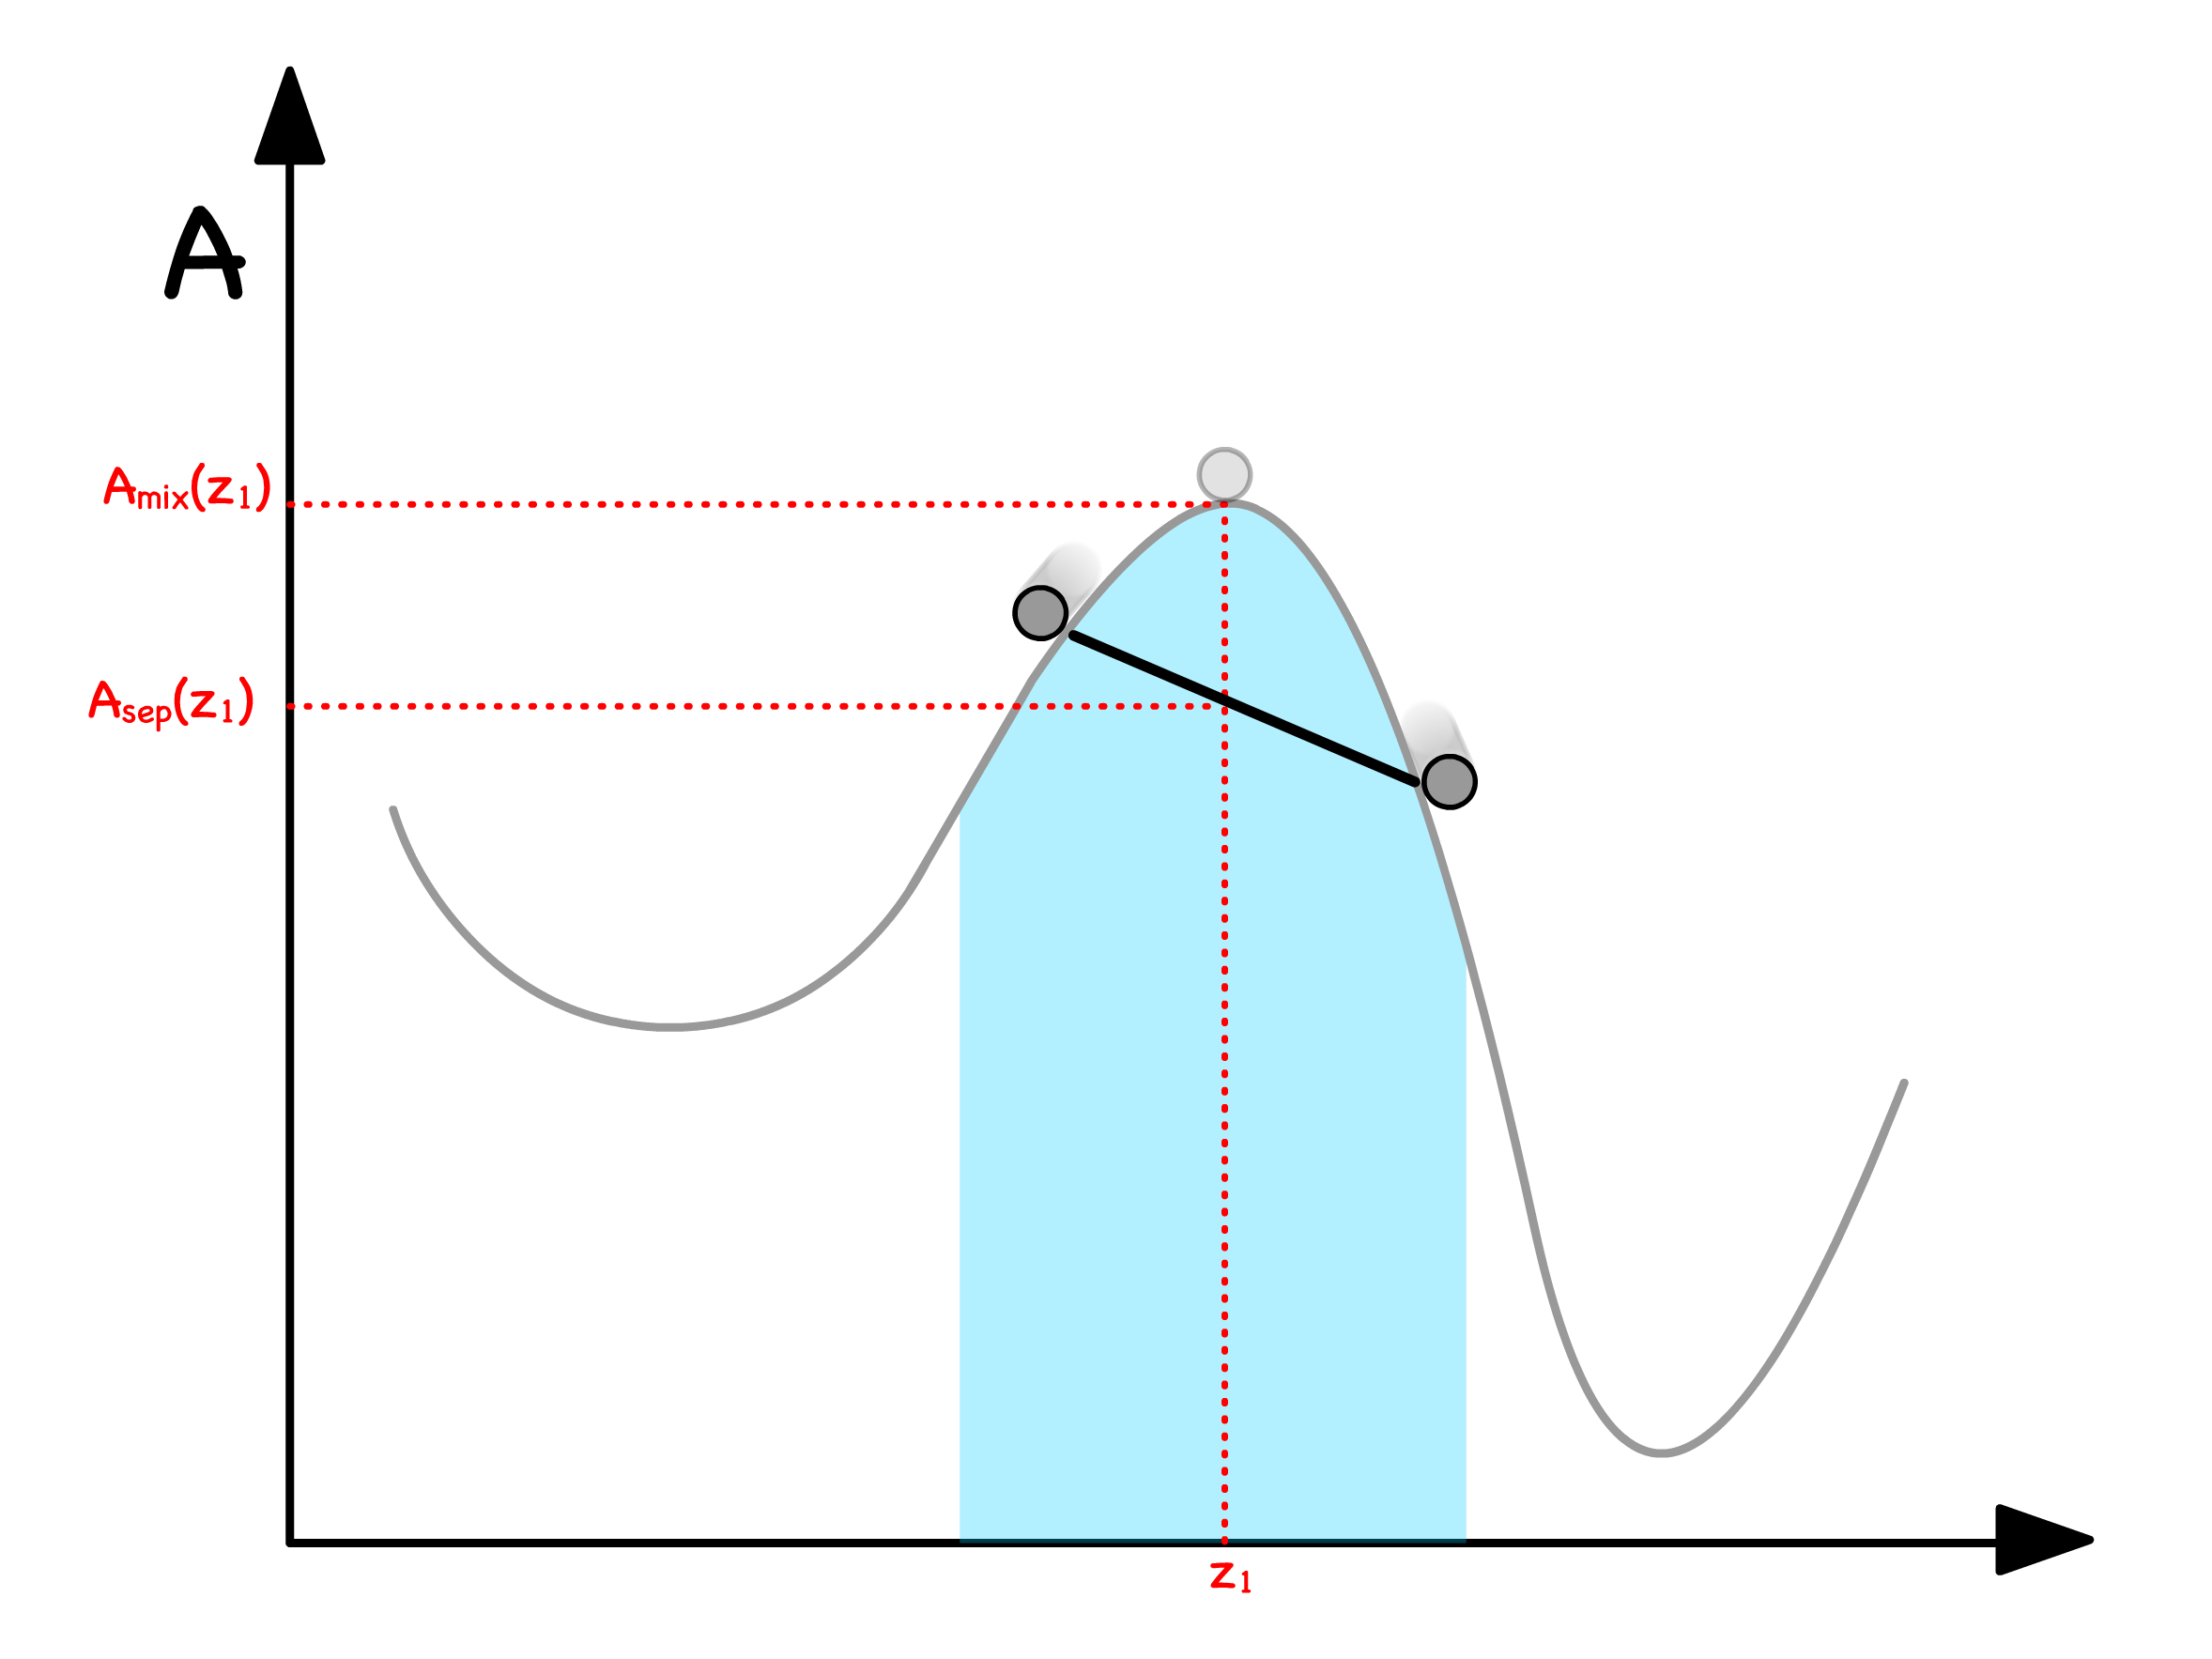
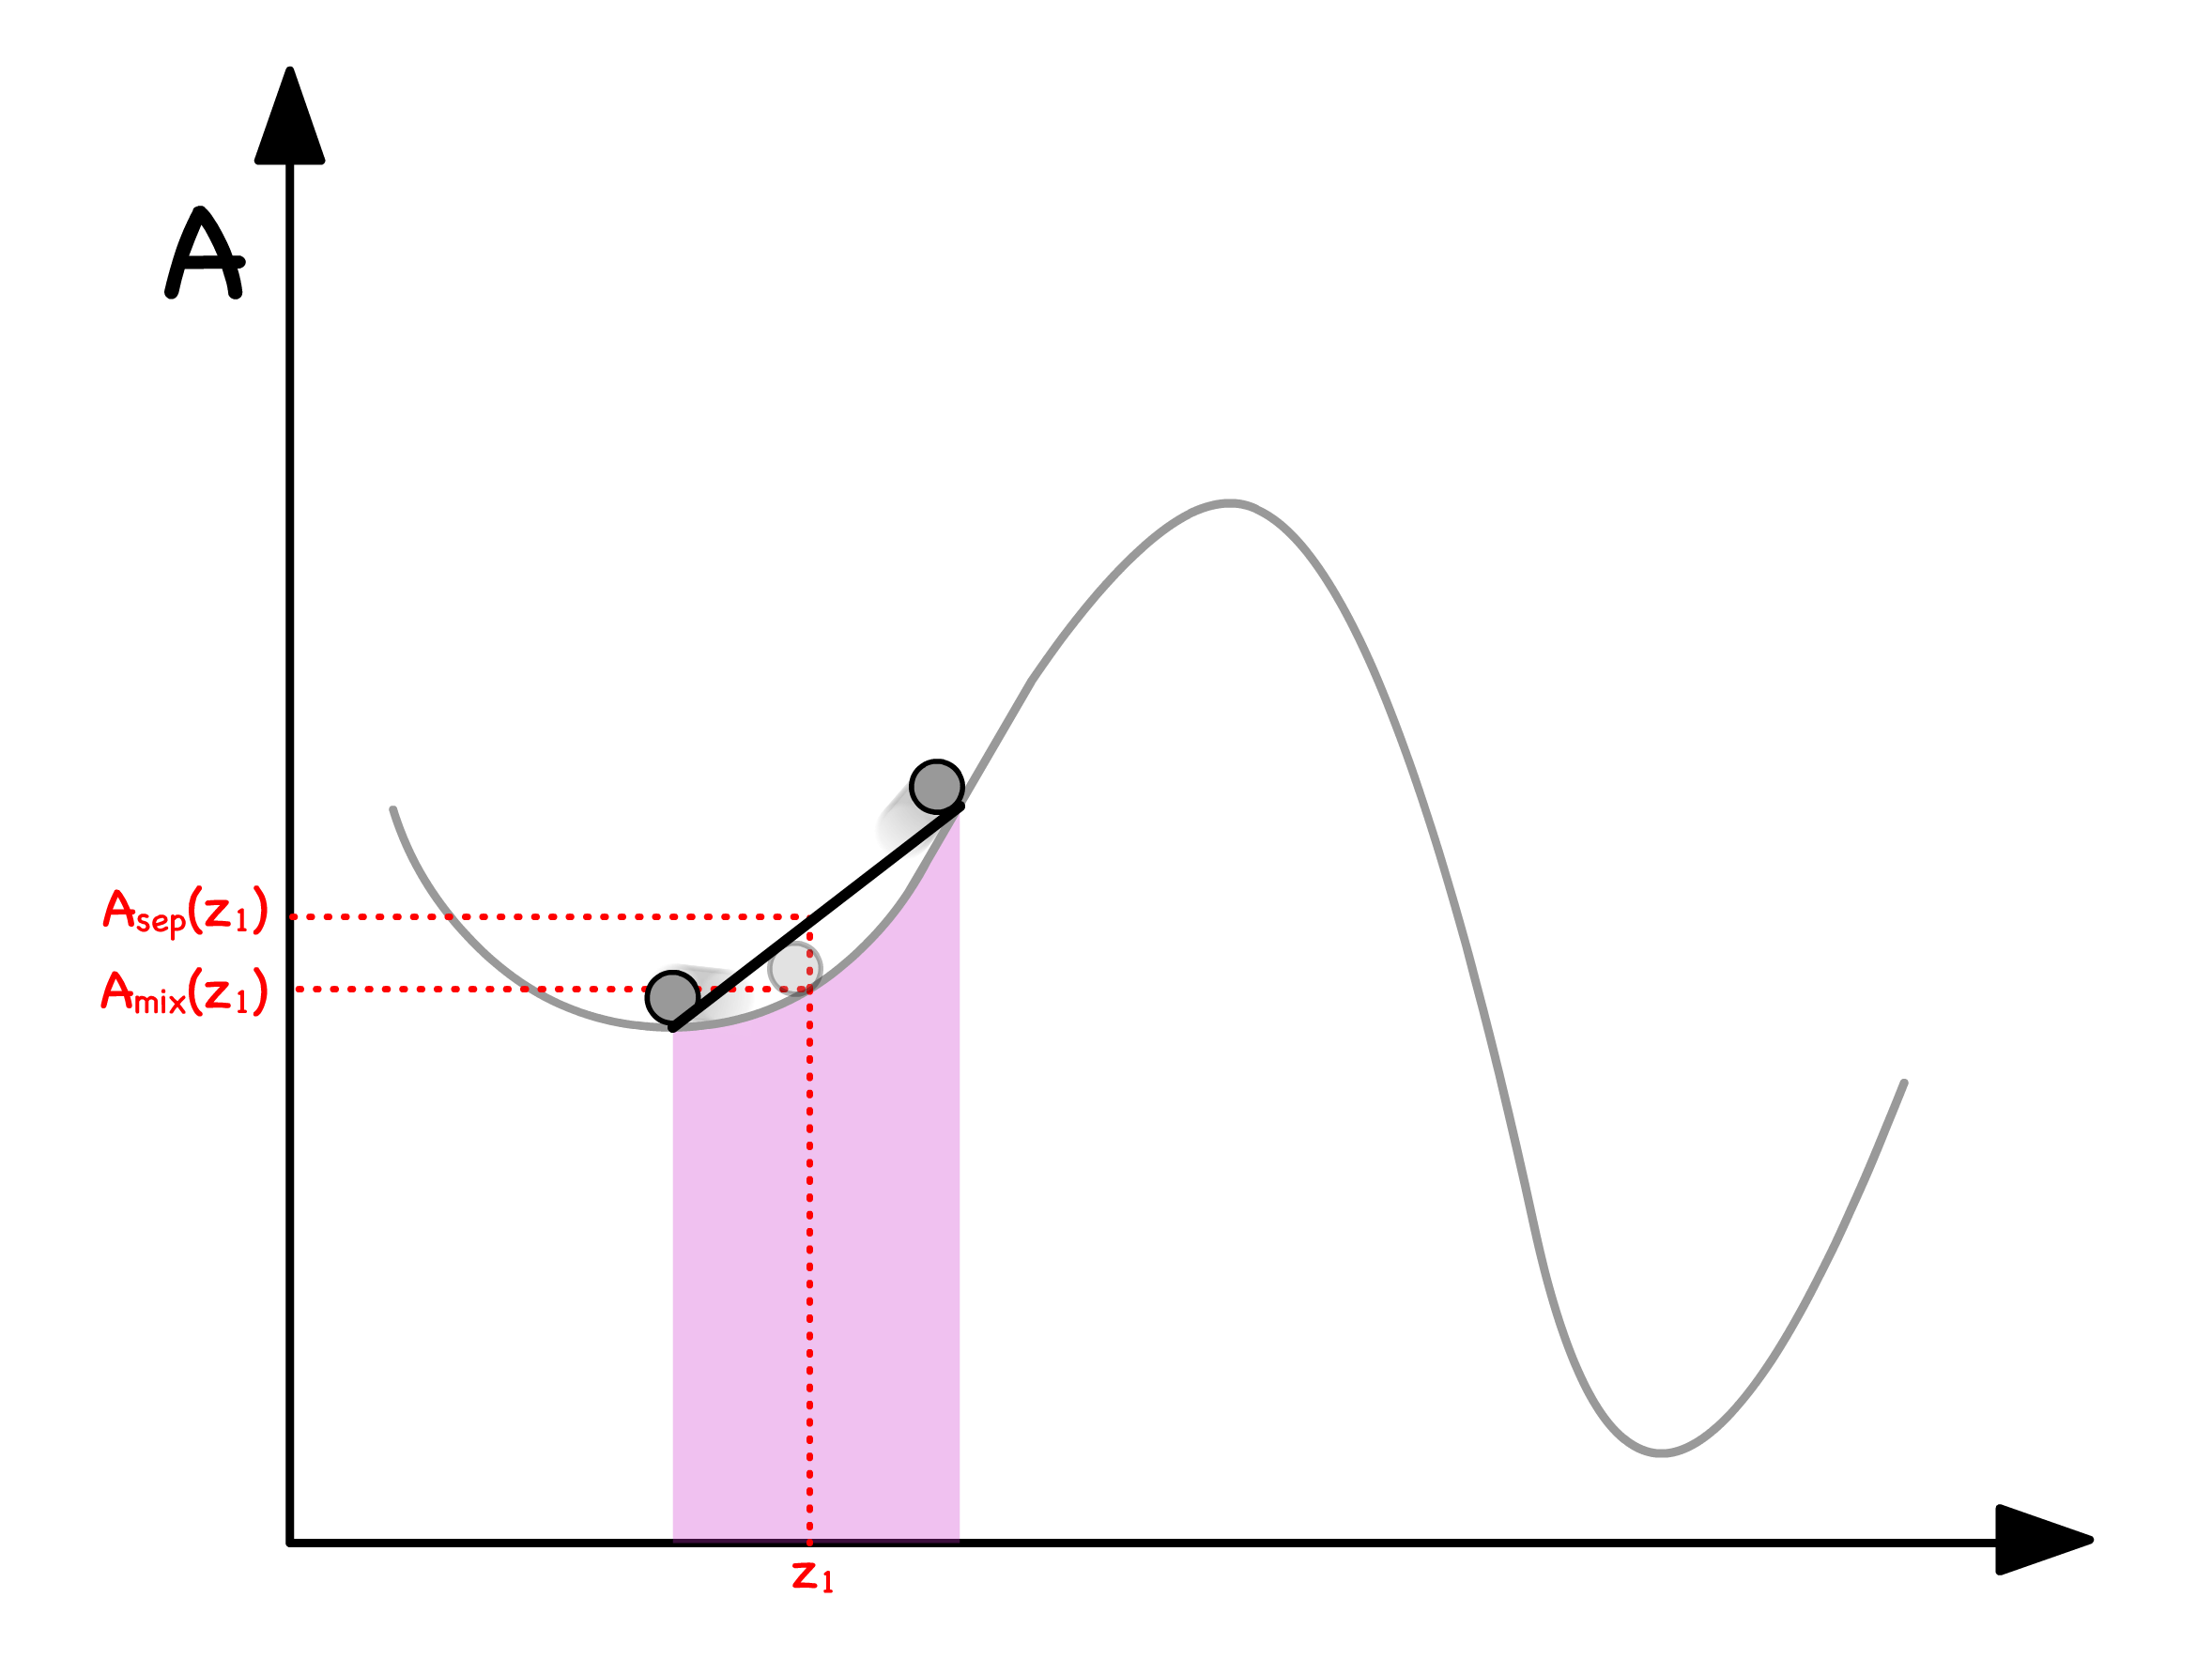
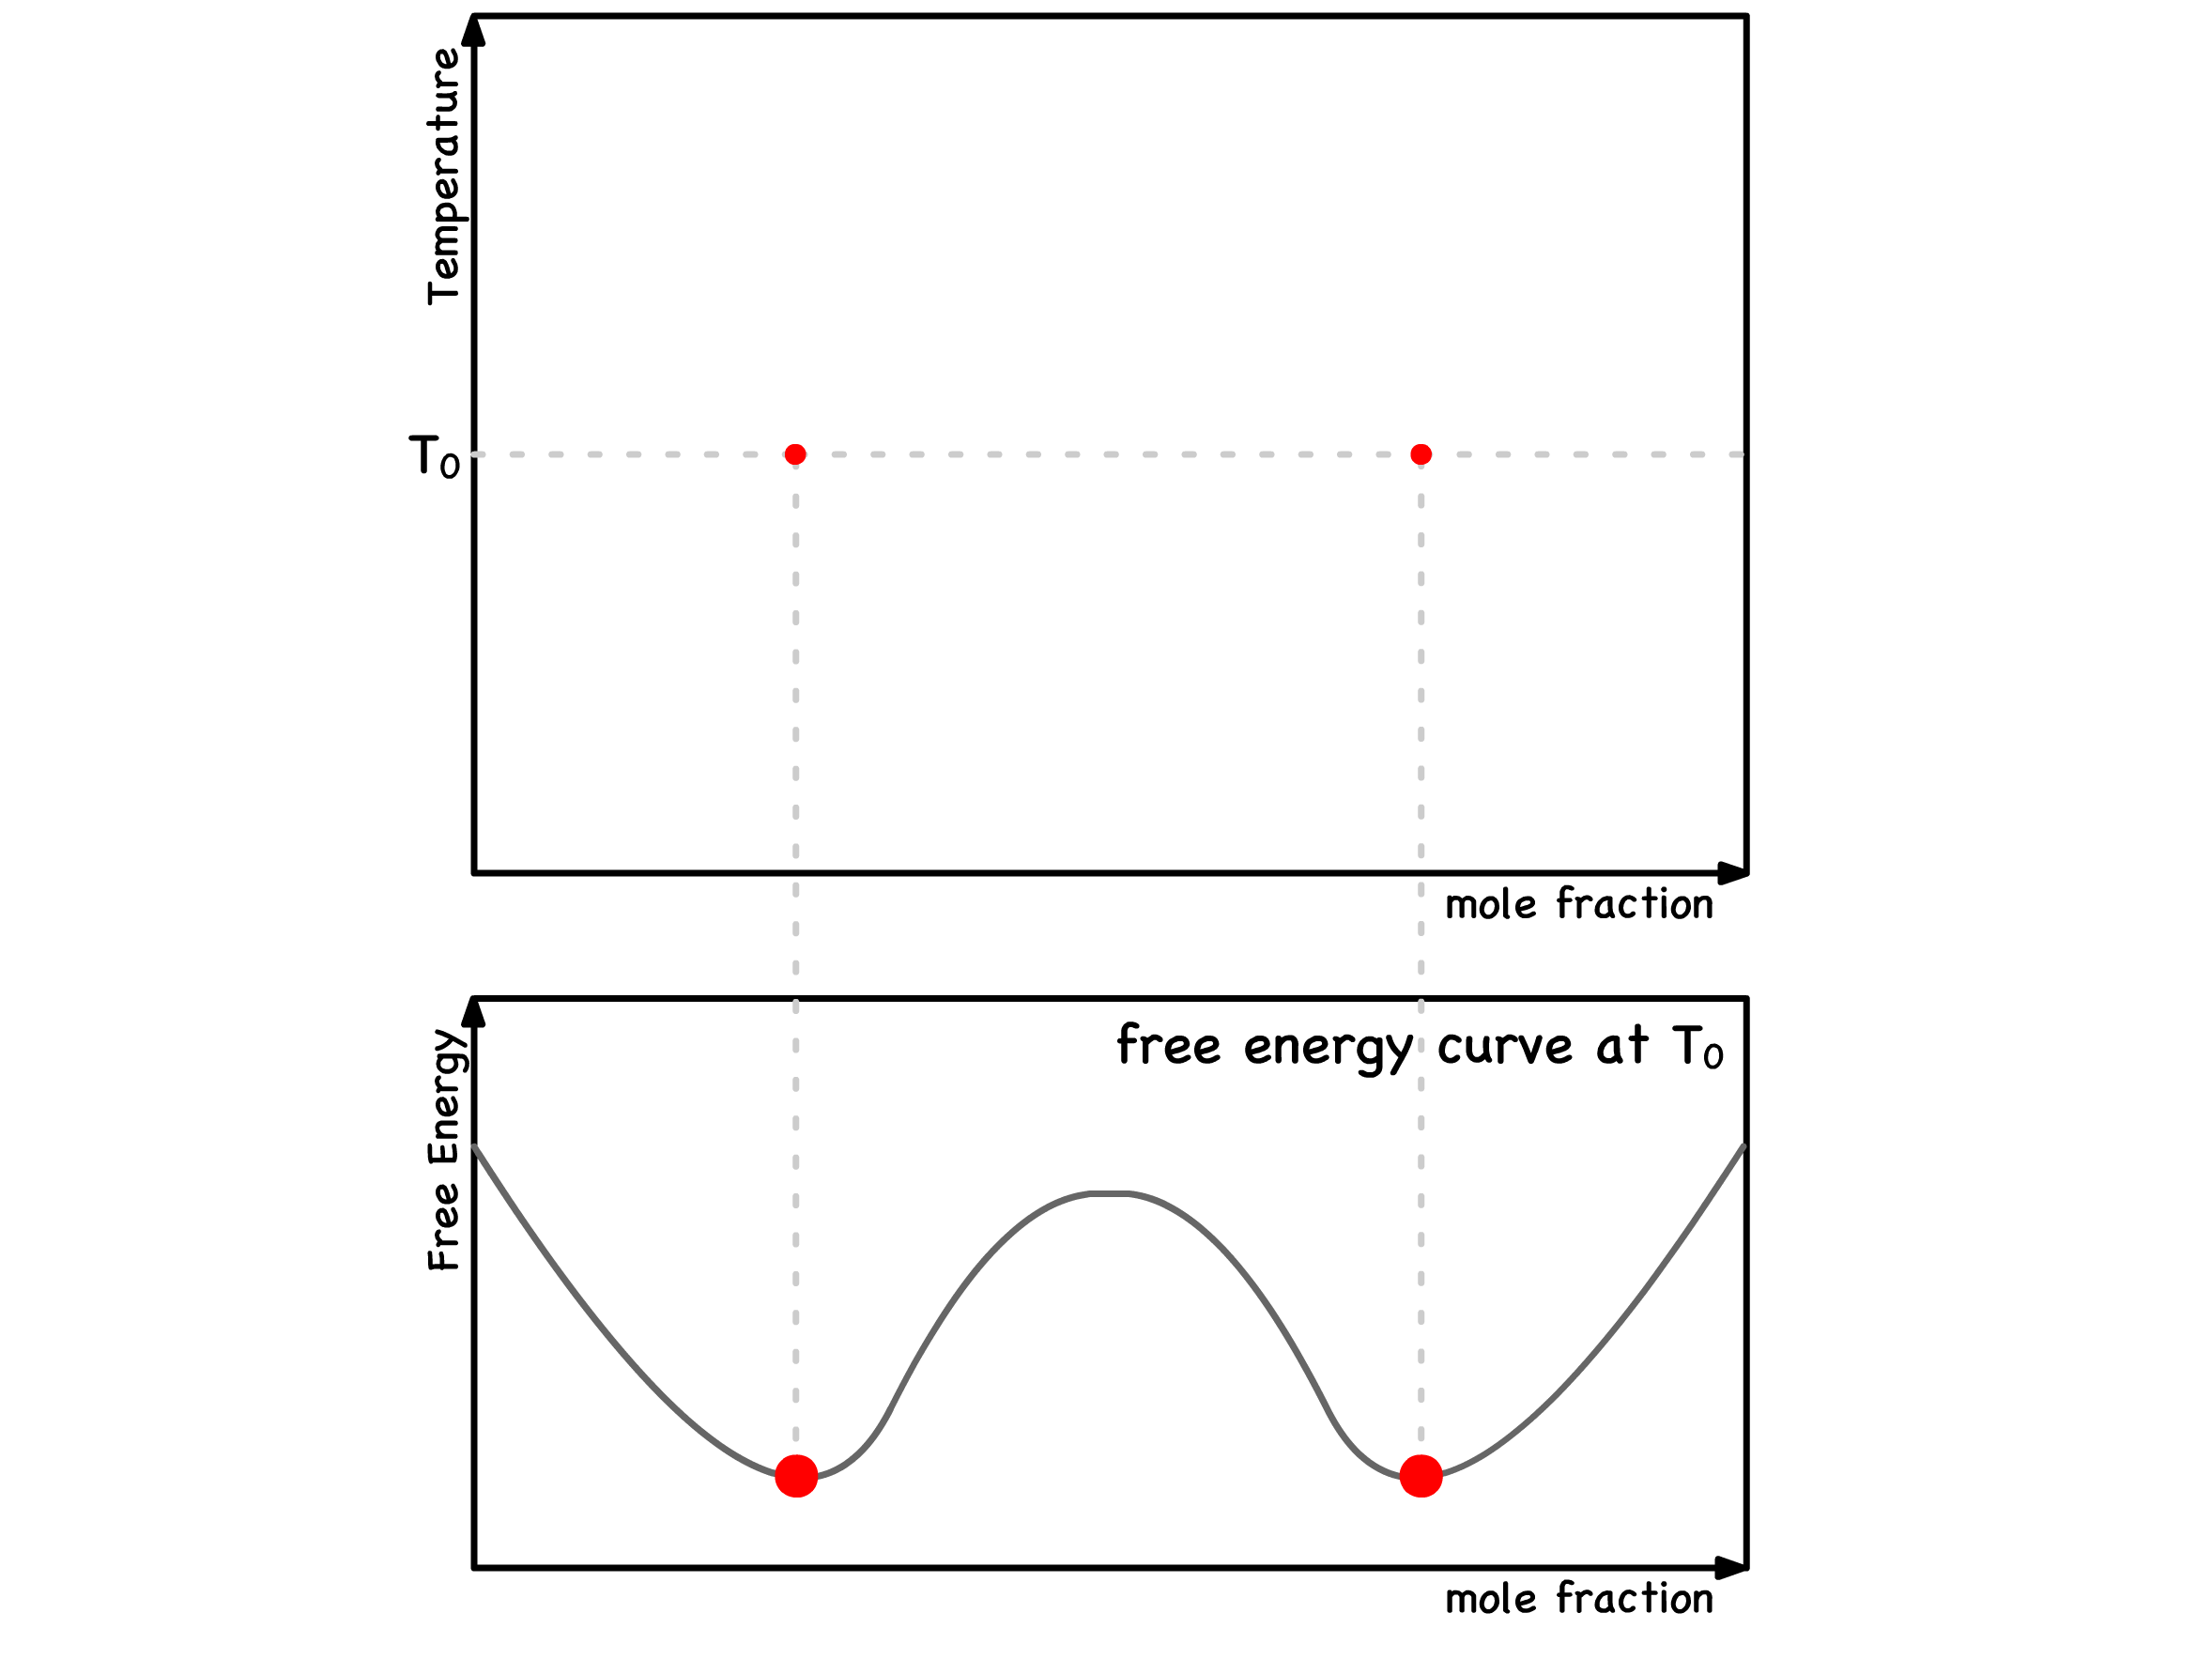
Imagine all physical and chemical systems as a pair of balls placed upon a free energy curve, with each ball symbolizing the mole fraction of a specific component in distinct phases of the system
Mixing of Phases :
- When two initially separated balls converge to the same point on the curve, it signifies the mixing of two phases
- This phenomenon can be rationalized by considering that the two phases now possess identical compositions, effectively blending into one another
Phase Separation :
- Conversely, when two initially overlapping balls move apart from each other, it indicates the separation of a single phase into two
- This can be conceptualized as the divergence of two regions within the system, each with a distinct composition
Since all systems have the tendency to lower their free energies, we can predict the direction of spontaneity base on the curvature of the position the system is at
Note that the pair of balls must always roll in opposite directions because their movement represents the changes in the composition of the system
- When one ball moves in a particular direction, indicating an increase in the mole fraction of a component in one phase, the other ball moves in the opposite direction, signifying a decrease in the mole fraction of the same component in the other phase
- This reciprocal motion serves as a clear illustration of the material balance principle that guides the redistribution of components within the system
¶ Binodal and Spinodal Points
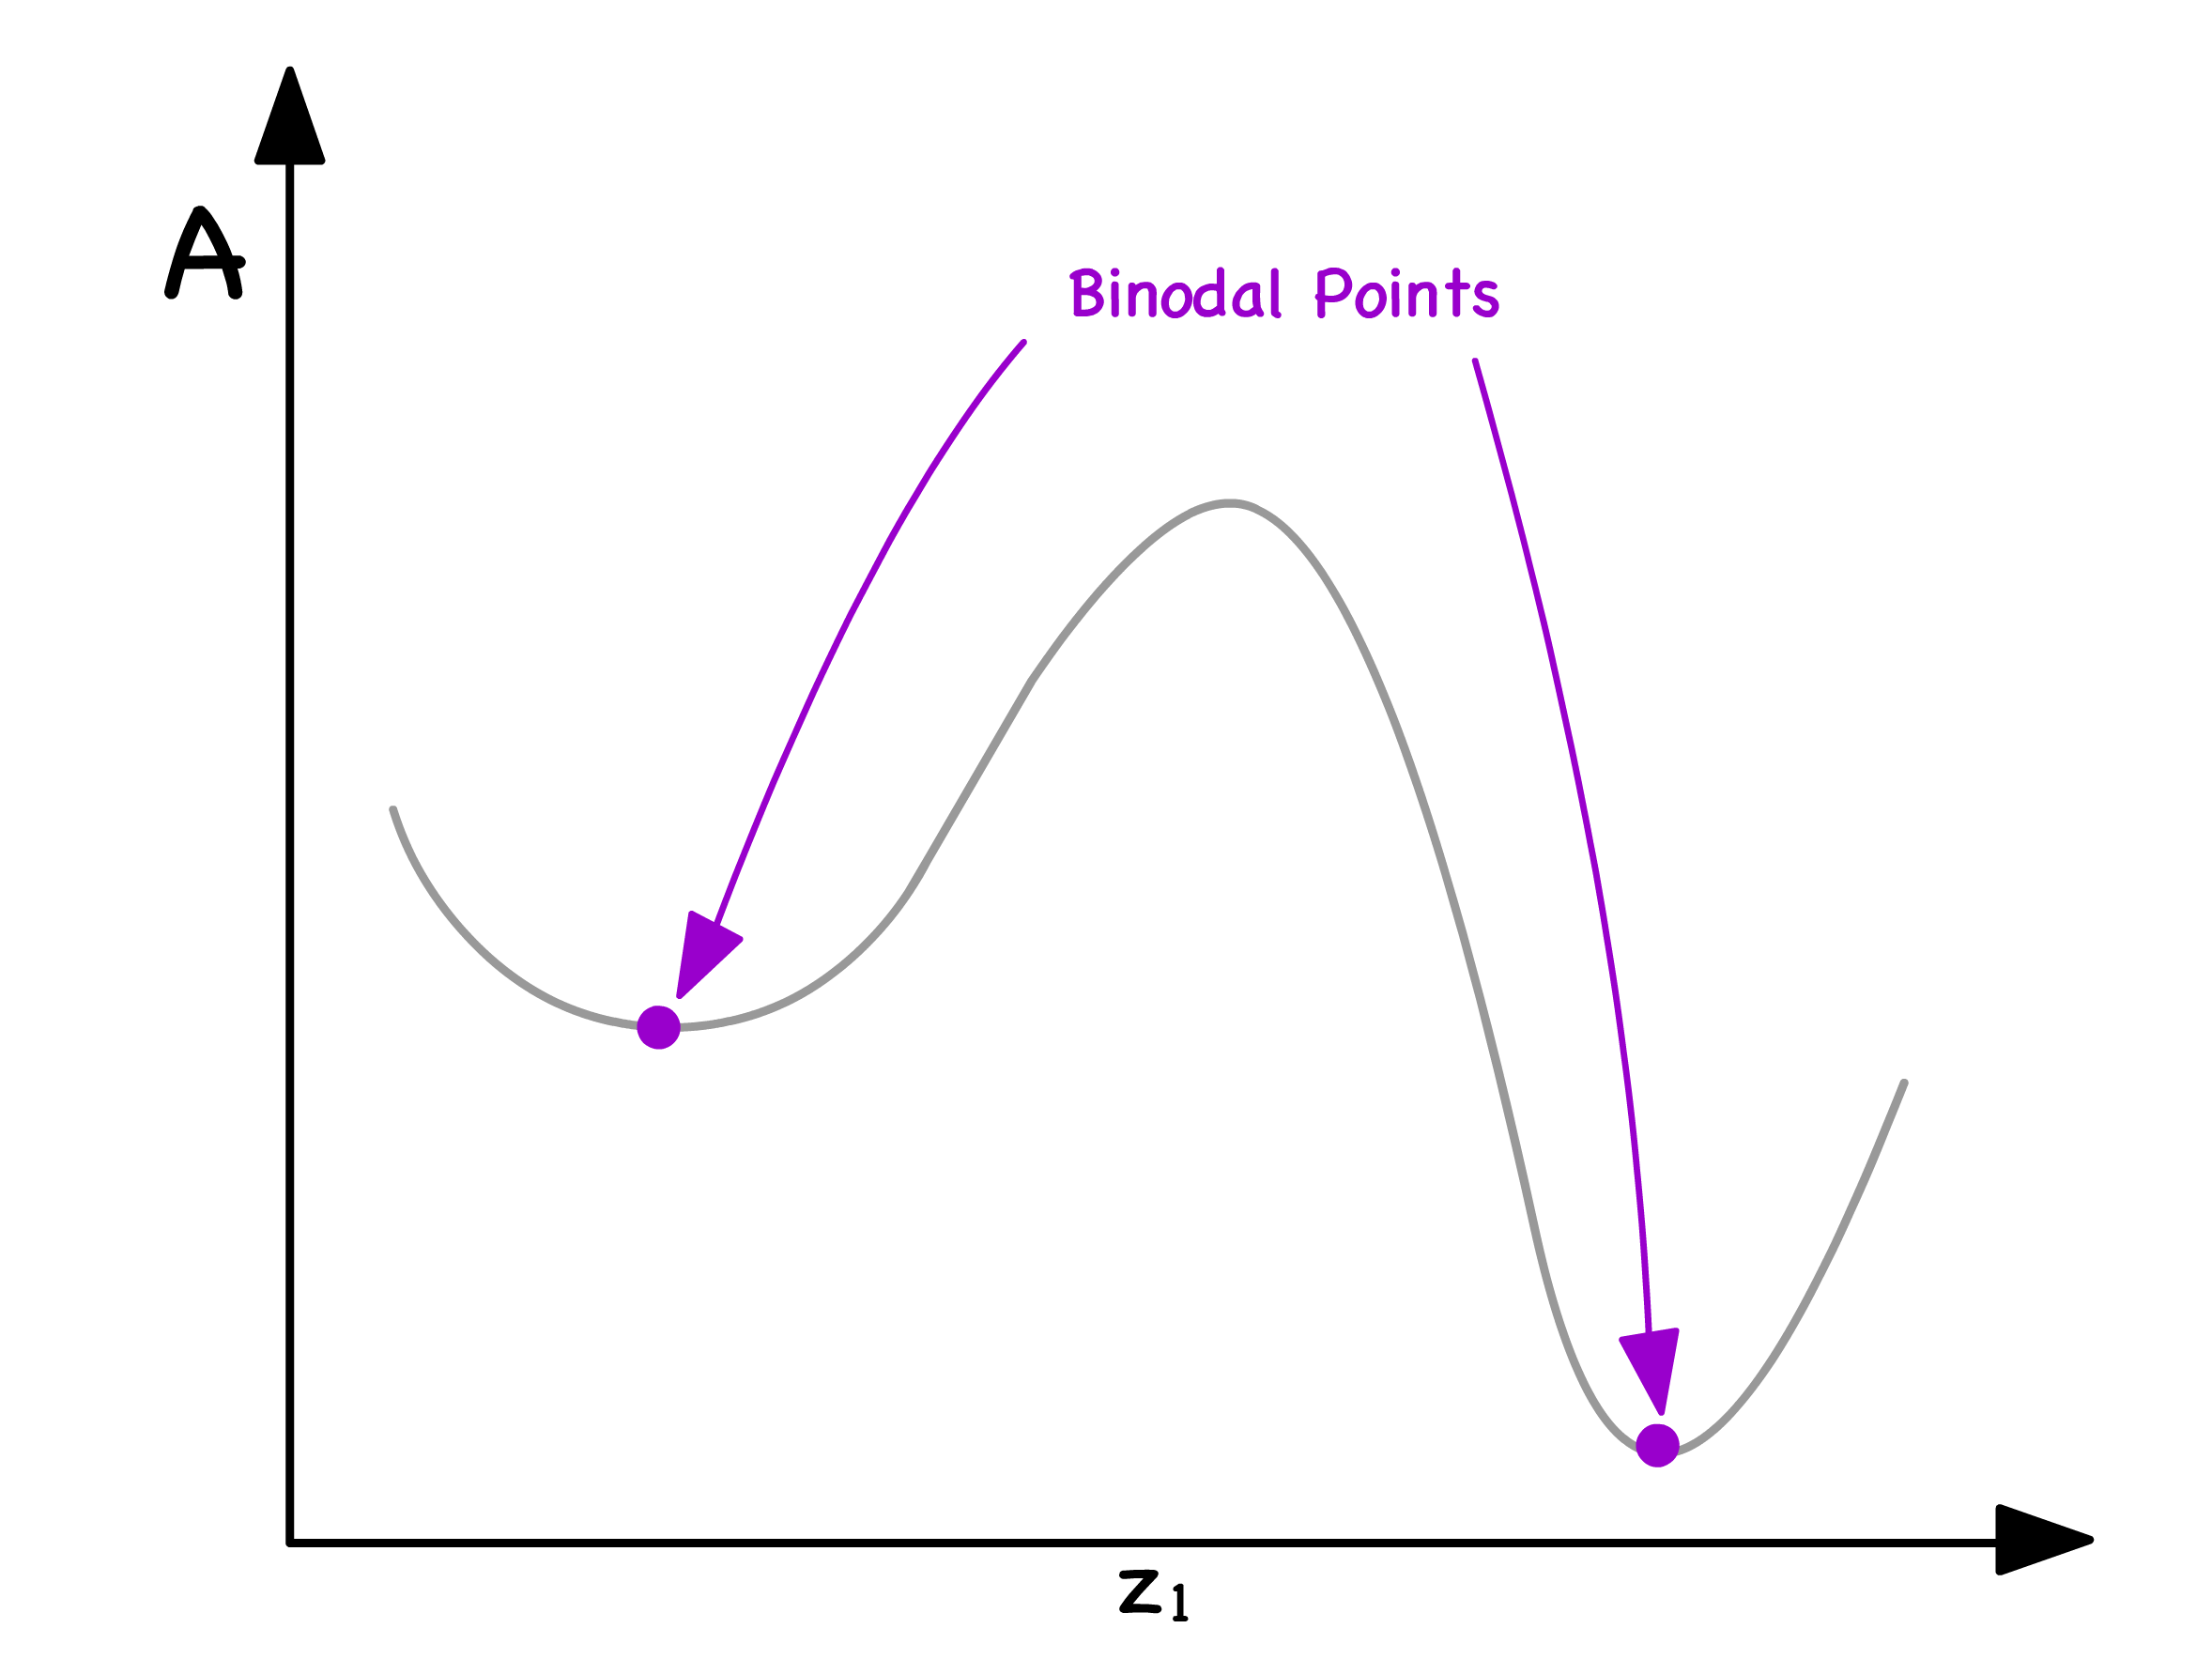
Global Stability and Binodal Points
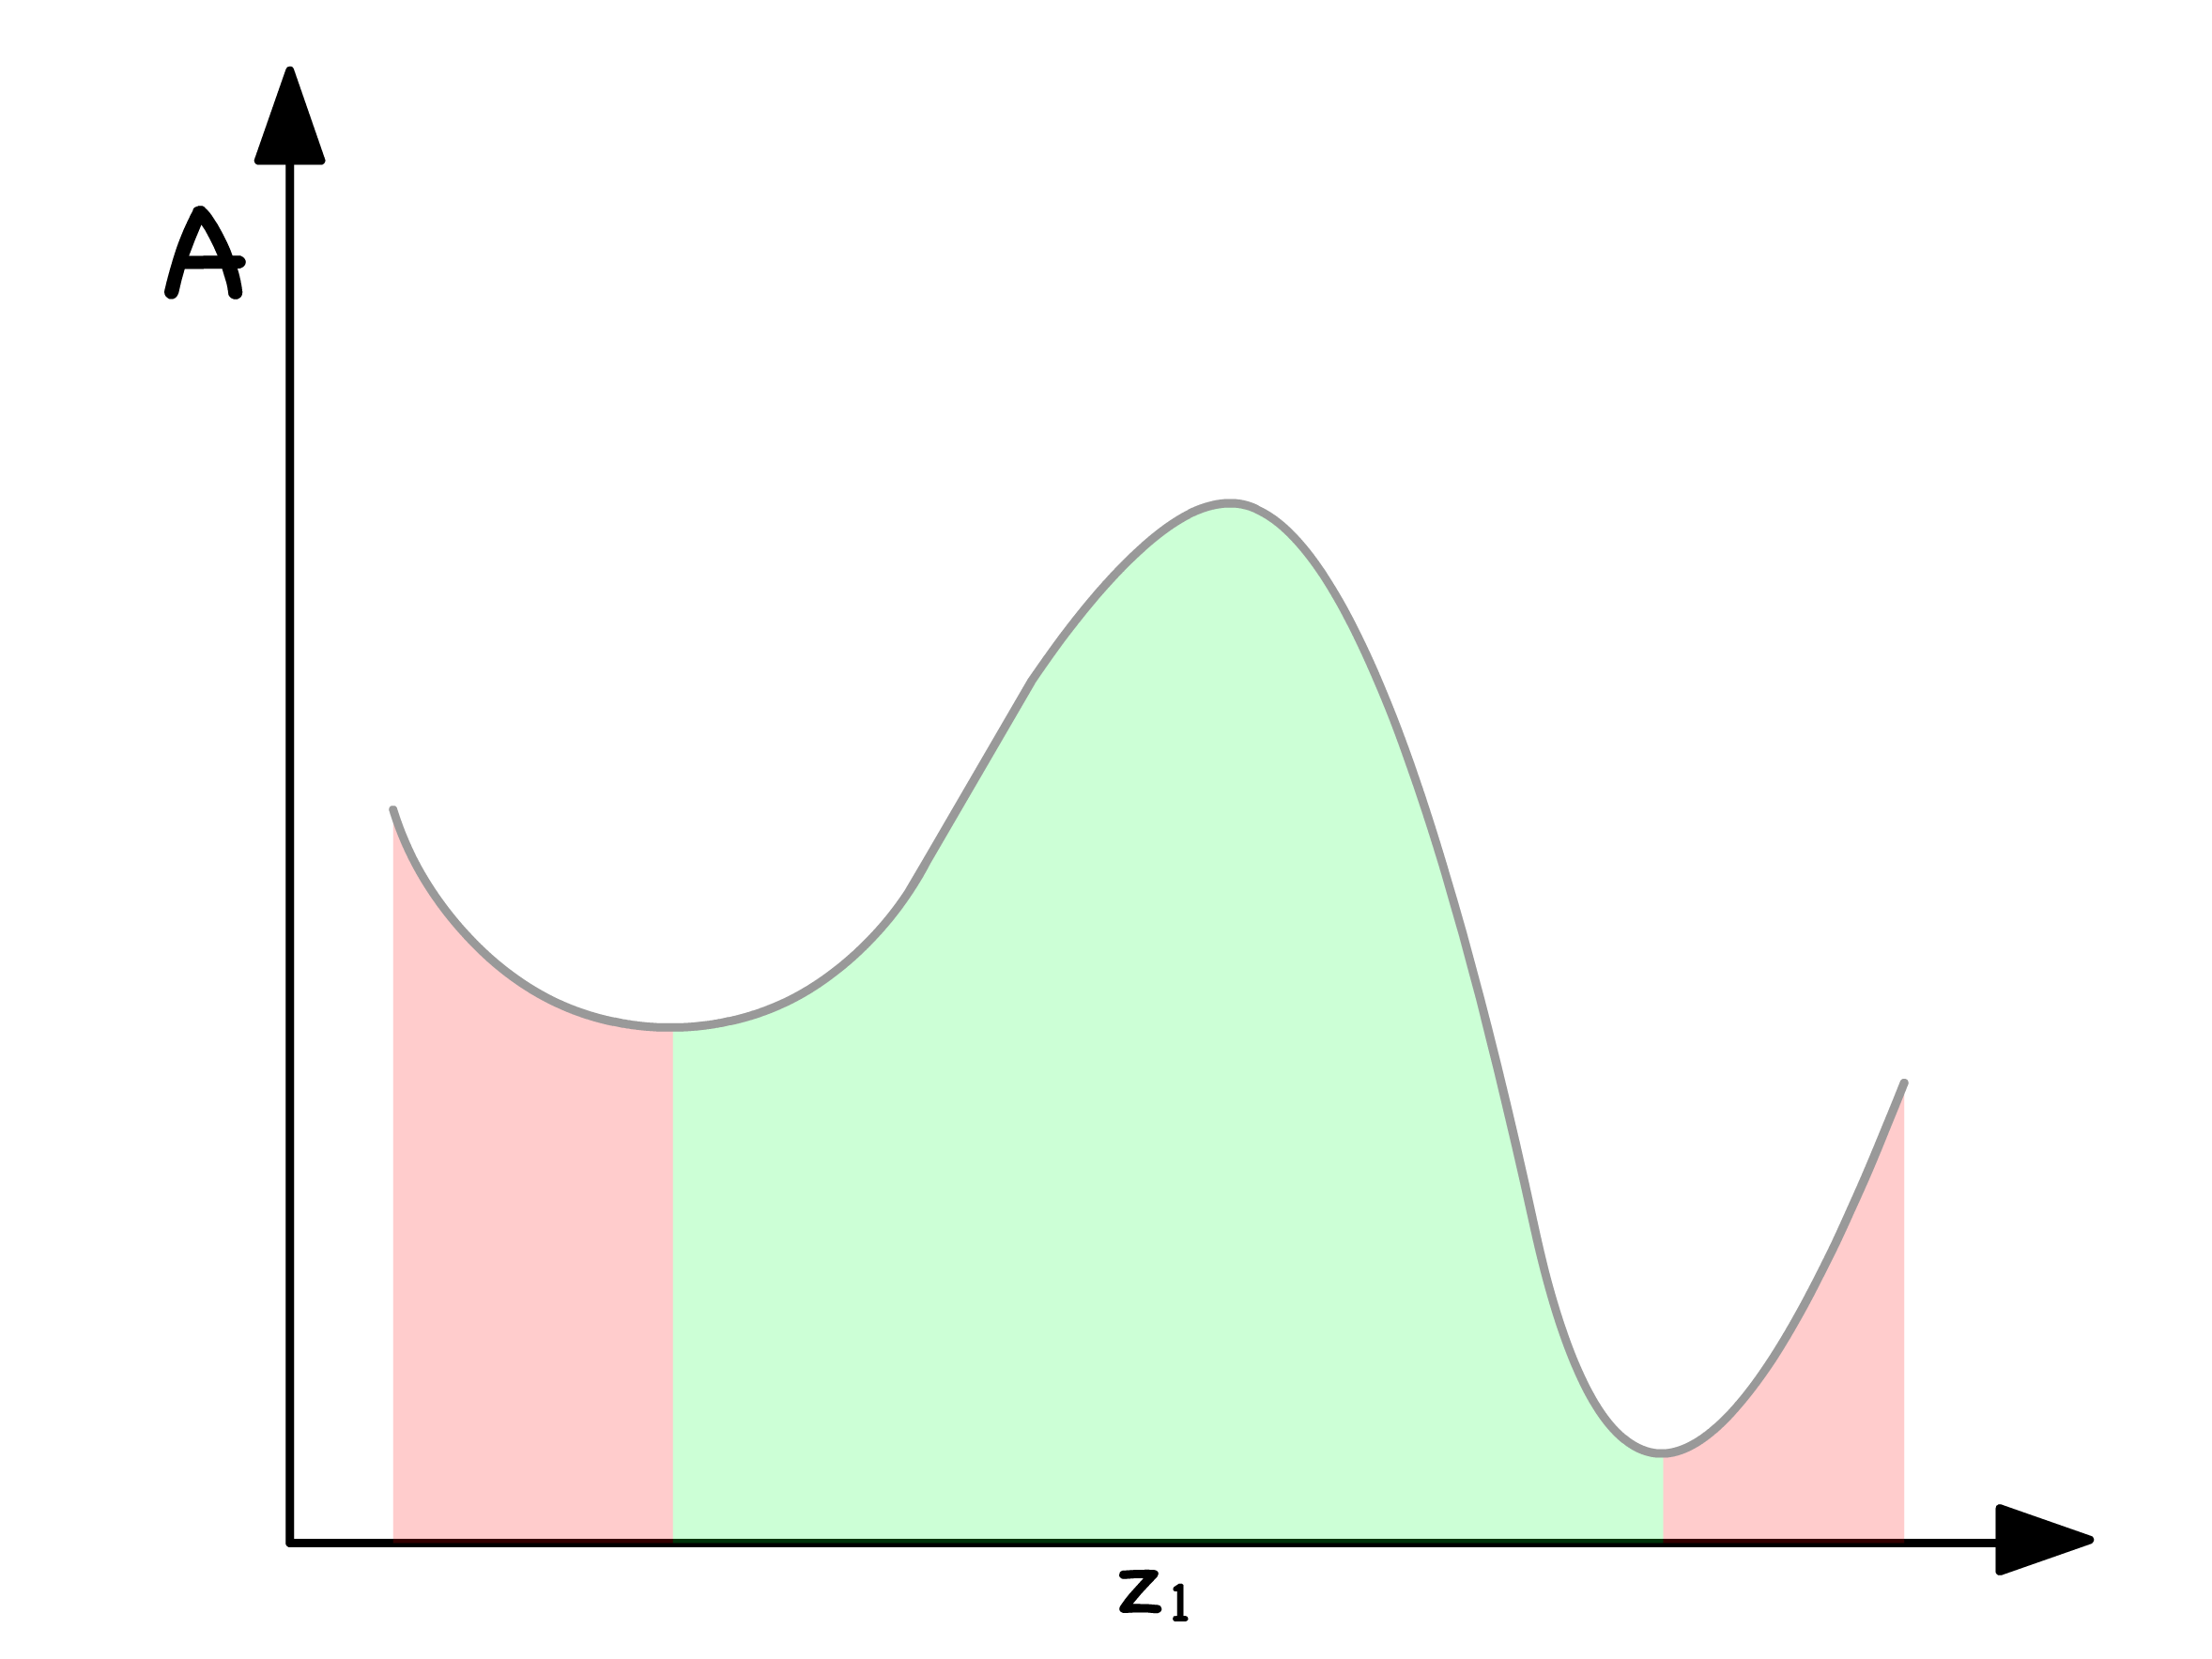
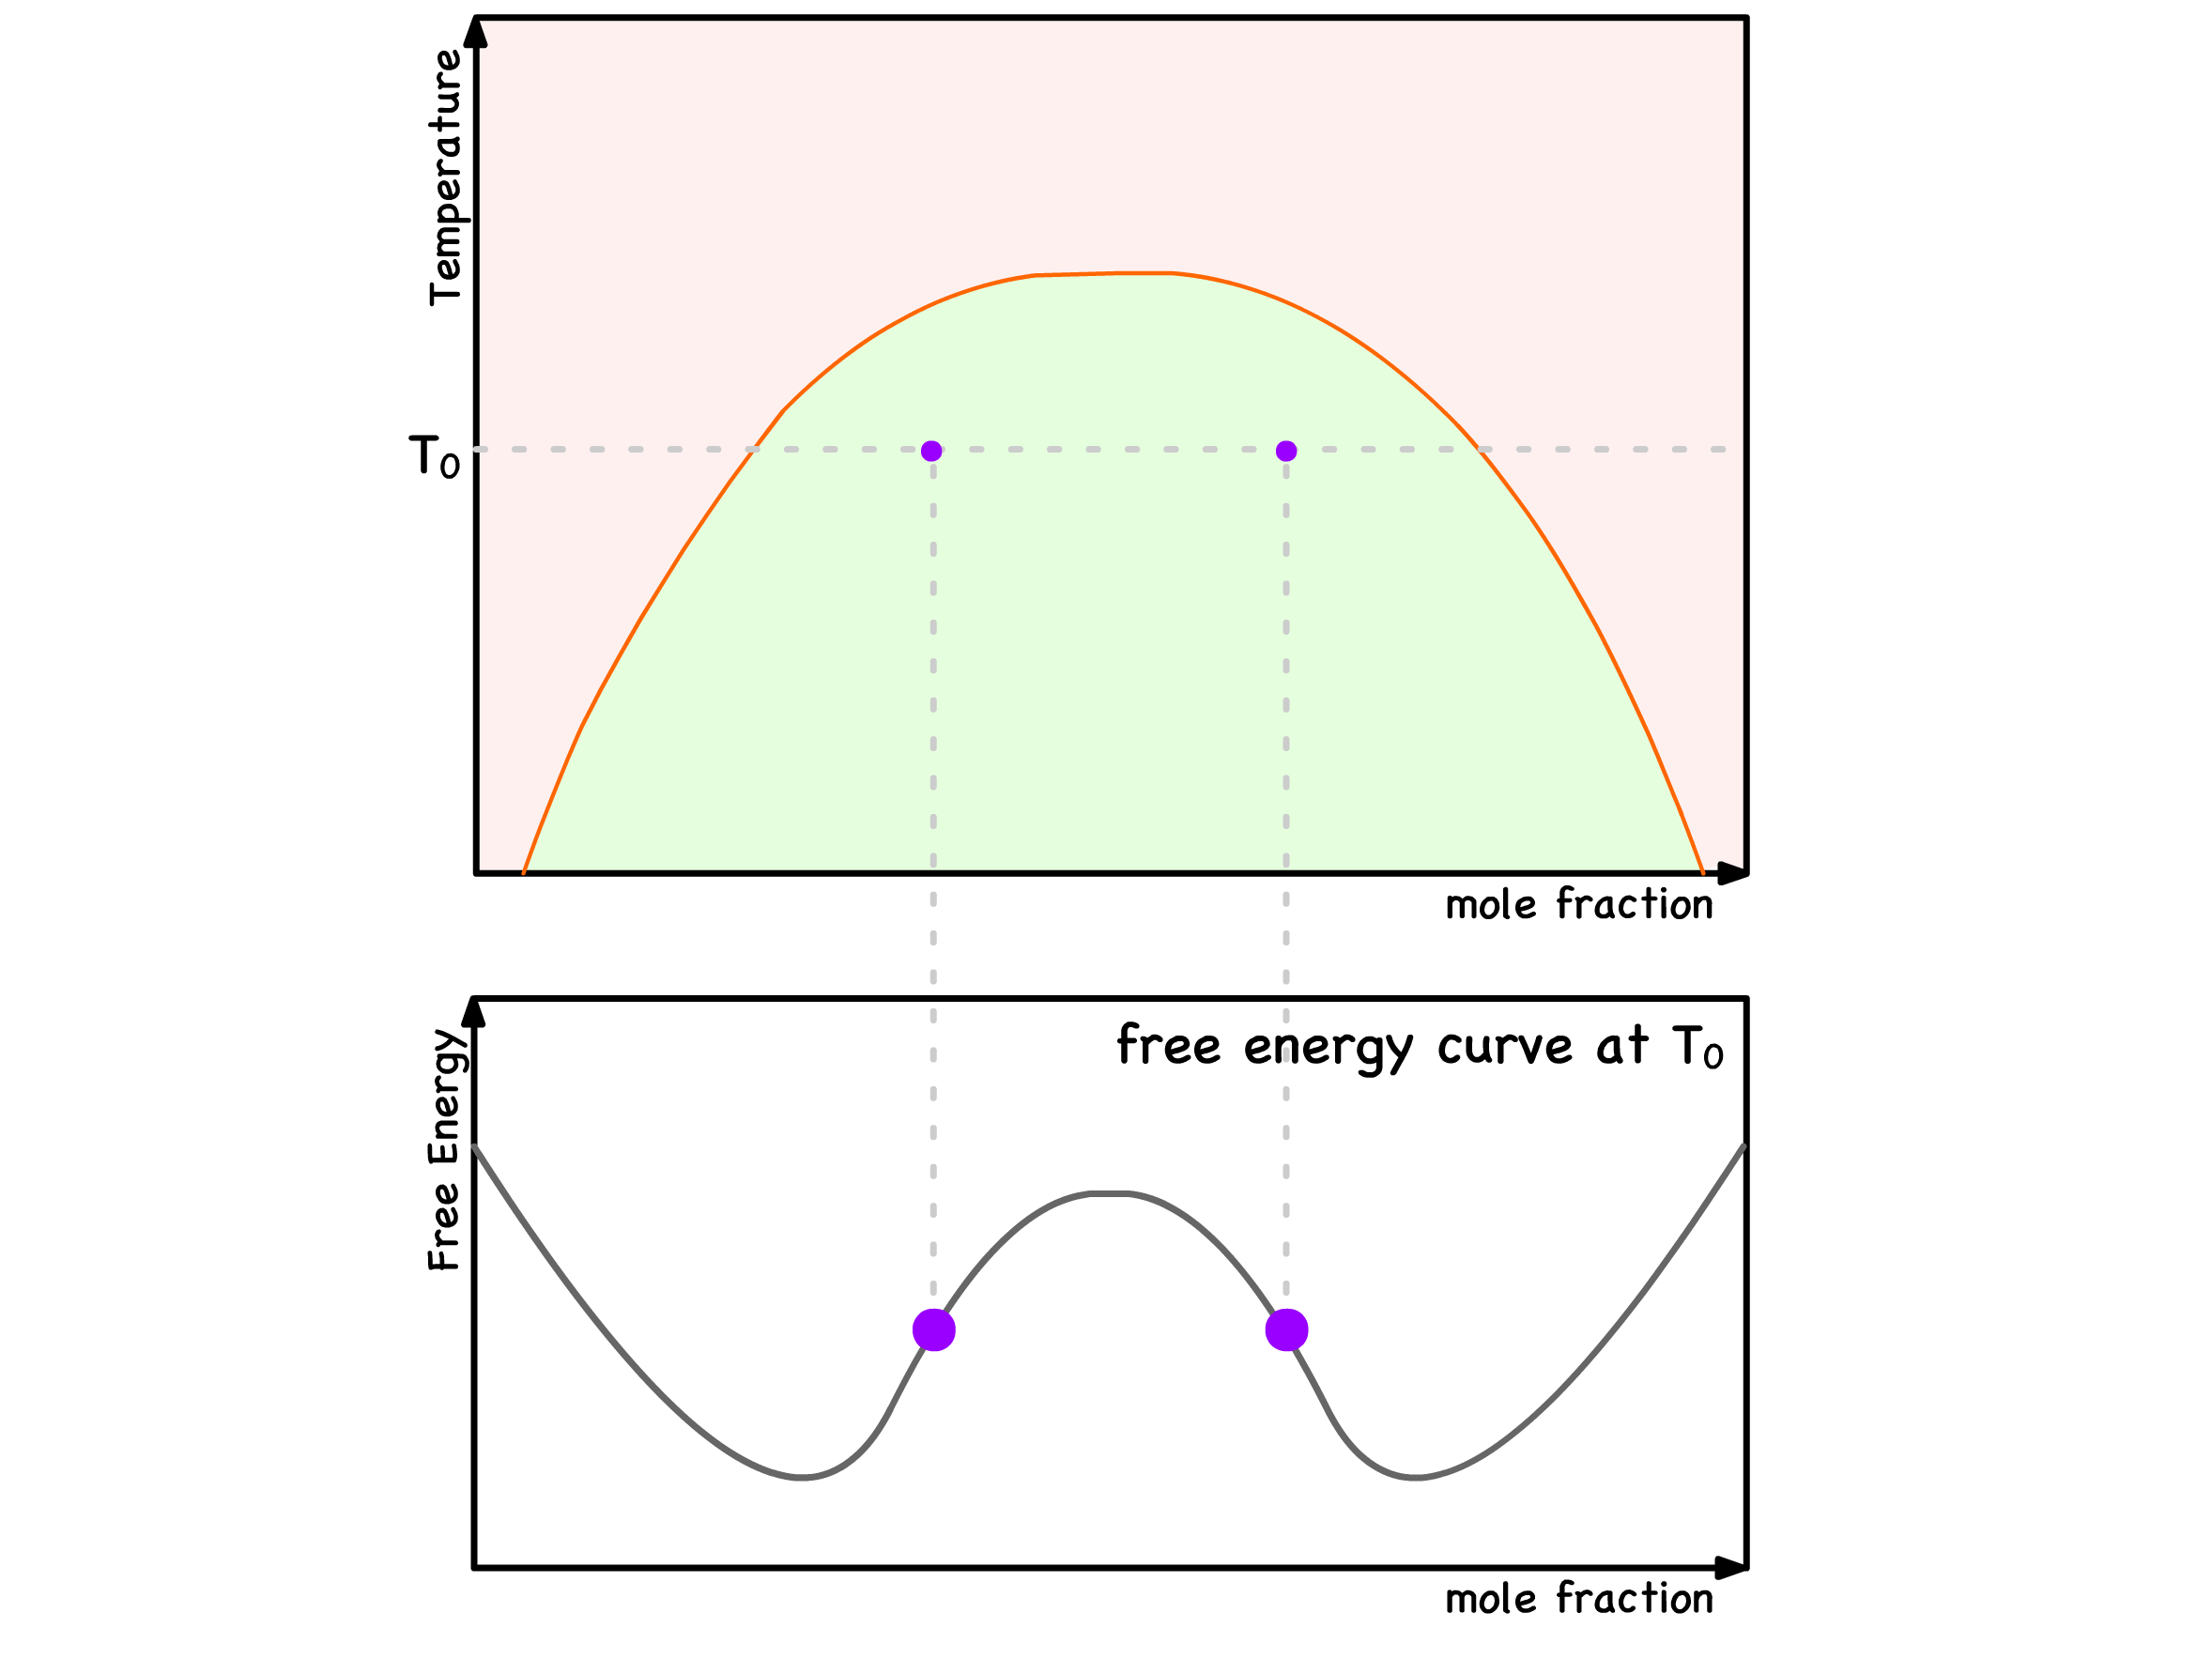
Let's delve into the quest for the most thermodynamically stable state by varying the total mole fraction of component 1,
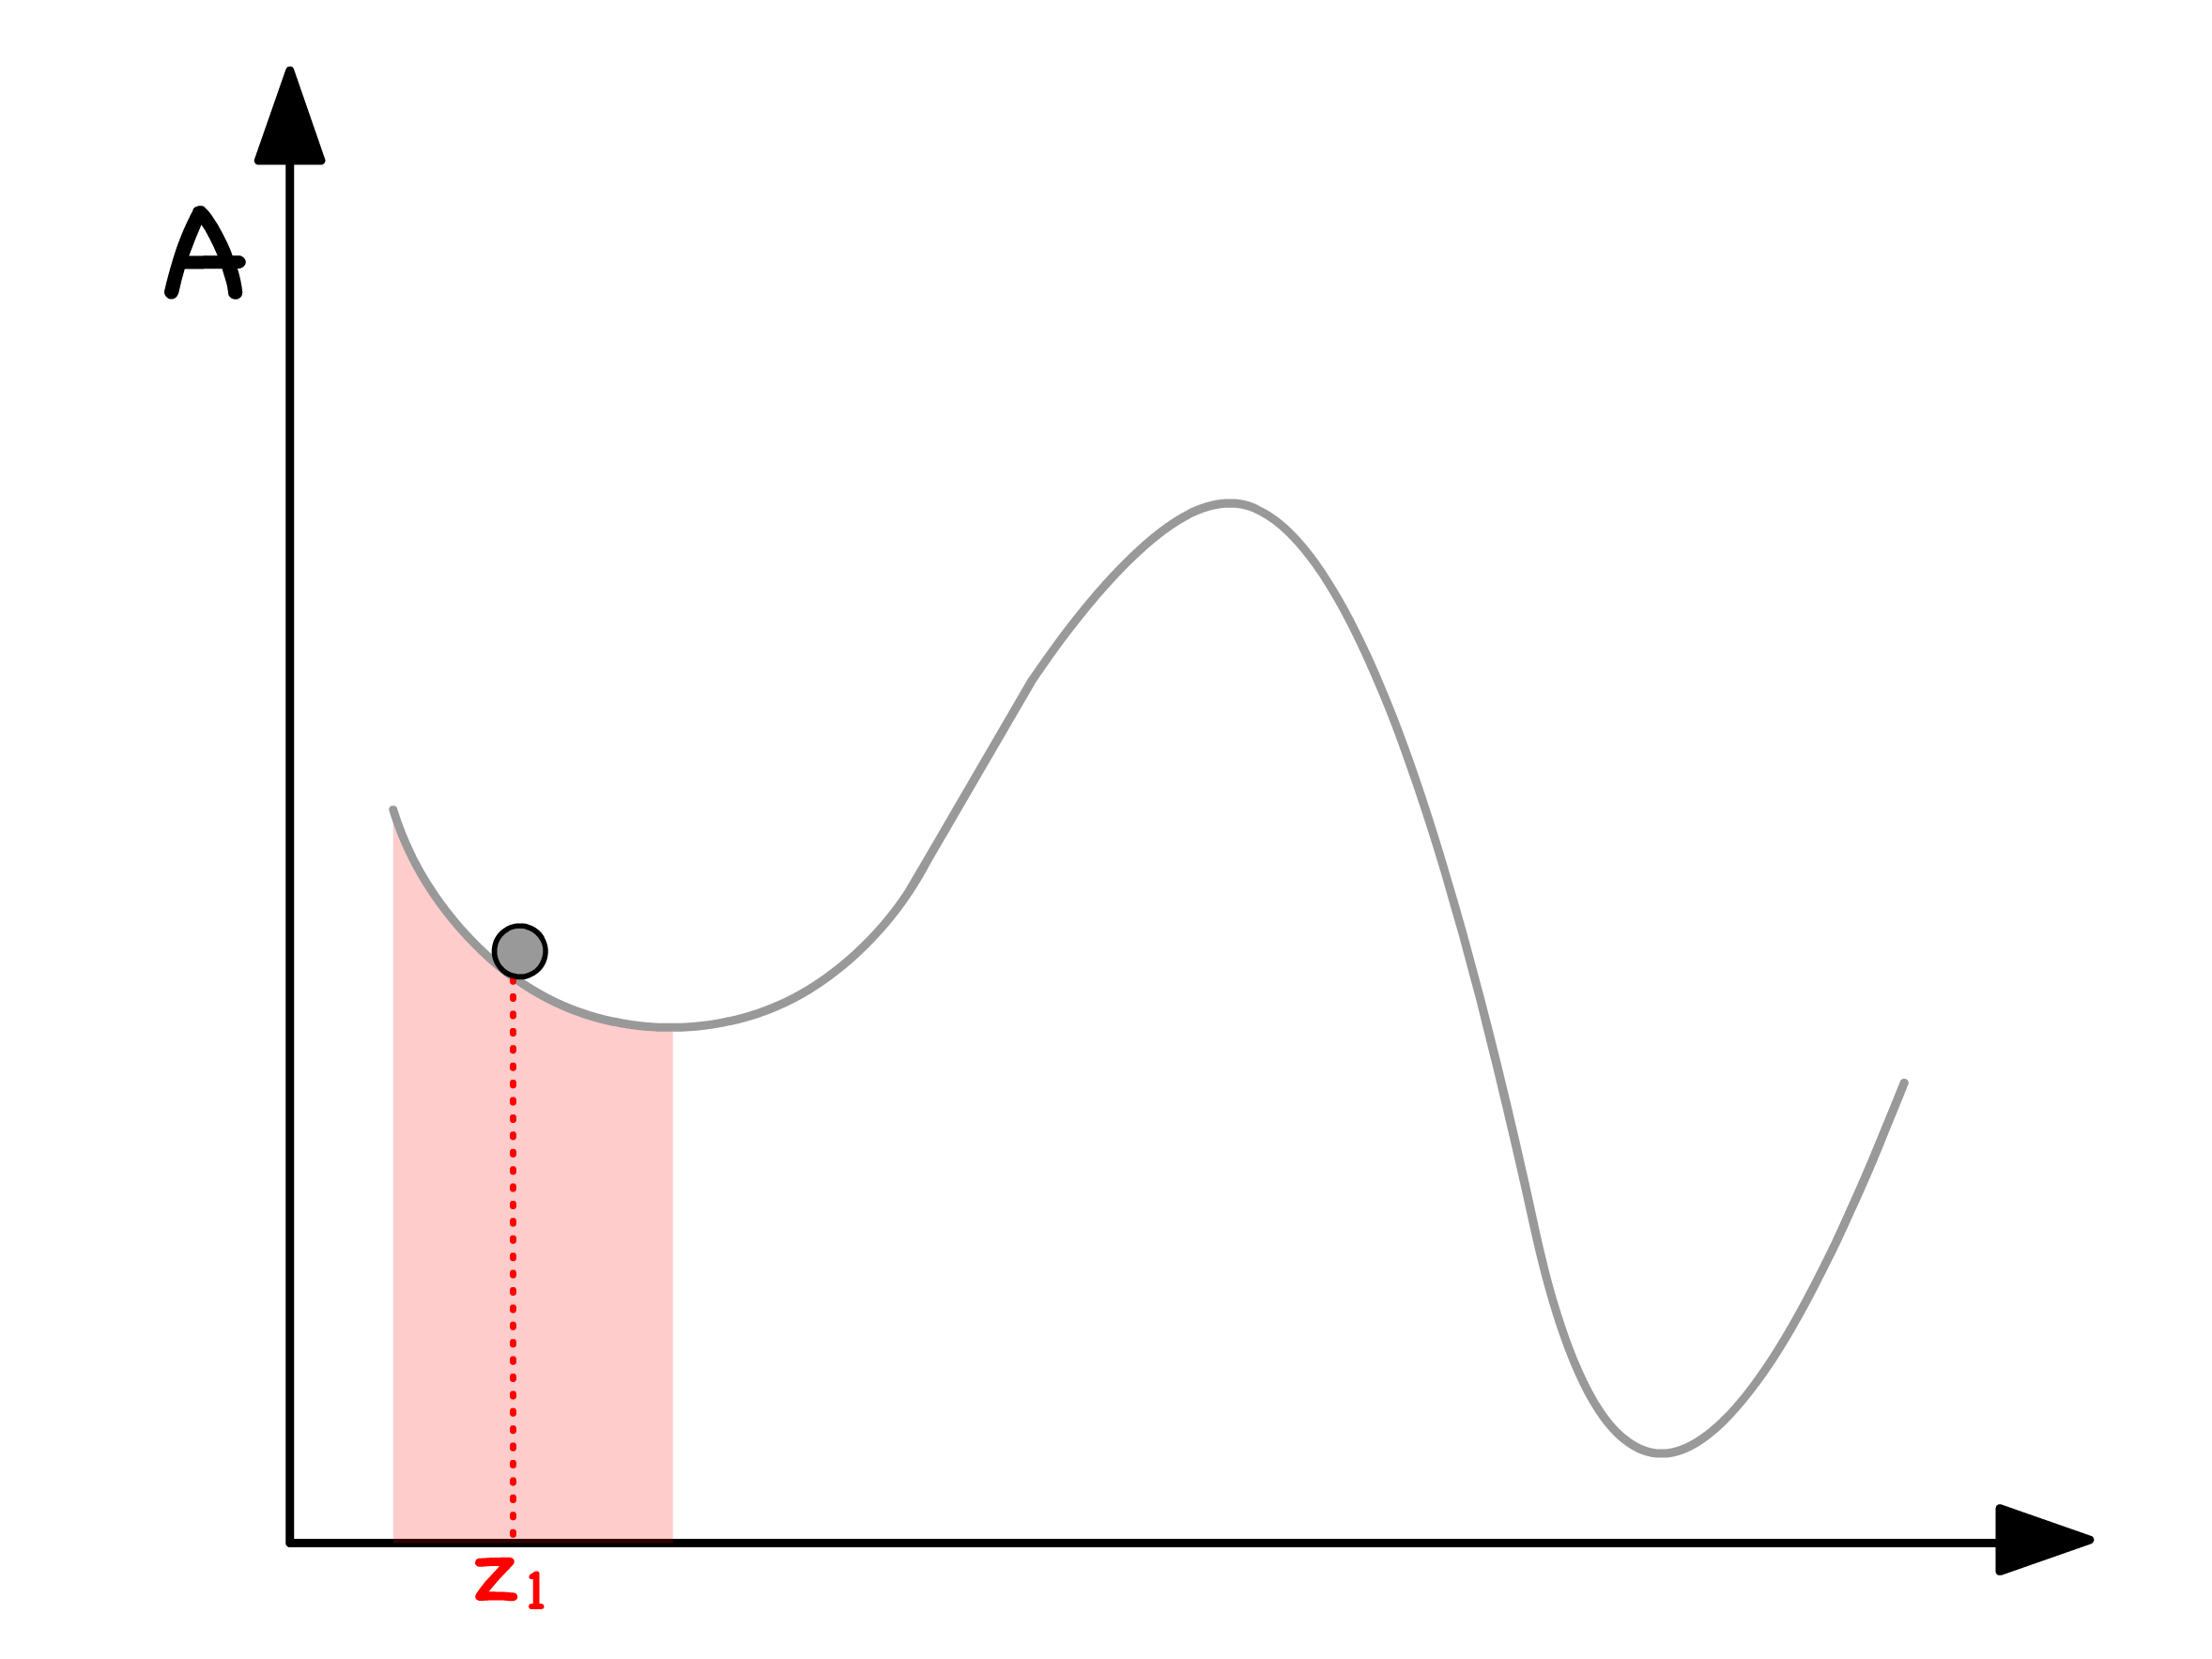
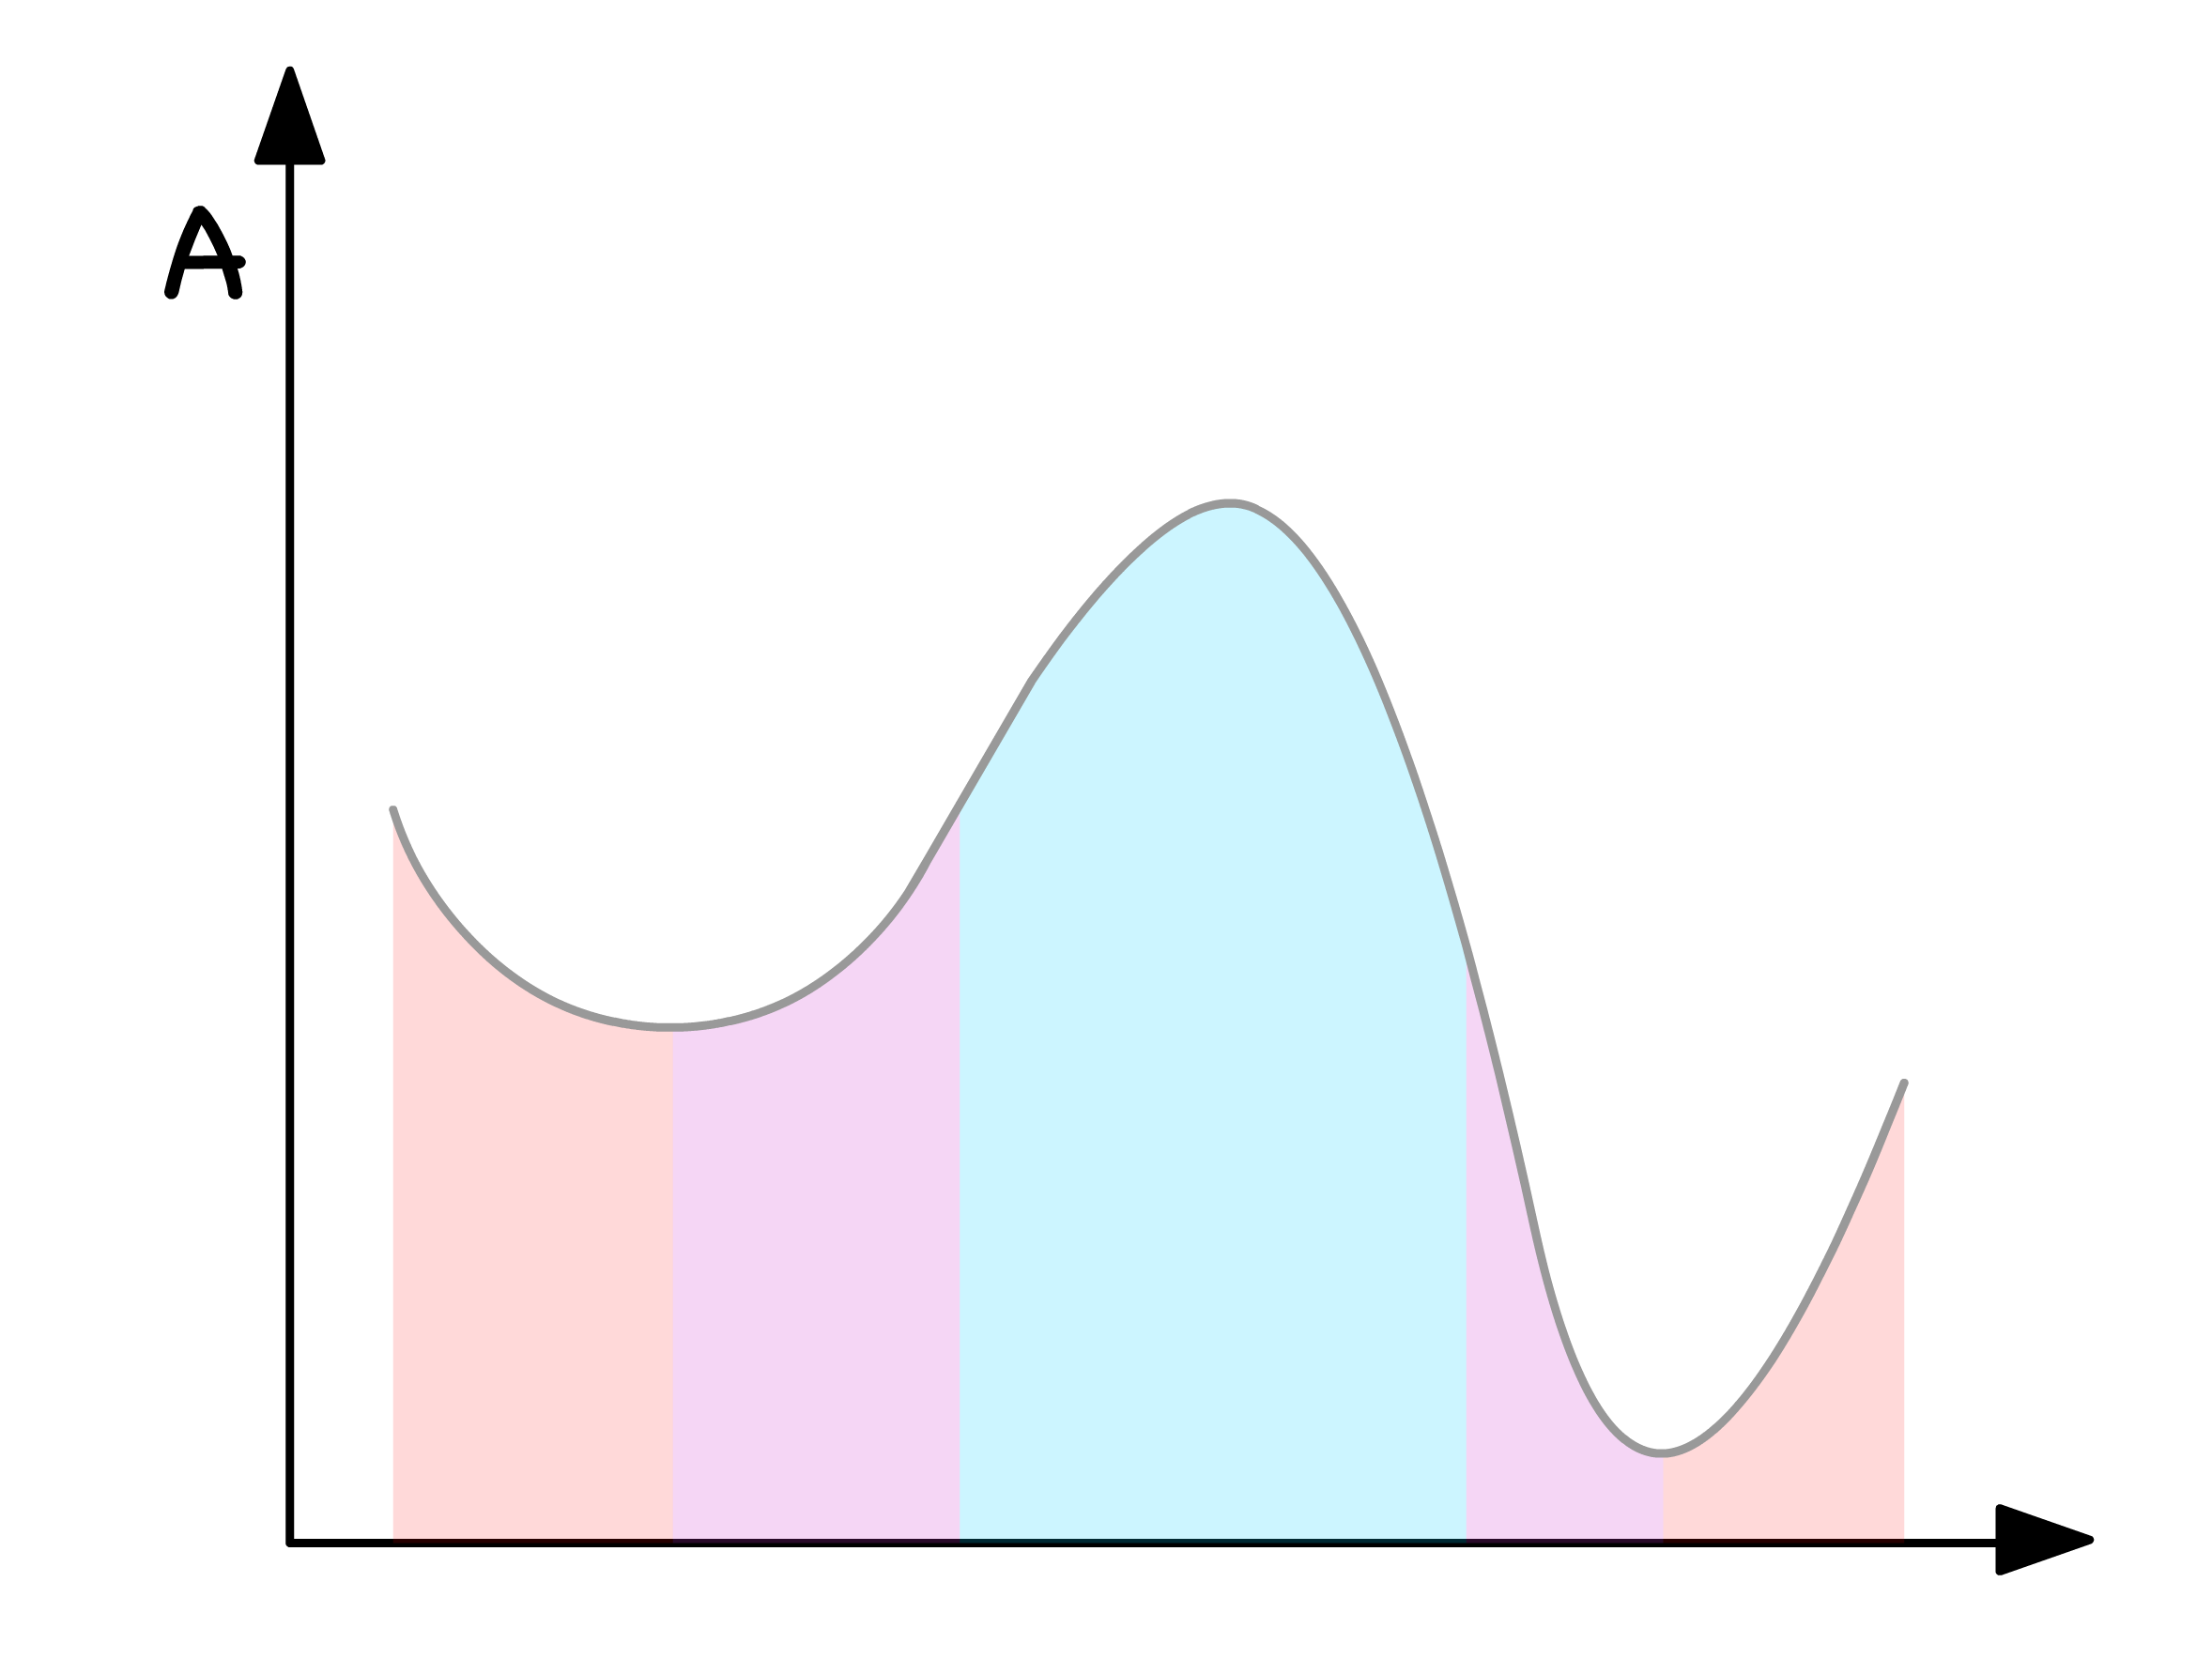
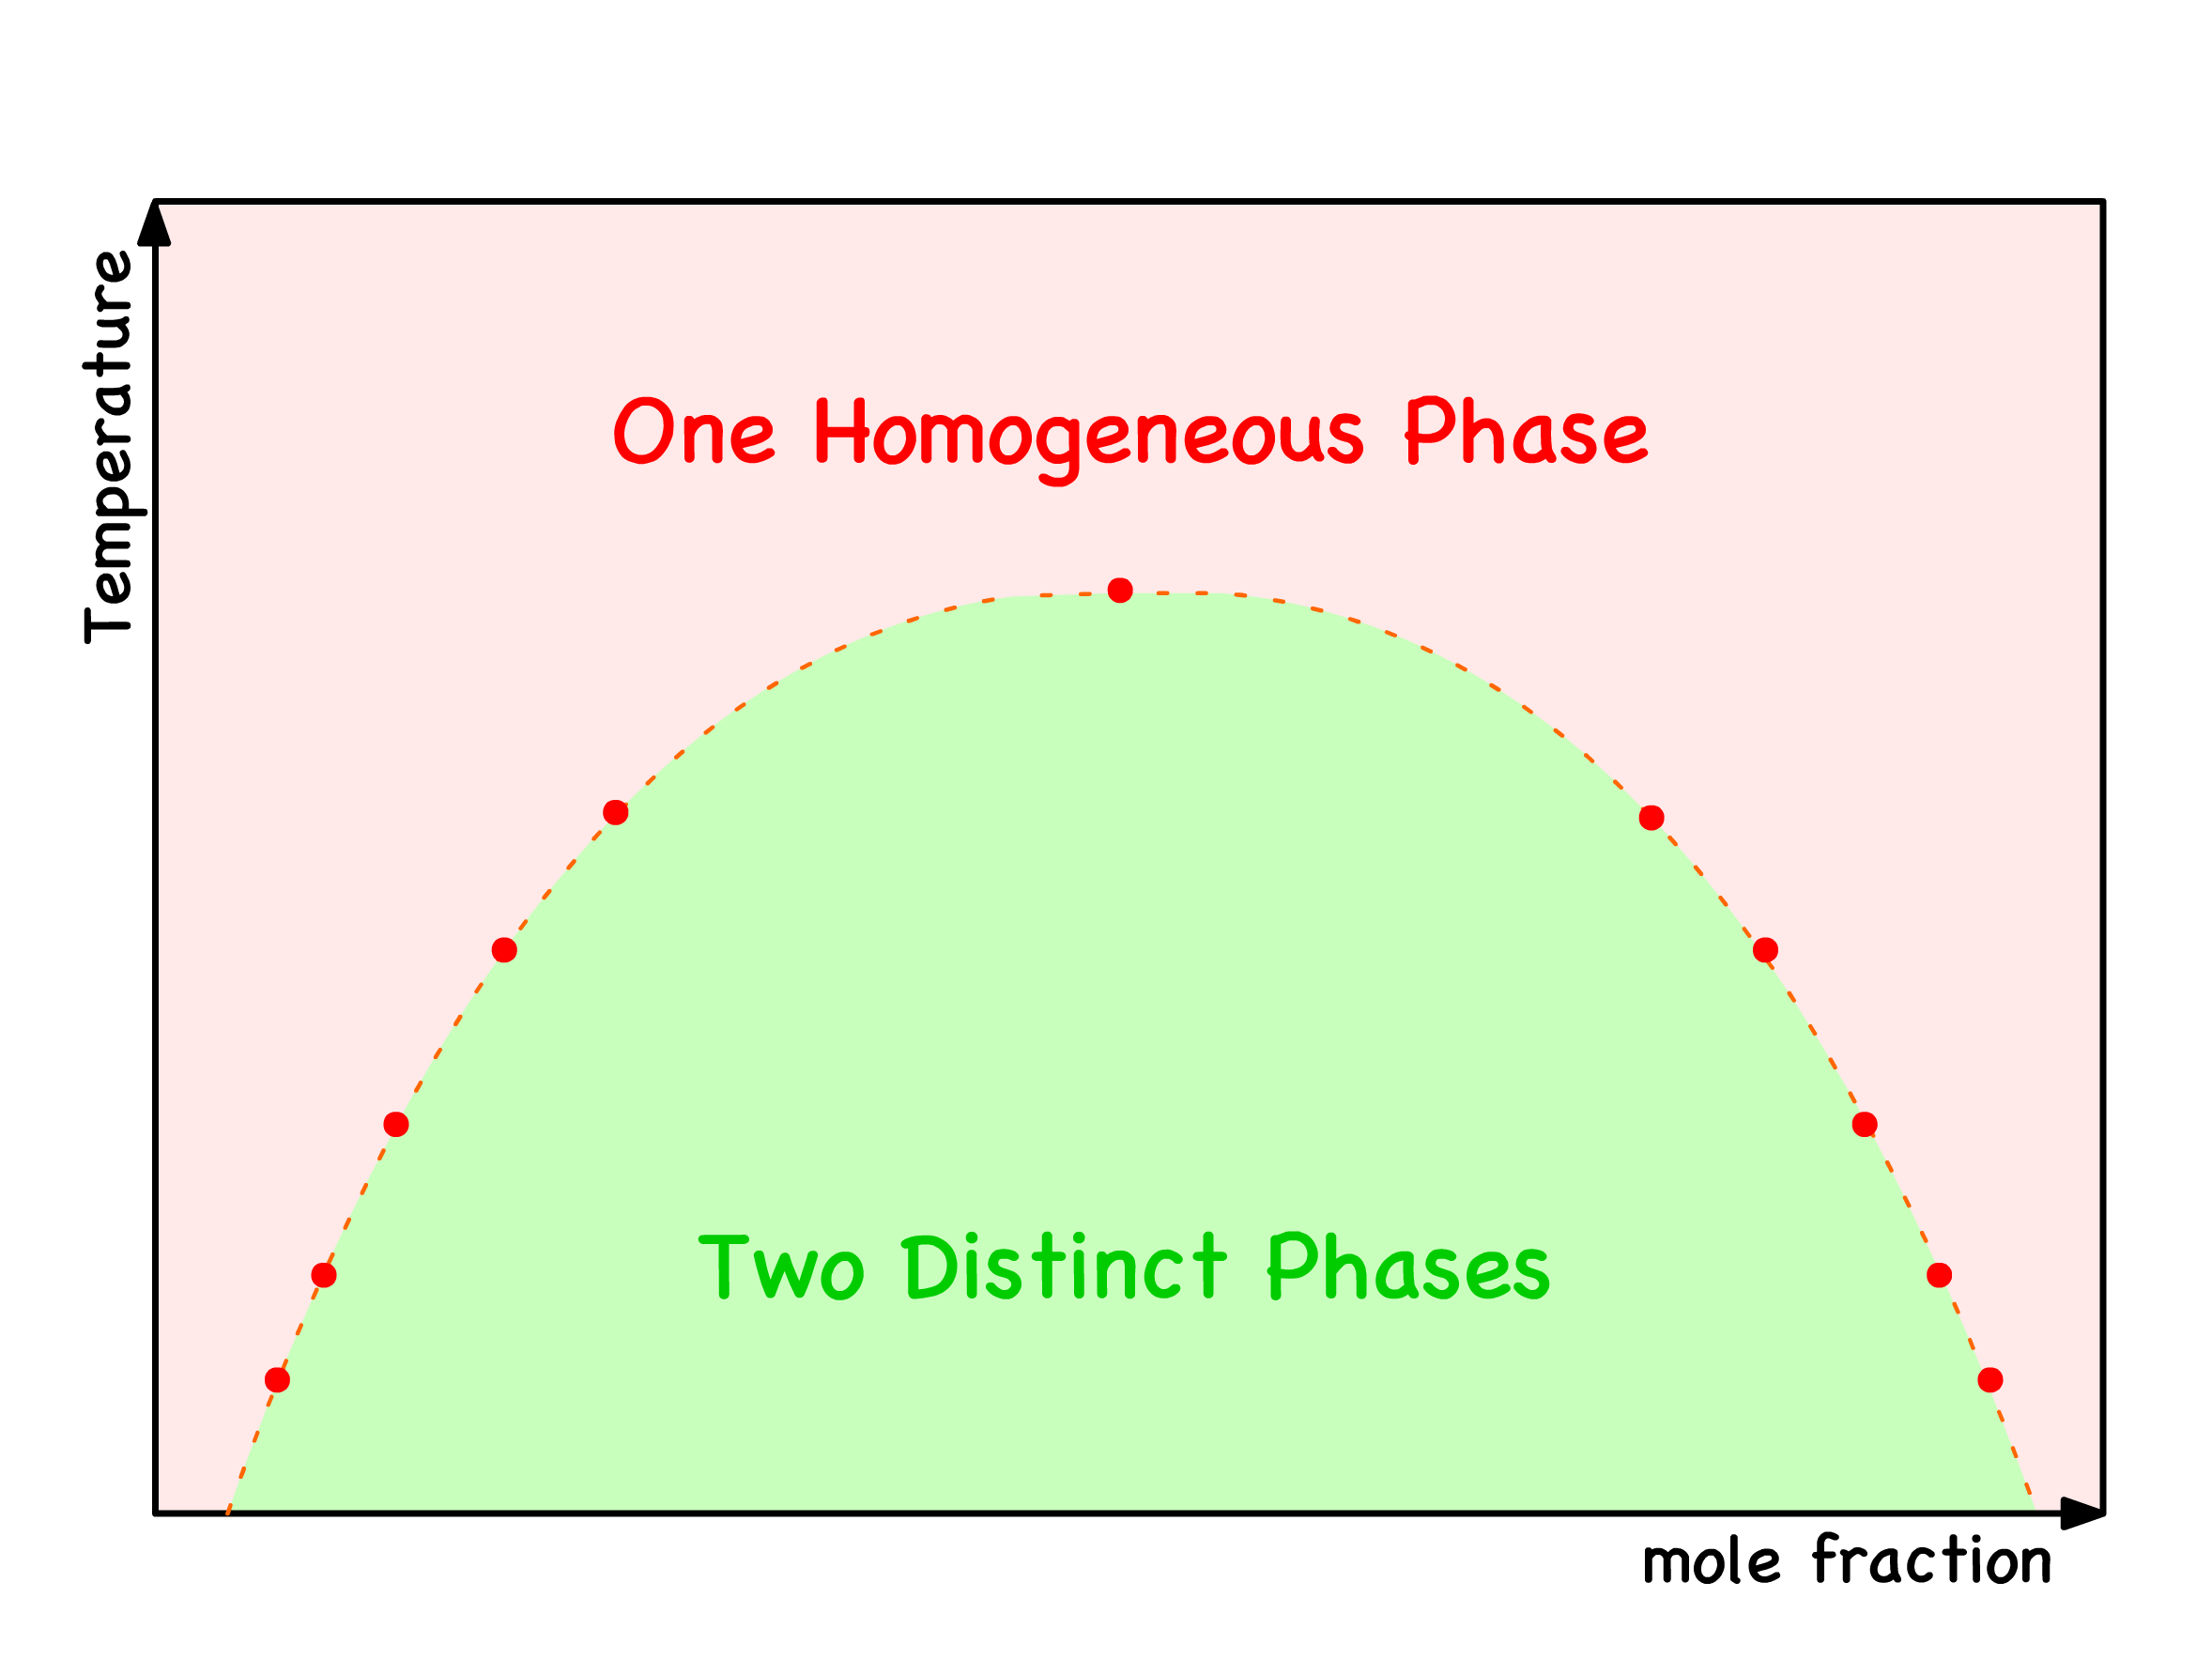
In the red regions, the most thermodynamically stable course of action is to remain as a single phase
- This arises from the necessity for the pair of balls to roll in opposite directions, leading to one of the balls attaining a higher free energy state than before
In the green regions, the most thermodynamically stable course of action is to undergo separation into two phases
- It's noteworthy that the specific values of within the green zone don't alter the outcome; as long as it's within this region, the system will inevitably decompose into the two valleys, each characterized by the respective mole fraction and x_
The delineating points between the red and green zones are referred to as binodal points
- They mark the thermodynamic thresholds where the system transitions between the stability of a single phase and the propensity to separate into two distinct phases
Local Stability and Spinodal Points
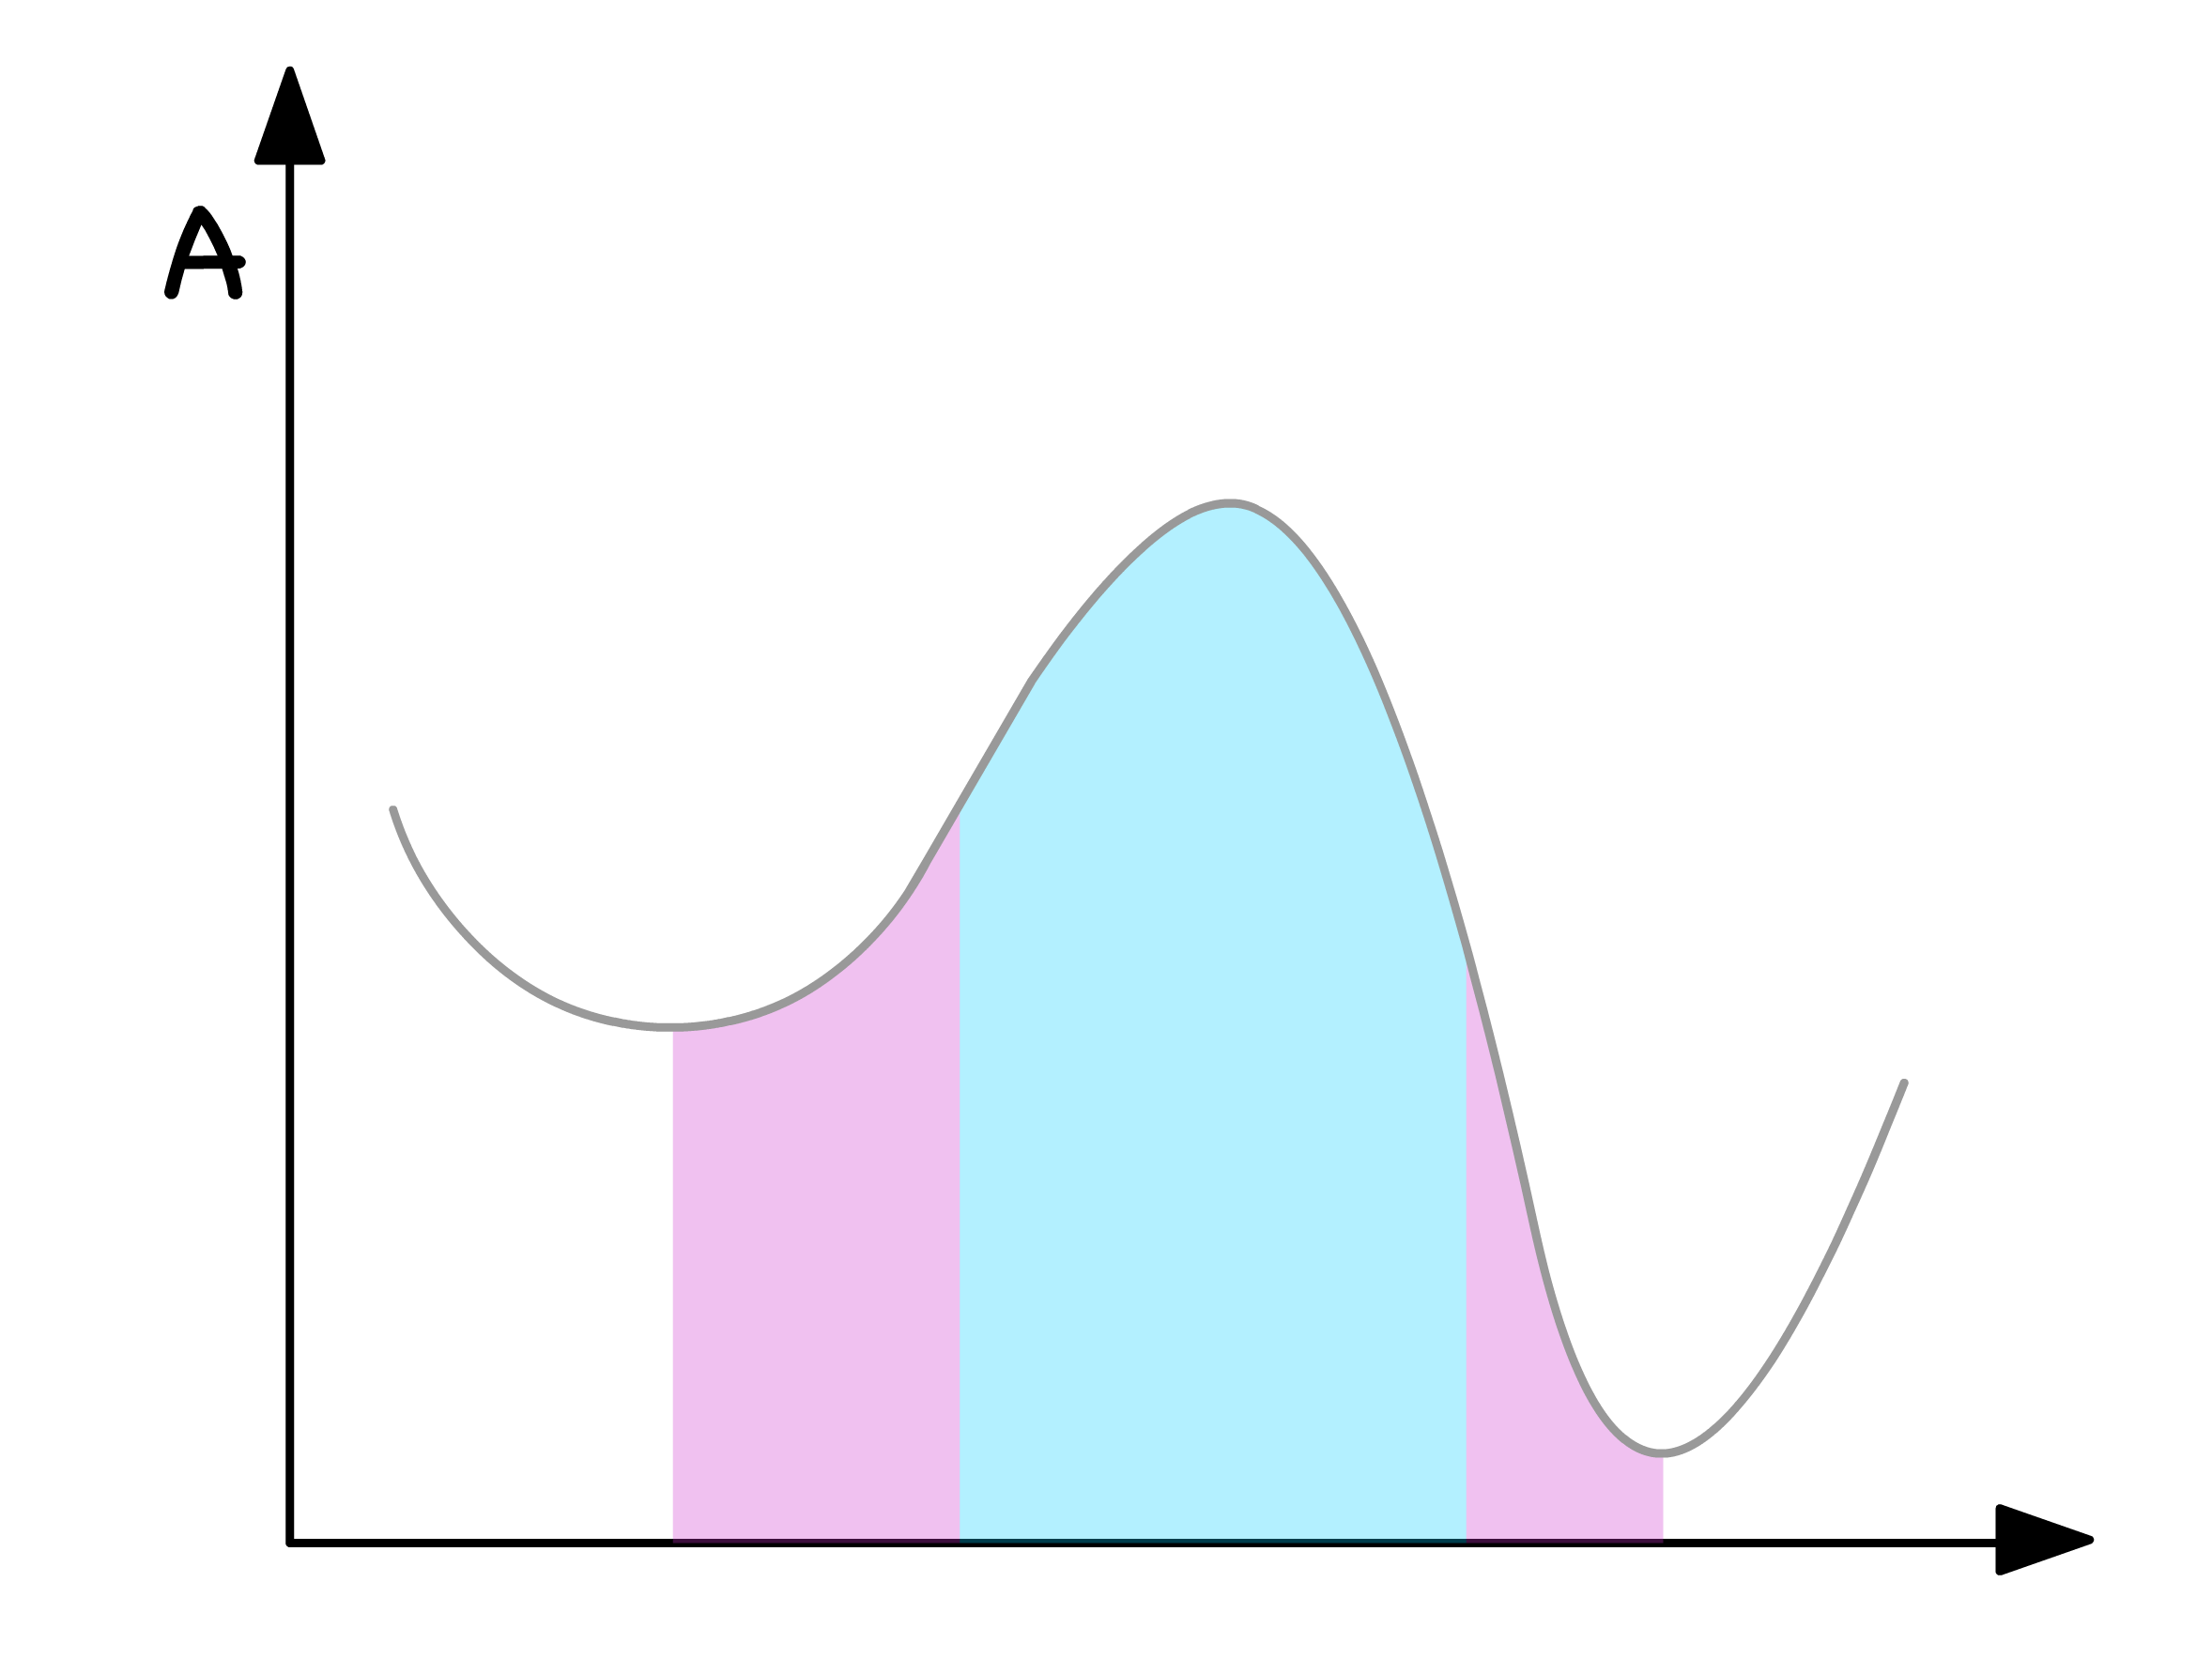
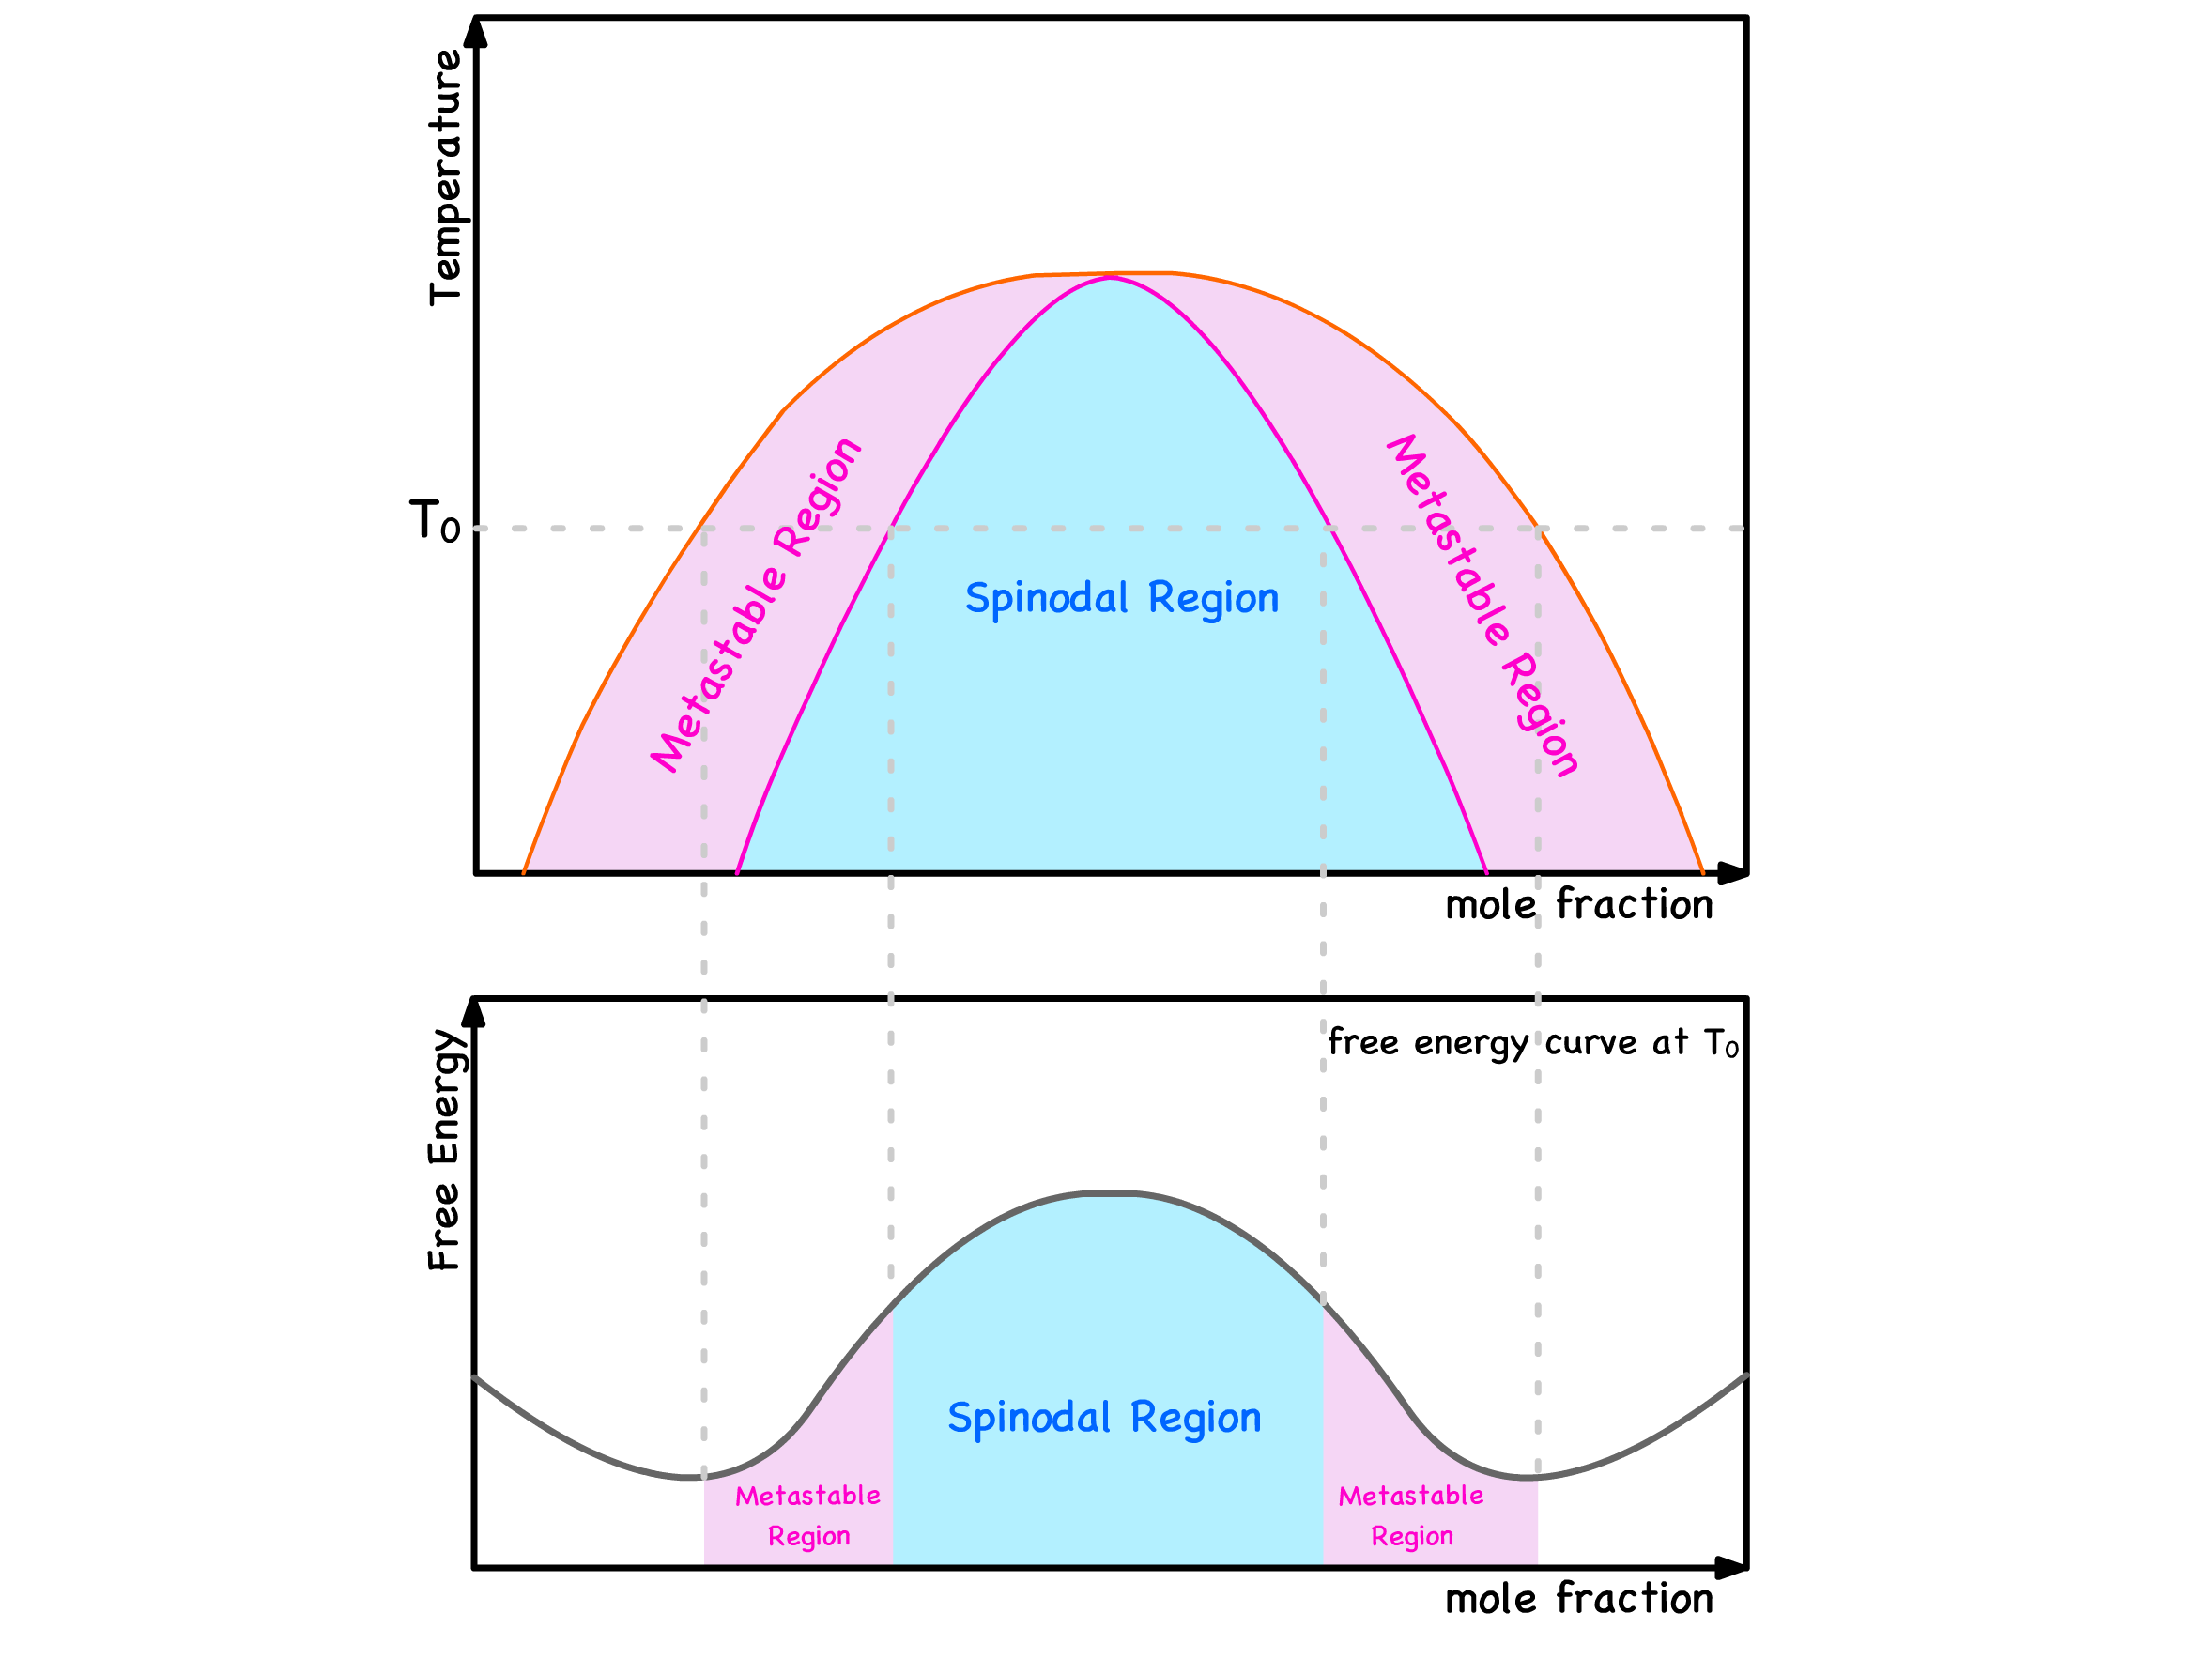
Let's journey back to the green zone, where we've established that phase separation is consistently thermodynamically favorable and dissect this area further into two distinct zones
- In our exploration of thermodynamic stability, we inadvertently skipped the crucial question of how we transition between states
- When delving into the kinetics of phase separation, understanding how minor composition fluctuations impact the system becomes paramount
In the blue region, even the slightest composition fluctuation results in a reduction in free energy
- This implies that phase separation is both thermodynamically and kinetically favorable when resides in the blue region
In the purple regions, any minute deviation in composition leads to an increase in free energy
- Consequently, phase separation is both thermodynamically and kinetically unfavorable when is situated in the purple regions
- Here, an energy barrier must be overcome to reach the global energy minimum associated with phase separation, rendering the single-phase mixture in these regions metastablemetastable
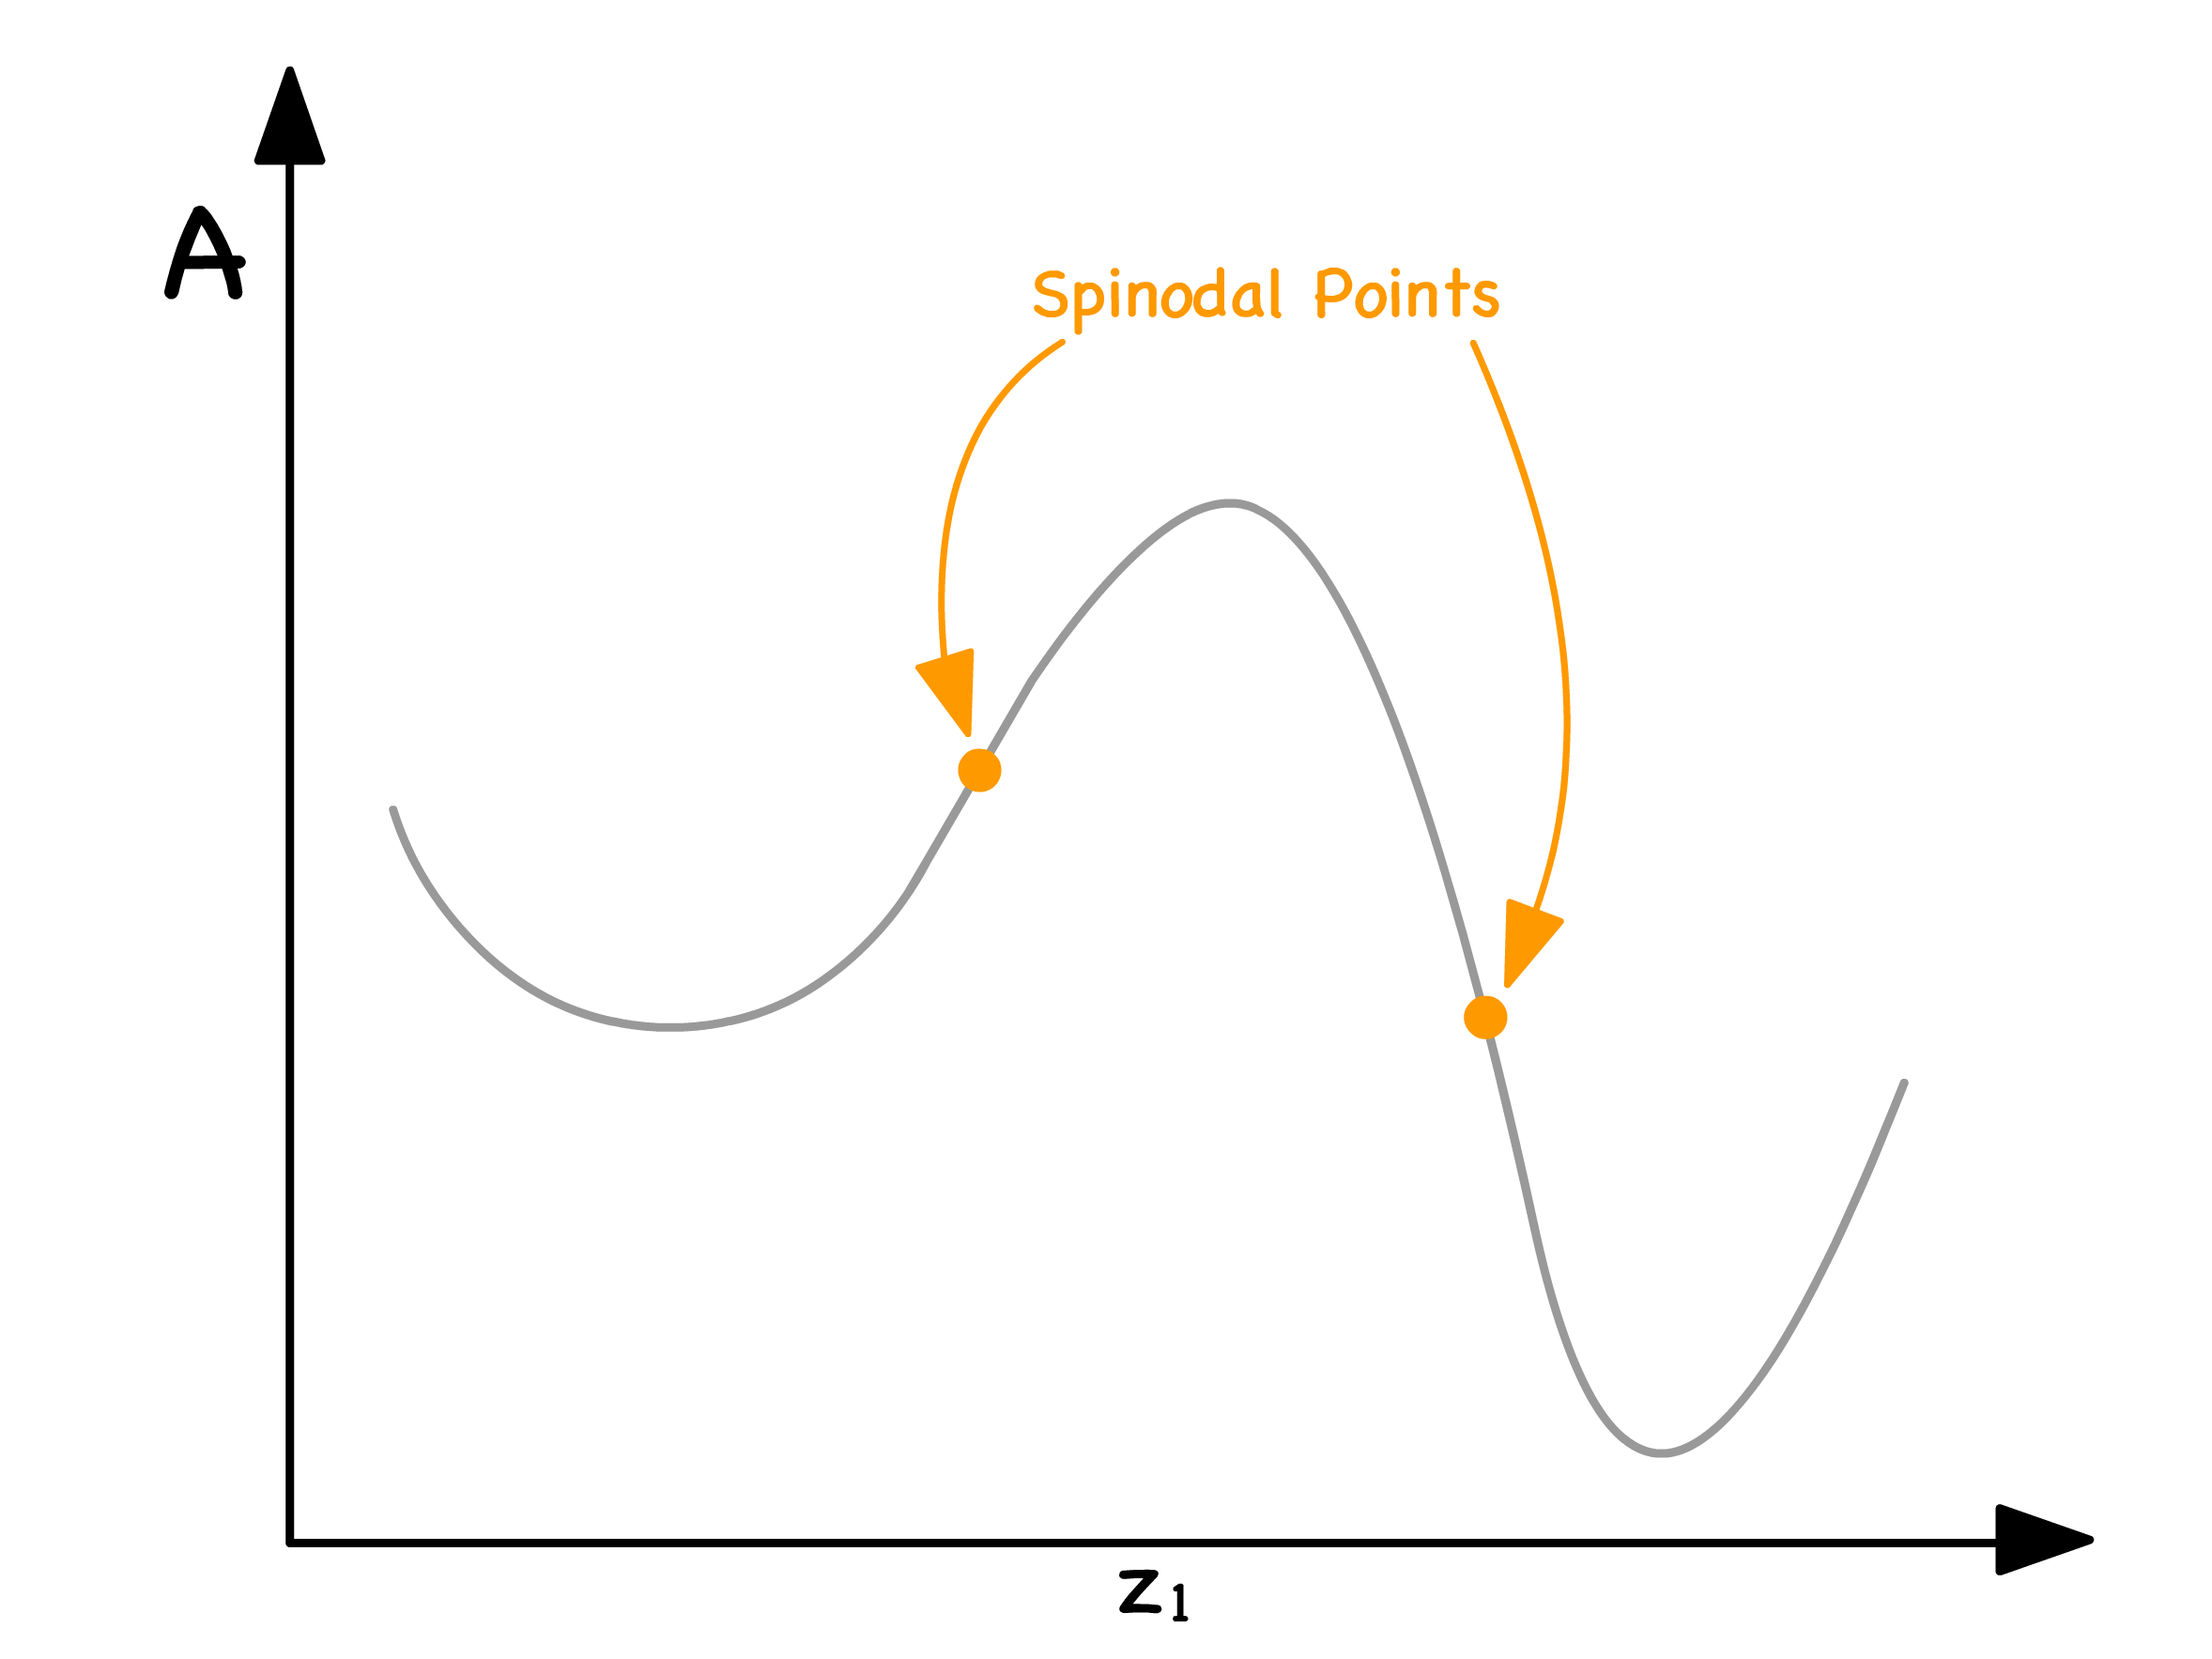
The demarcation points between the blue and purple regions are known as spinodal points
- Mathematically, these points are defined as inflection points, indicating the transition between concave up and concave down
In summarizing the insights gleaned above, we can categorize the free energy curve into three distinctive regions
Blue Region
- Both thermodynamically and kinetically favorable for phase separation
- When is in this region, there will always be two distinct phases
Purple Regions
- Thermodynamically inclined toward phase separation, but kinetics pose a hindrance
- The number of phases, when resides here, hinges on initial conditions and the presence of perturbations
Red Regions
- Both thermodynamically and kinetically unfavorable for phase separation
- When occupies these regions, a singular homogeneous mixture persists
As the Flory-Huggins parameter ( ) dictates the curve's shape, it contributes significantly to the discussion
- When , there will only be one minima. Consequently, no spinodal points exist, and the entire curve resides in the red region, resulting in mixing across all compositions
- In contrast, when , two minima emerge. This signifies the existence of two spinodal curves, dividing the curve into three distinct zones
¶ From Free Energy Curve to Phase Diagrams
Temperature and the Flory-Huggins Parameter
Until now, our discourse has revolved around composition variations, keeping the temperature constant
- However, it's evident that temperature plays a pivotal role in influencing phase separation, prompting us to introduce another dimension to our exploration
The contour of the free energy curve is inherently shaped by the Flory-Huggins parameter, a factor intricately tied to temperature
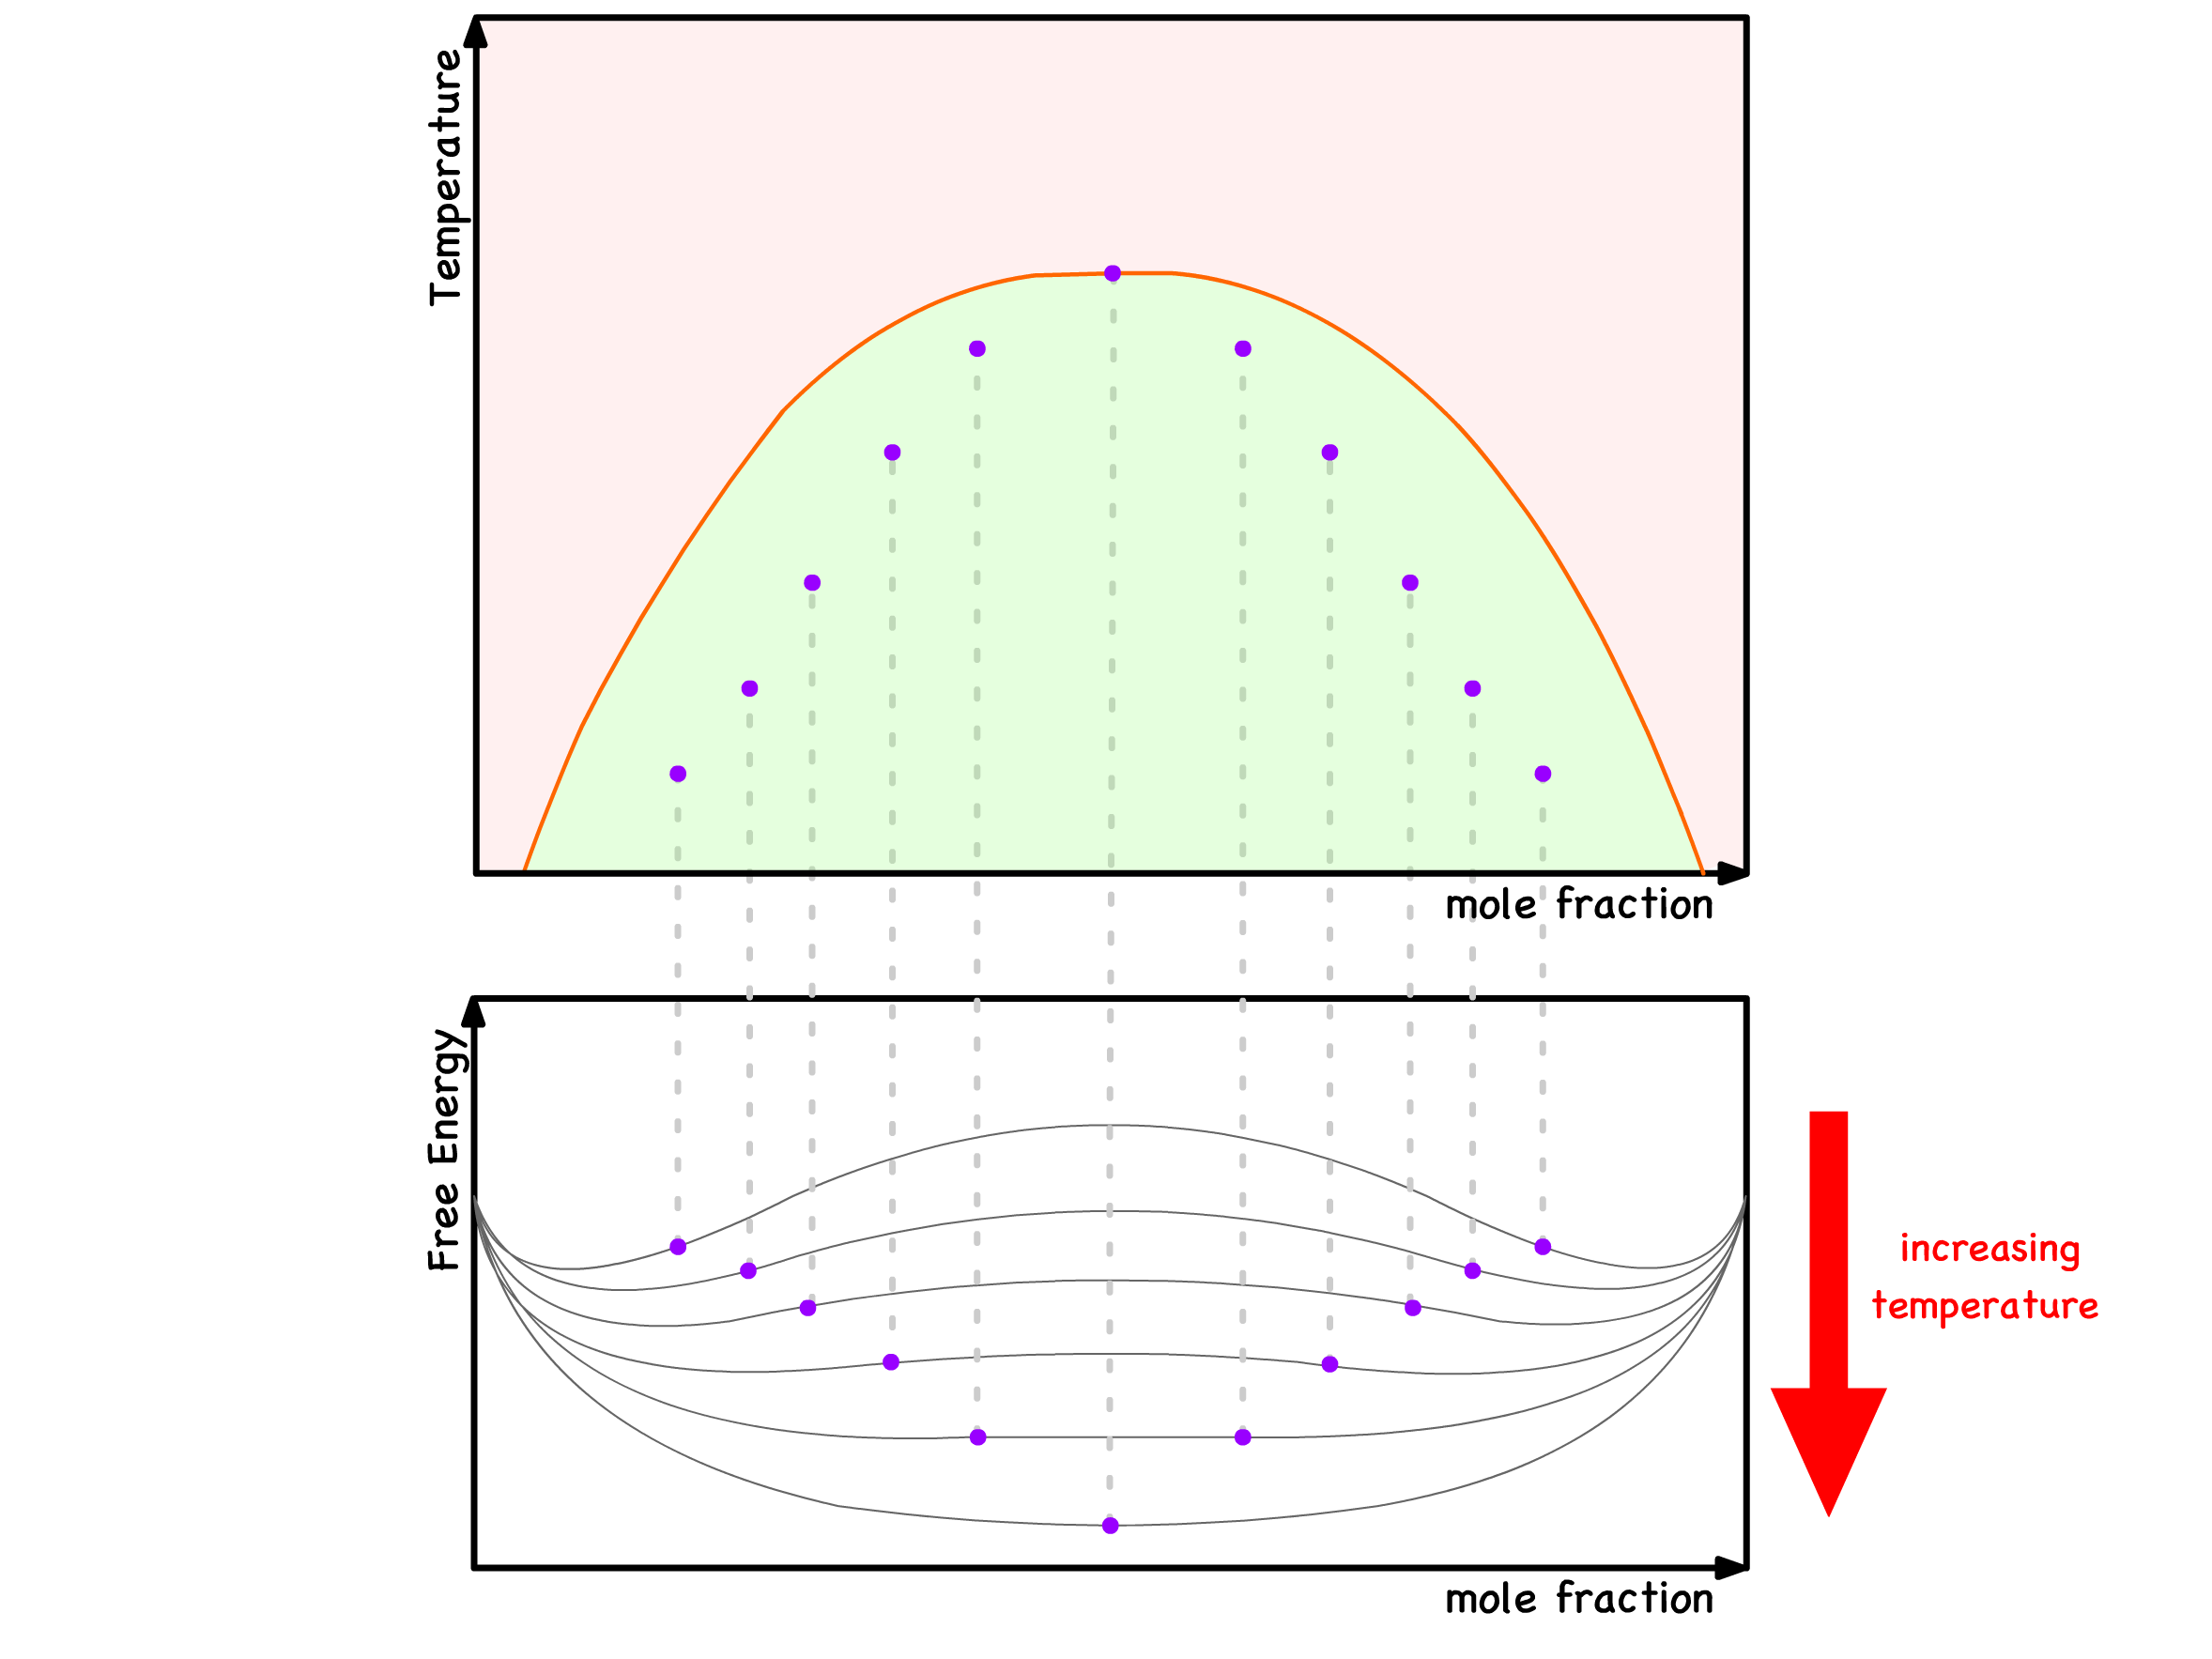
- As the temperature increases, the Flory-Huggins parameter decreases, indicated by the elimination of a minimum in the free energy versus composition curve
The critical temperature, denoted as , marks the point at which one of the two minima ceases to exist in the free energy curve
- This critical temperature corresponds to the condition where attains a value of
- In a qualitative sense, it signifies the temperature at which binodal and spinodal points coincide
- Beyond and at the critical temperature, mixing becomes inevitable across all compositions
The Phase Diagram
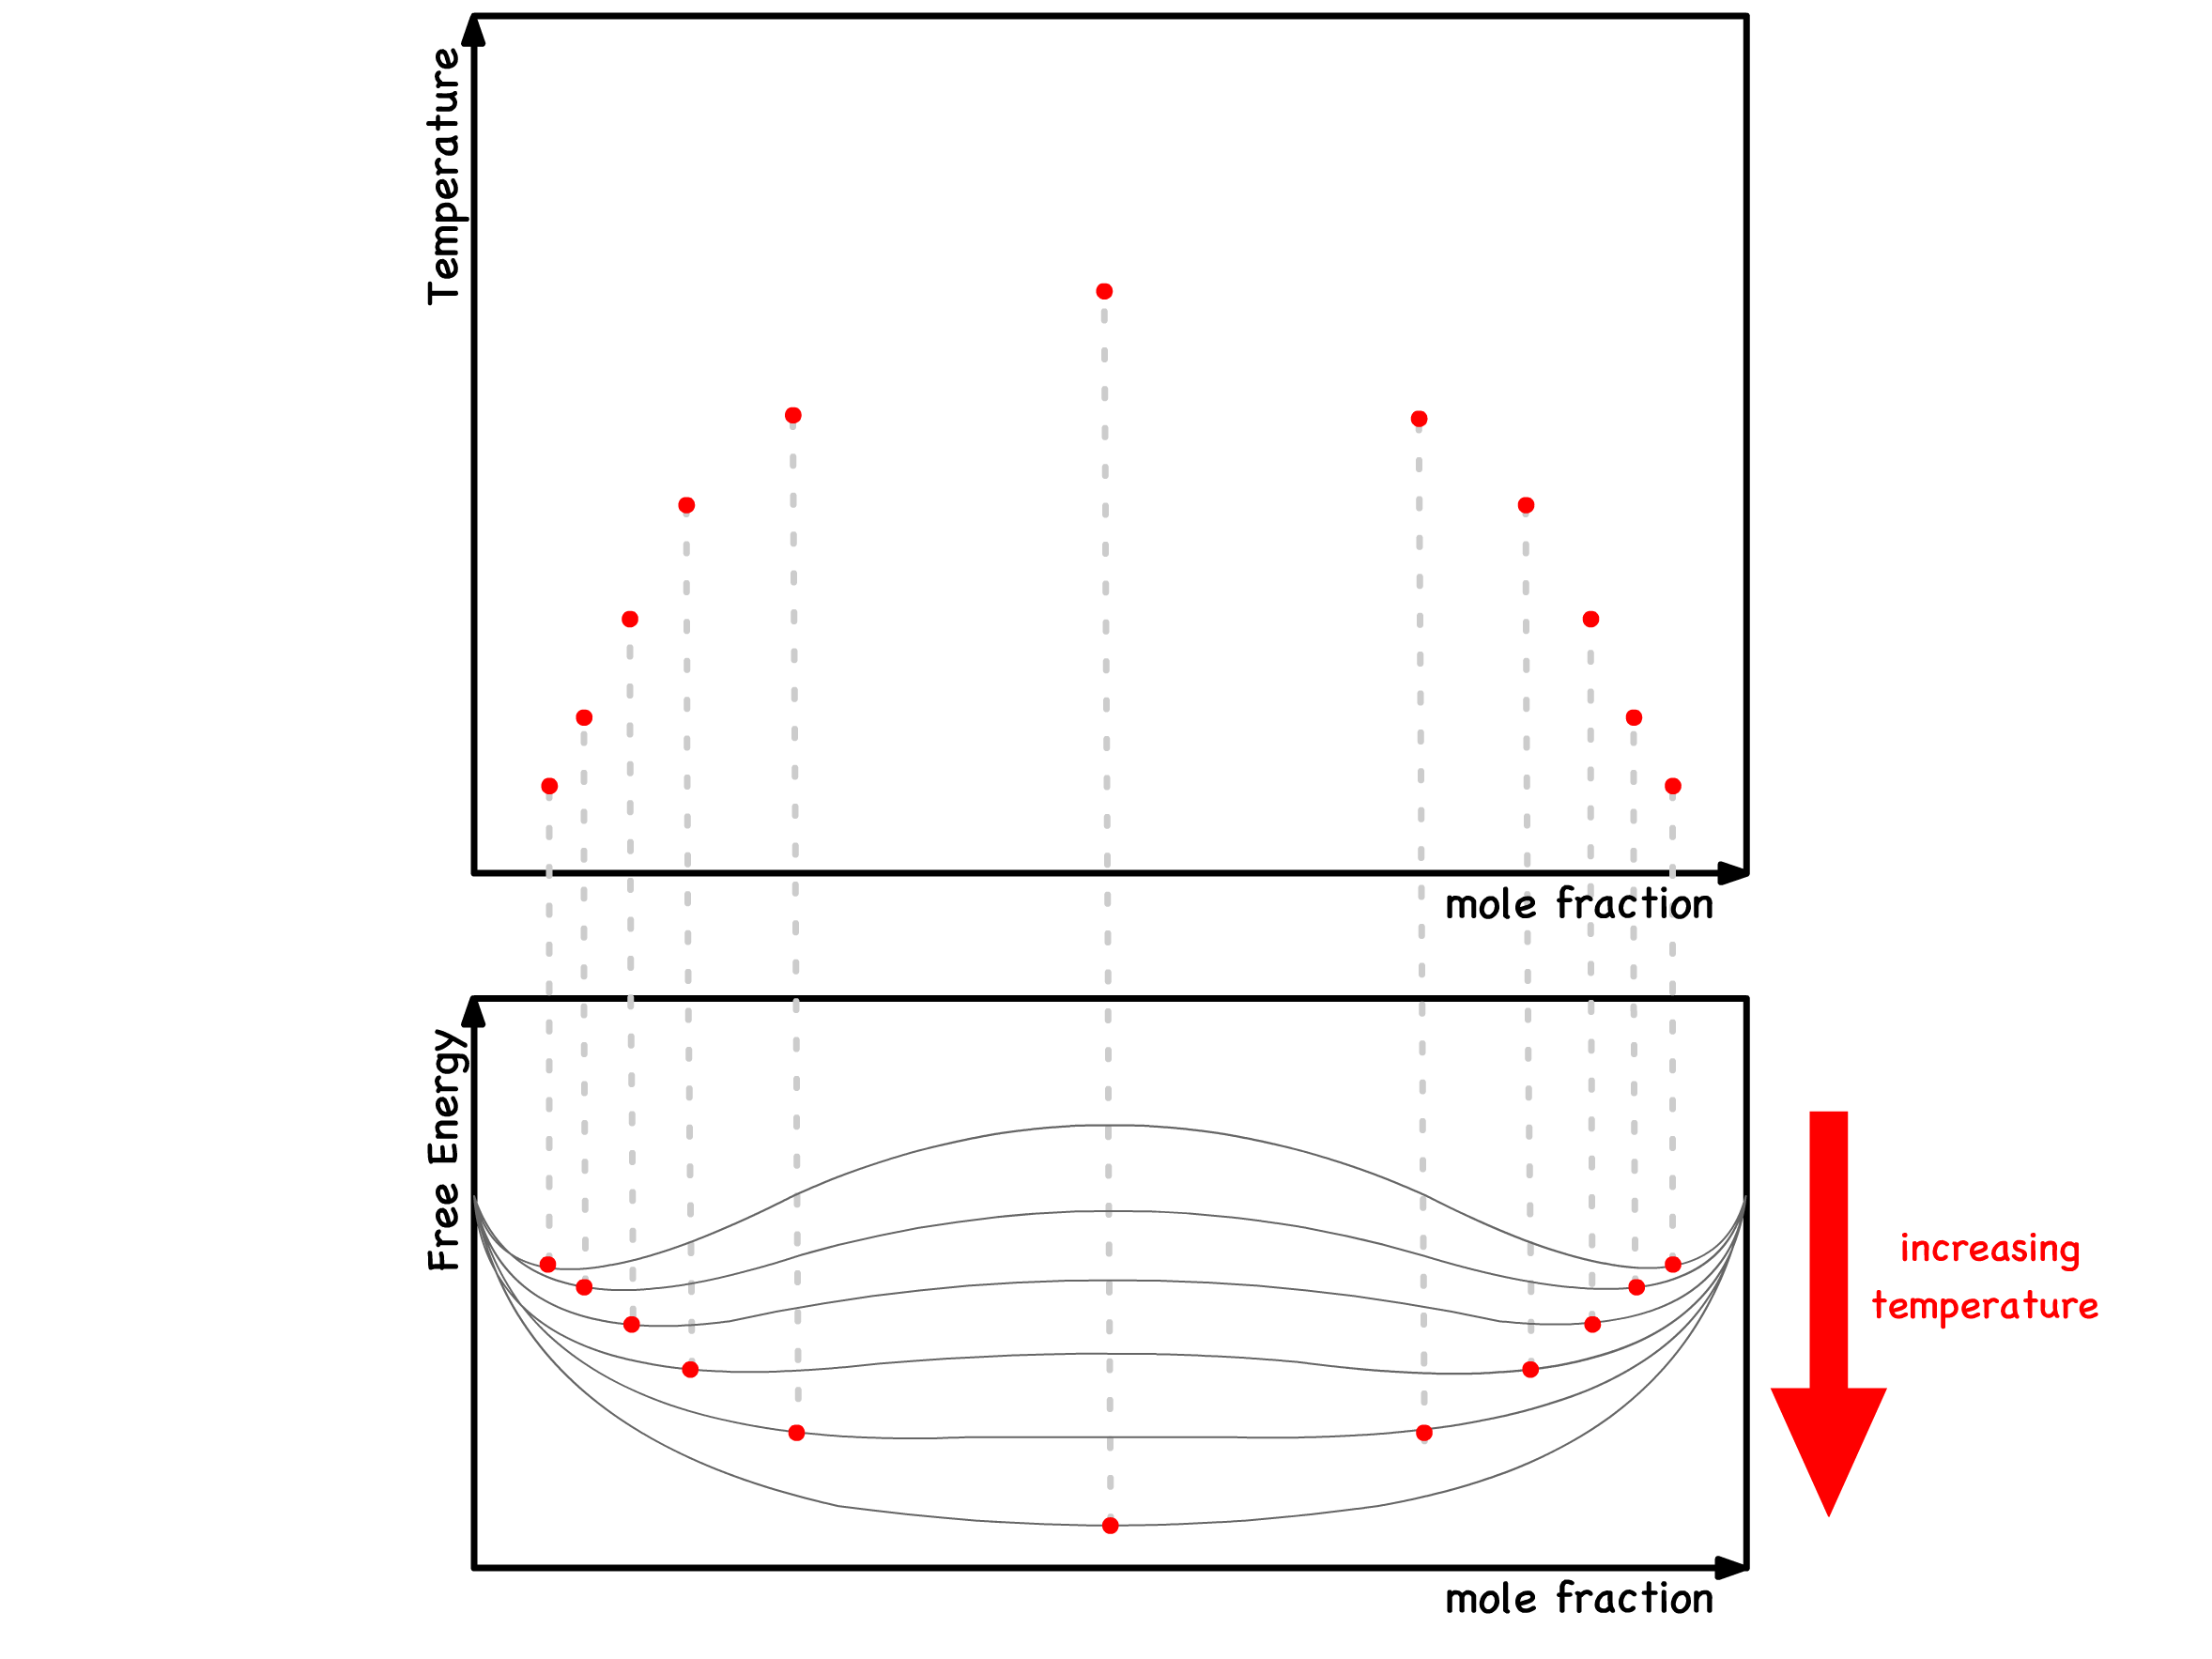
We can extend our understanding by constructing a phase diagram using the familiar free energy curve
- This involves a simple transformation, where we replace the y-axis representing free energy with the temperature axis
- The phase diagram essentially becomes a visual representation of how the system's composition and temperature interact to dictate its stability and phase behavior
We can start by constructing the traditional phase diagram that we are already acquainted with
- For any specific temperature, we identify two binodal points that precisely delineate the begining and ending of phase separation. These points can be mapped on the phase diagram
- This process is systematically repeated across various temperatures below the critical temperature
- By aggregating all these temperature-specific binodal points, we create the binodal curve
- This resulting phase diagram serves as a comprehensive guide, providing insights into whether phase separation or mixing is thermodynamically favored at any given temperature and composition
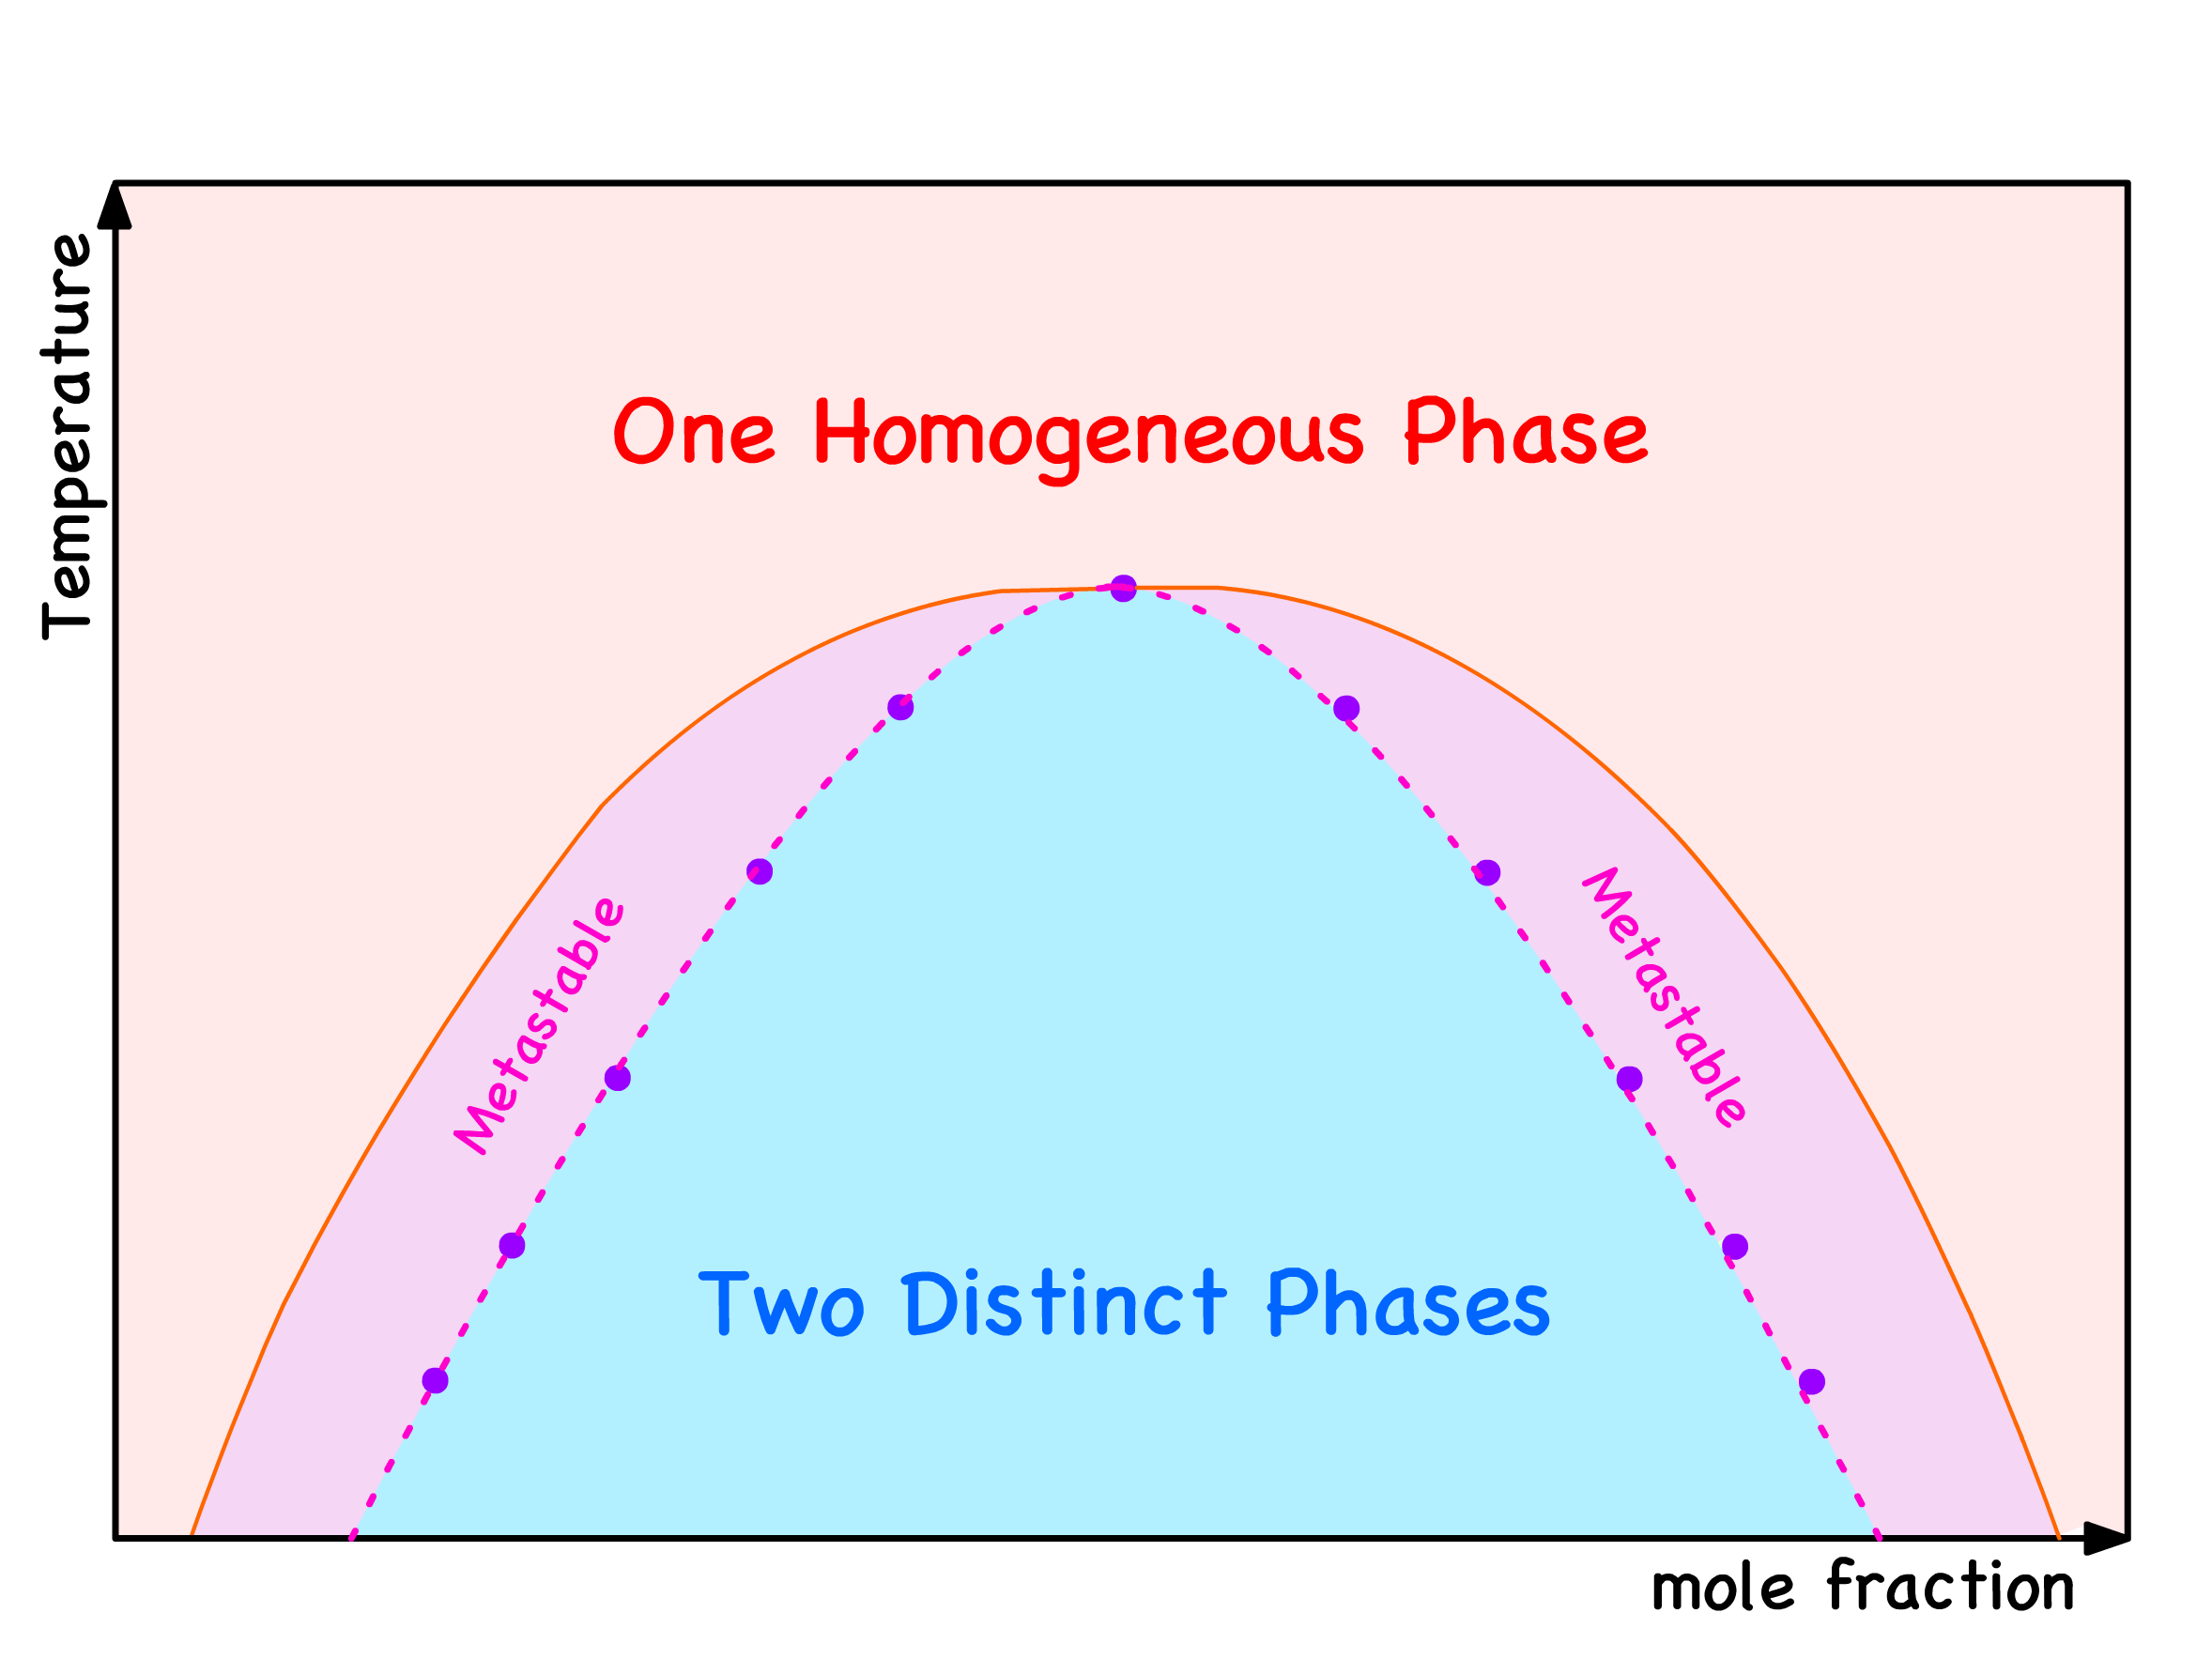
We can take this further and incorporate kinetic information into the phase diagram
- For a specific temperature, we pinpoint two spinodal points that precisely mark the commencement and culmination of the metastable region. These points can be mapped on the phase diagram
- This systematic process is then reiterated across various temperatures below the critical temperature
- By consolidating all these temperature-specific spinodal points, we establish the spinodal curve
- This resultant phase diagram provides us with both thermodynamic and kinetic insights
Mathematical Definitions
To enhance the precision of our language, we can introduce mathematical definitions to our phase diagram
- Considering that binodal points are defined within the valley of the free energy curve, the binodal line can be expressed as
- As spinodal points are associated with the inflection points of the free energy curve, the spinodal line is defined by
- The critical point, where the spinodal and binodal curves merge, can be determined by the condition
The Flory-Huggins parameter can be easily derived from the spinodal in terms of composition
- When the Flory-Huggins parameter is large, and the mole fraction becomes small (), utilizing the binodal expression yields
- The free energy parameter reaches its minimum at large values of the Flory-Huggins parameter. Consequently, the limiting solubility can be determined as the value of the parameter using the binodal conditionon
¶ Mechanism of Phase Separation
We have established that there are two regions that is capable of undergoing phase separation
- The region within the spindoal points or spinodal curve is called the spinodal region
- The region between a spindoal point and binodal point or sandwitched between the spinodal and binodal curve is called the metastable region
Spinodal Decomposition
Inside the spinodal lines any change in composition lowers the free energy and fluctuations in composition are amplified
- This spontaneous demixining process is called spinodal decomposition
- Spinodal decomposition is a mechanism by which a single thermodynamic phase spontaneously separates into two phases ( without nucleation )
In spinodal decomposition, material flows from region of low concentration to region of high concentration
- This "uphill diffusion" is characteristic of spinodal decomposition
Classical Nucleation Theory
Fluctuations in composition in the metastable region increases the free energy
- The system has to go through an energy barrier to achieve phase separation
- Demixing is proceeded by formation of small molecule clusters
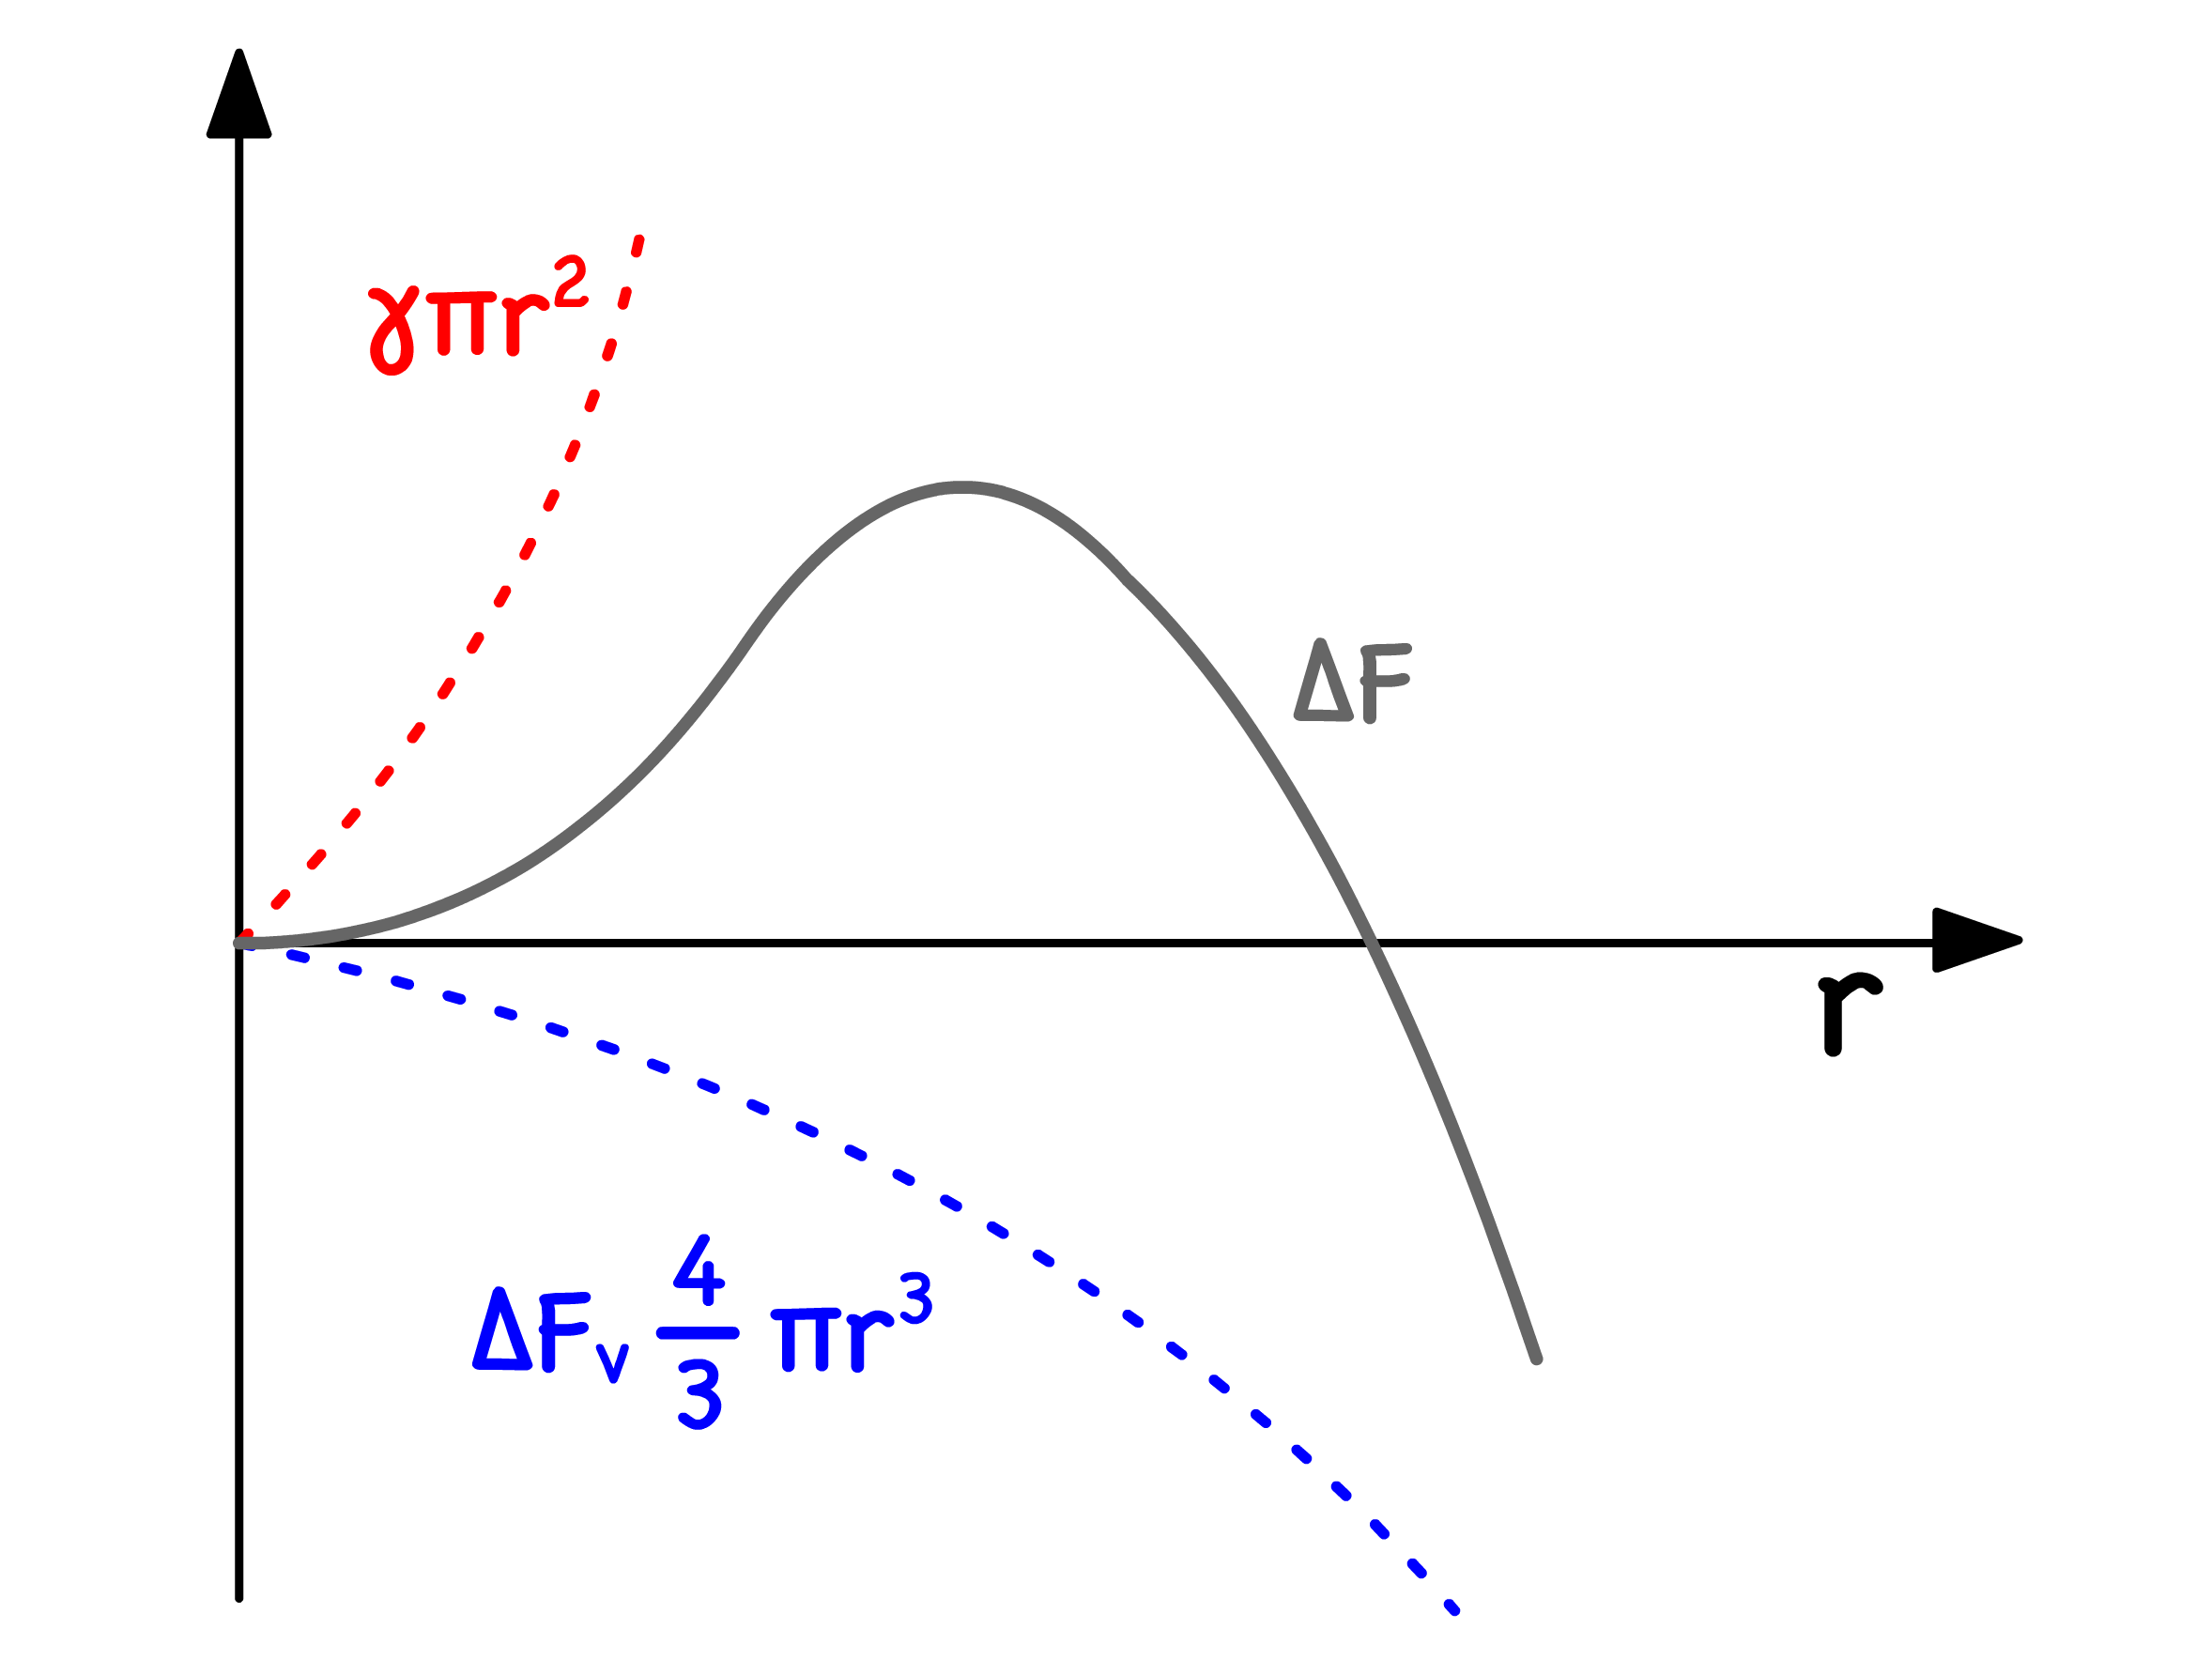
We assume the free energy of nucleation ( free energy needed to form a stable molecule cluster ) can be expressed in terms of volume and nucleus area
- We shall also assume the surface tensions are independent of nulcear radius
Suppose the nucleus is spherical in nature, we can reexpress the volume and sufrace area term
- Since is always positive and is always negative, the resulting curve of will have a maximum
- The radius corresponding to the maximum ( ) can be found using the first derivative
- Substituting in will then give us the height of the maximum, which corresponds to the activation barrier of nucleation
Since there is an activation barrier for nucleation, we can use the Arrhenius equation to model the kinetics
¶ Liquid-Solid Phase Transitions
The kinetics of nucleation in Liquid-Solid Phase Transitions is similar to that of liquid-liquid demixing
- The main difference is that Liquid-Solid phase transition can proceed via homogeneous or heterogeneous nucleation
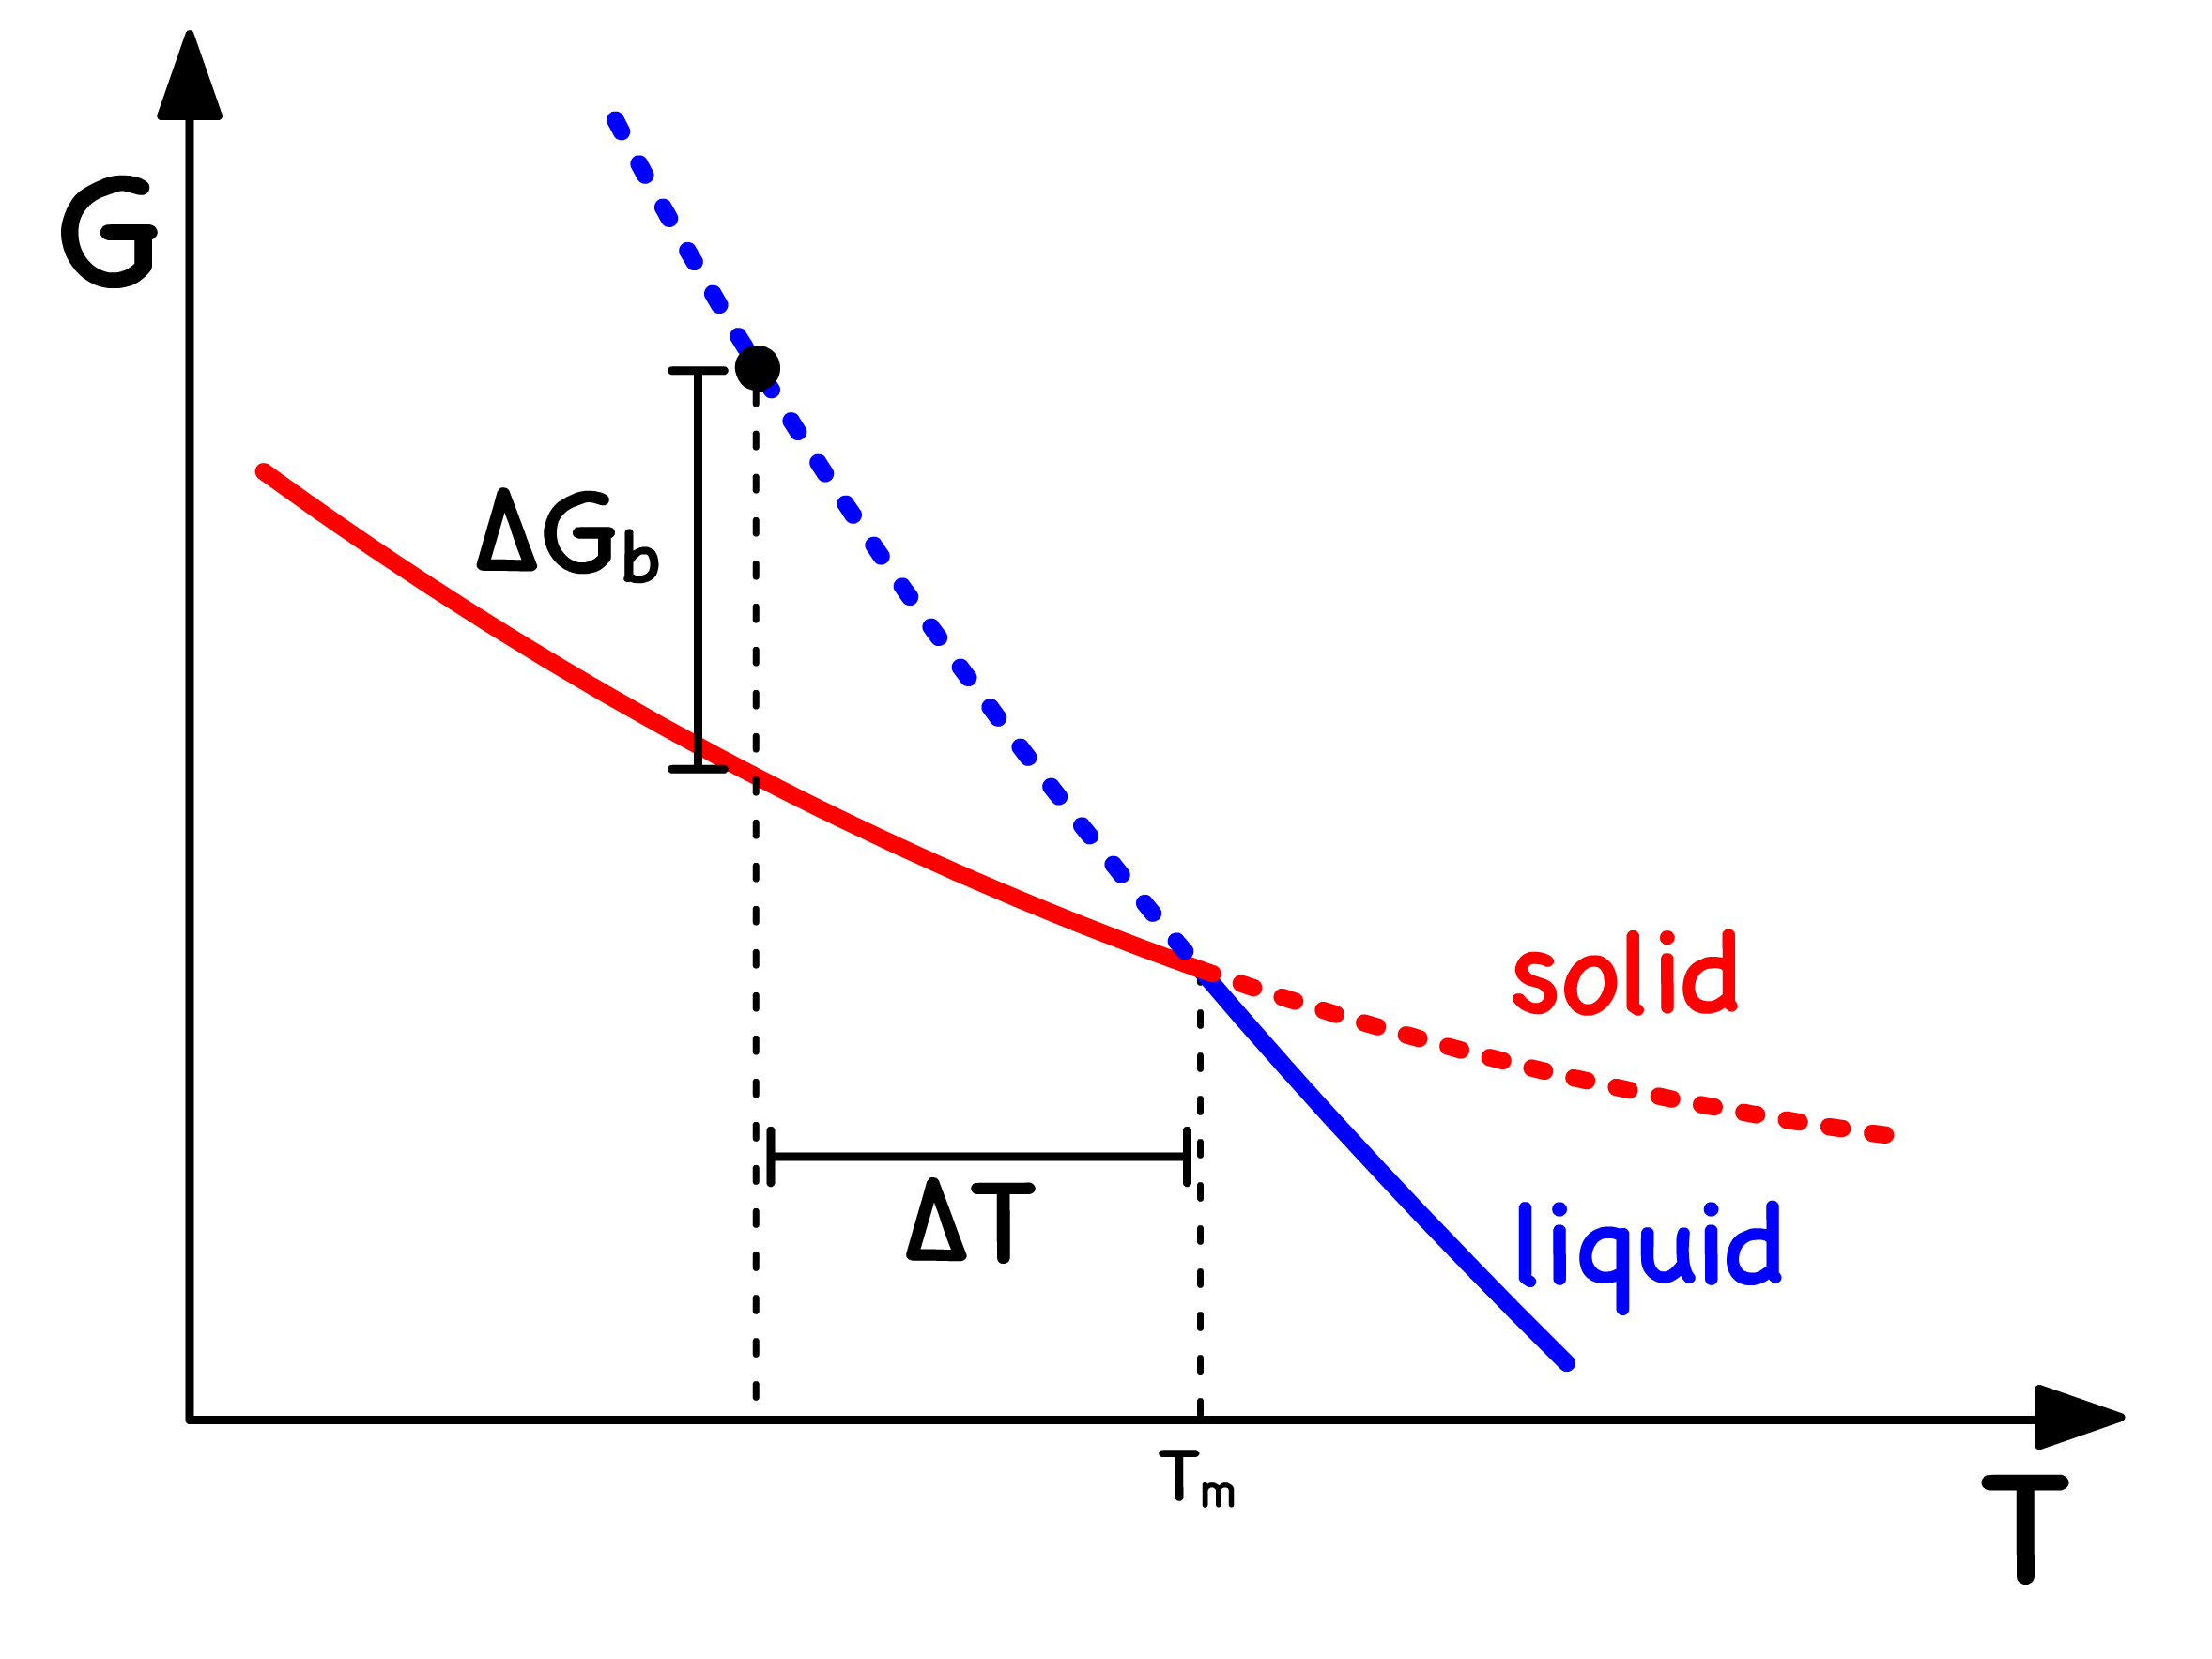
Undercooling is a phenomenon that happens when the system remains in the liquid phase even though the temperature is below the freezing point
- When this happens, the system must have a higher Gibbs energy than expected
Homogenous Nucleation
We can easily use the same assumptions from the classical nucleation theory to obtain an equation for the Gibbs free energy of nucleation
- Given that our original derivation made no assumption about the free energy, we should expect the same result
- Using the expression by assuming is constant, we can obtain better expressions
Heterogenous Nucleation
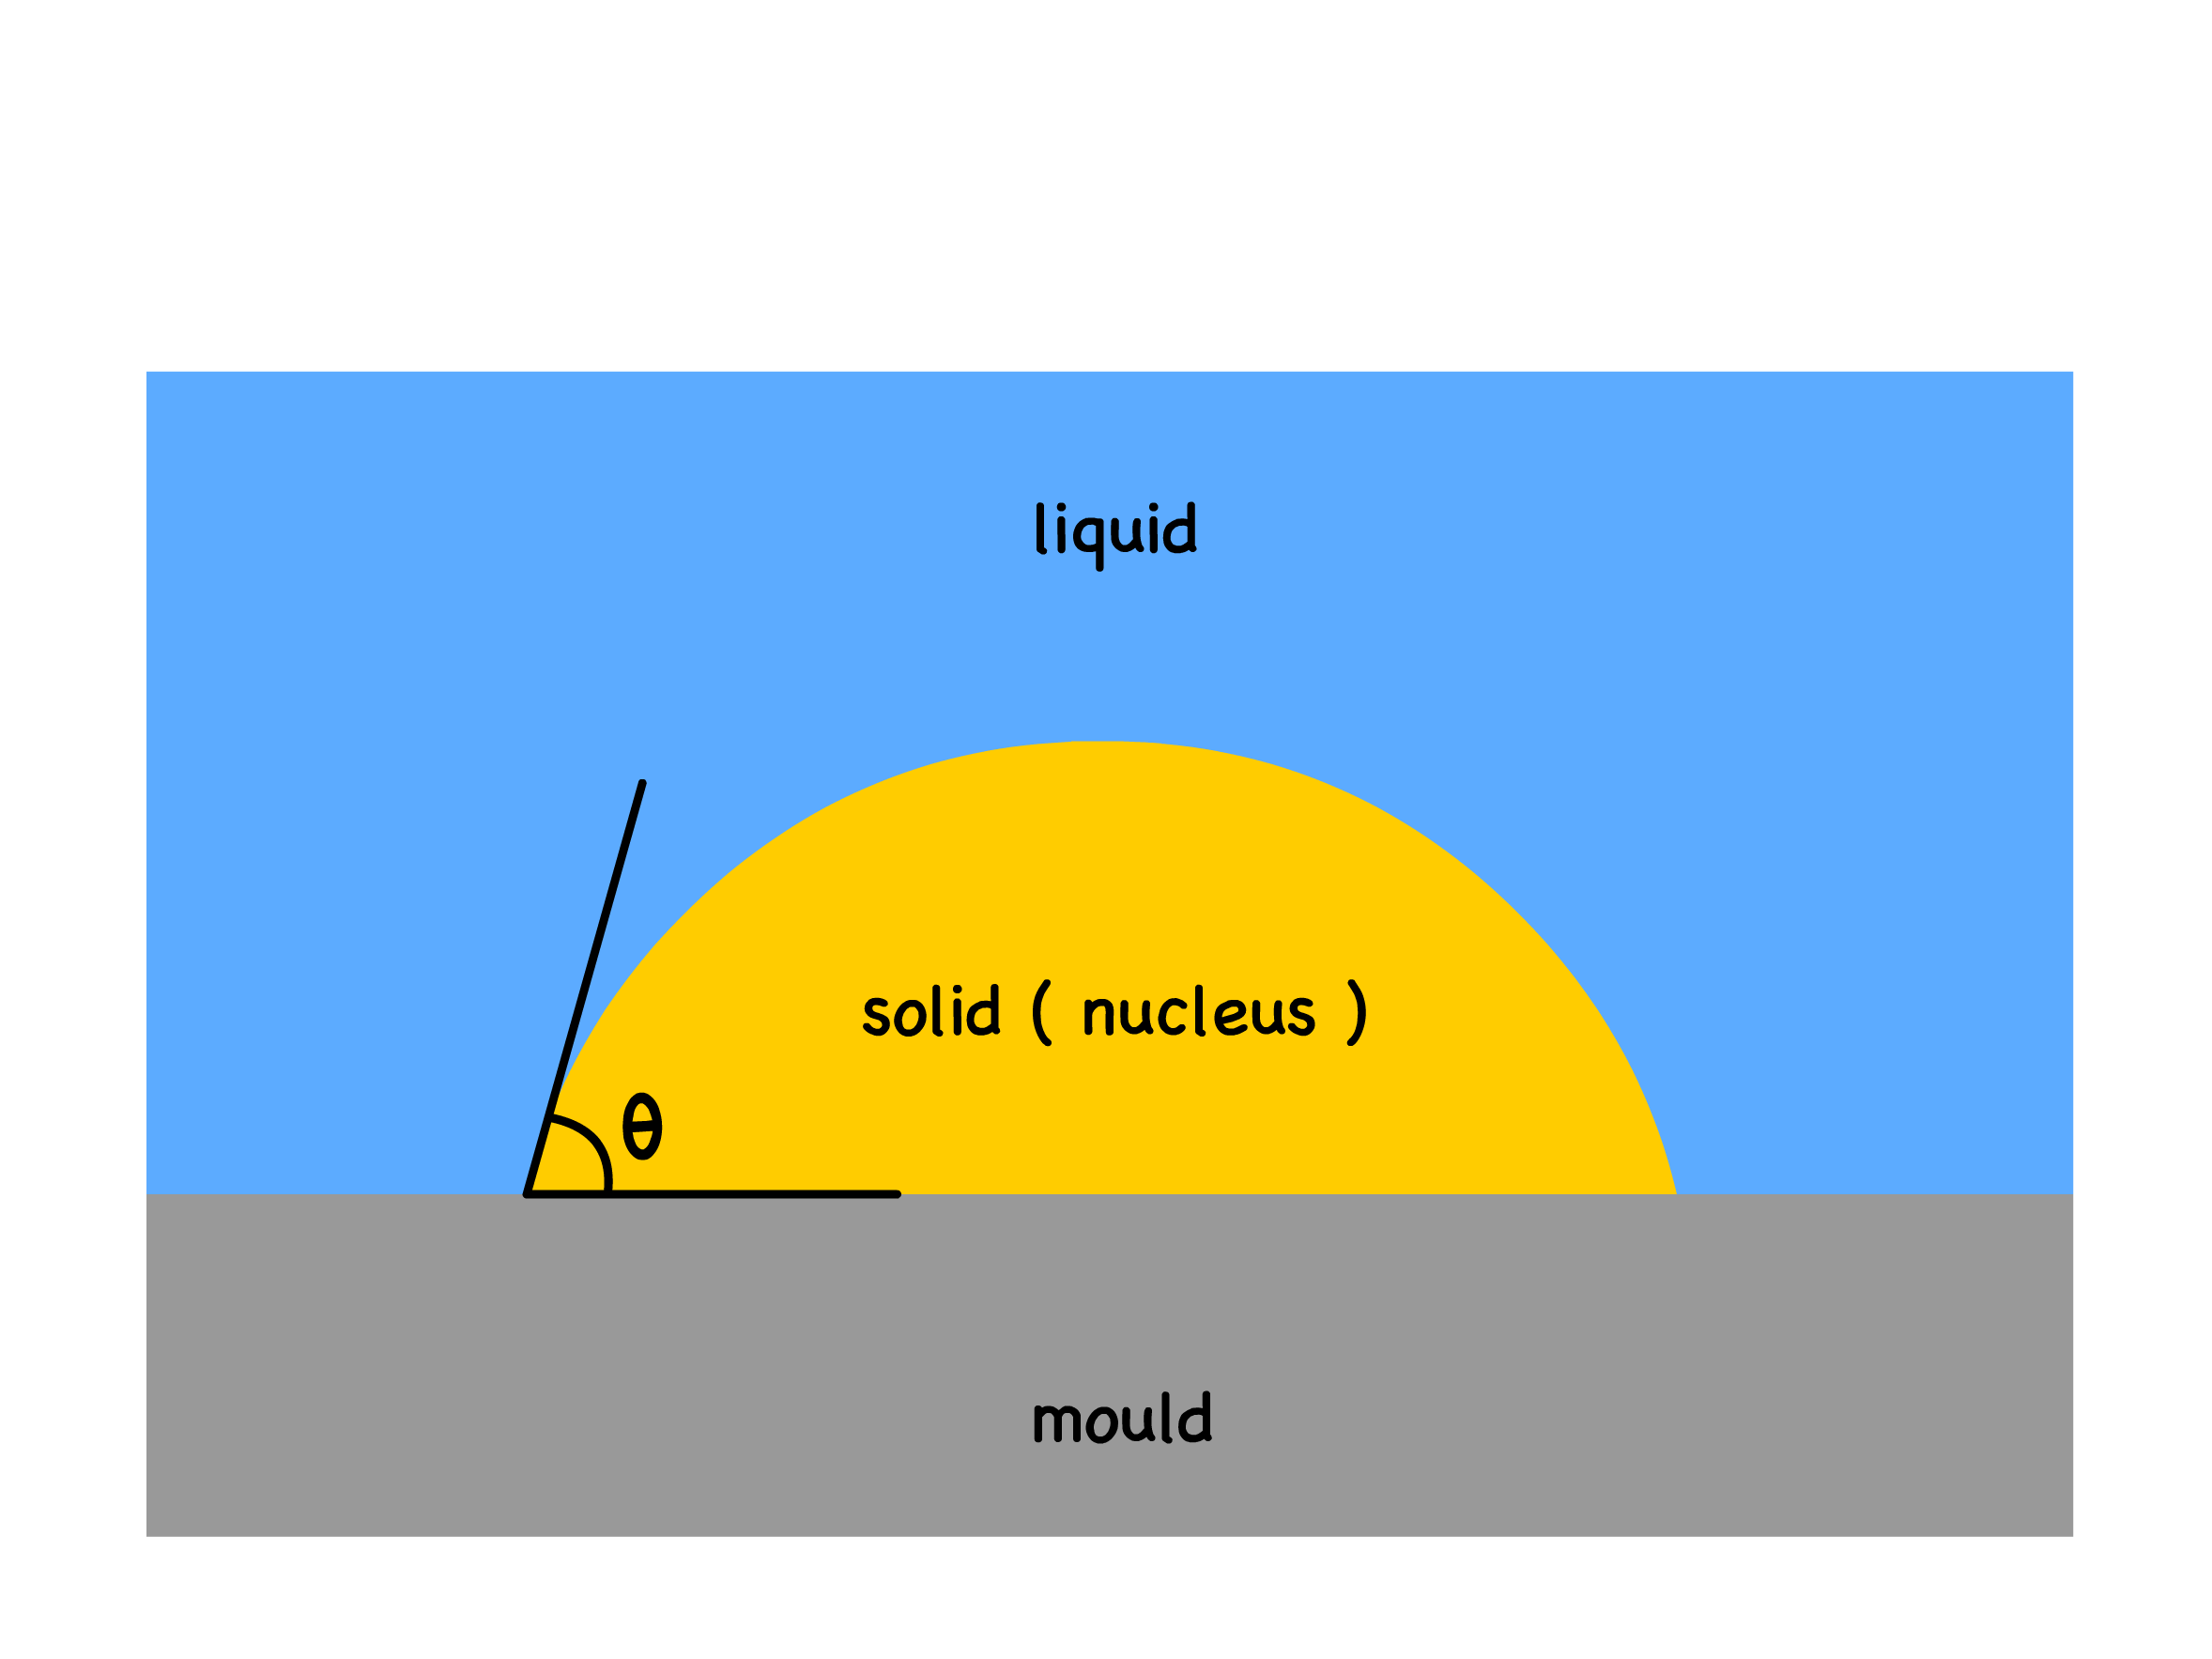
In the presence of impurities, the free energy of nucleation chages due to the additional surface tension
- Suppose the phase transition now takes place on a substrate
- The expression for Gibbs free energy of nucleation will have to be modified to account for the different interfaces
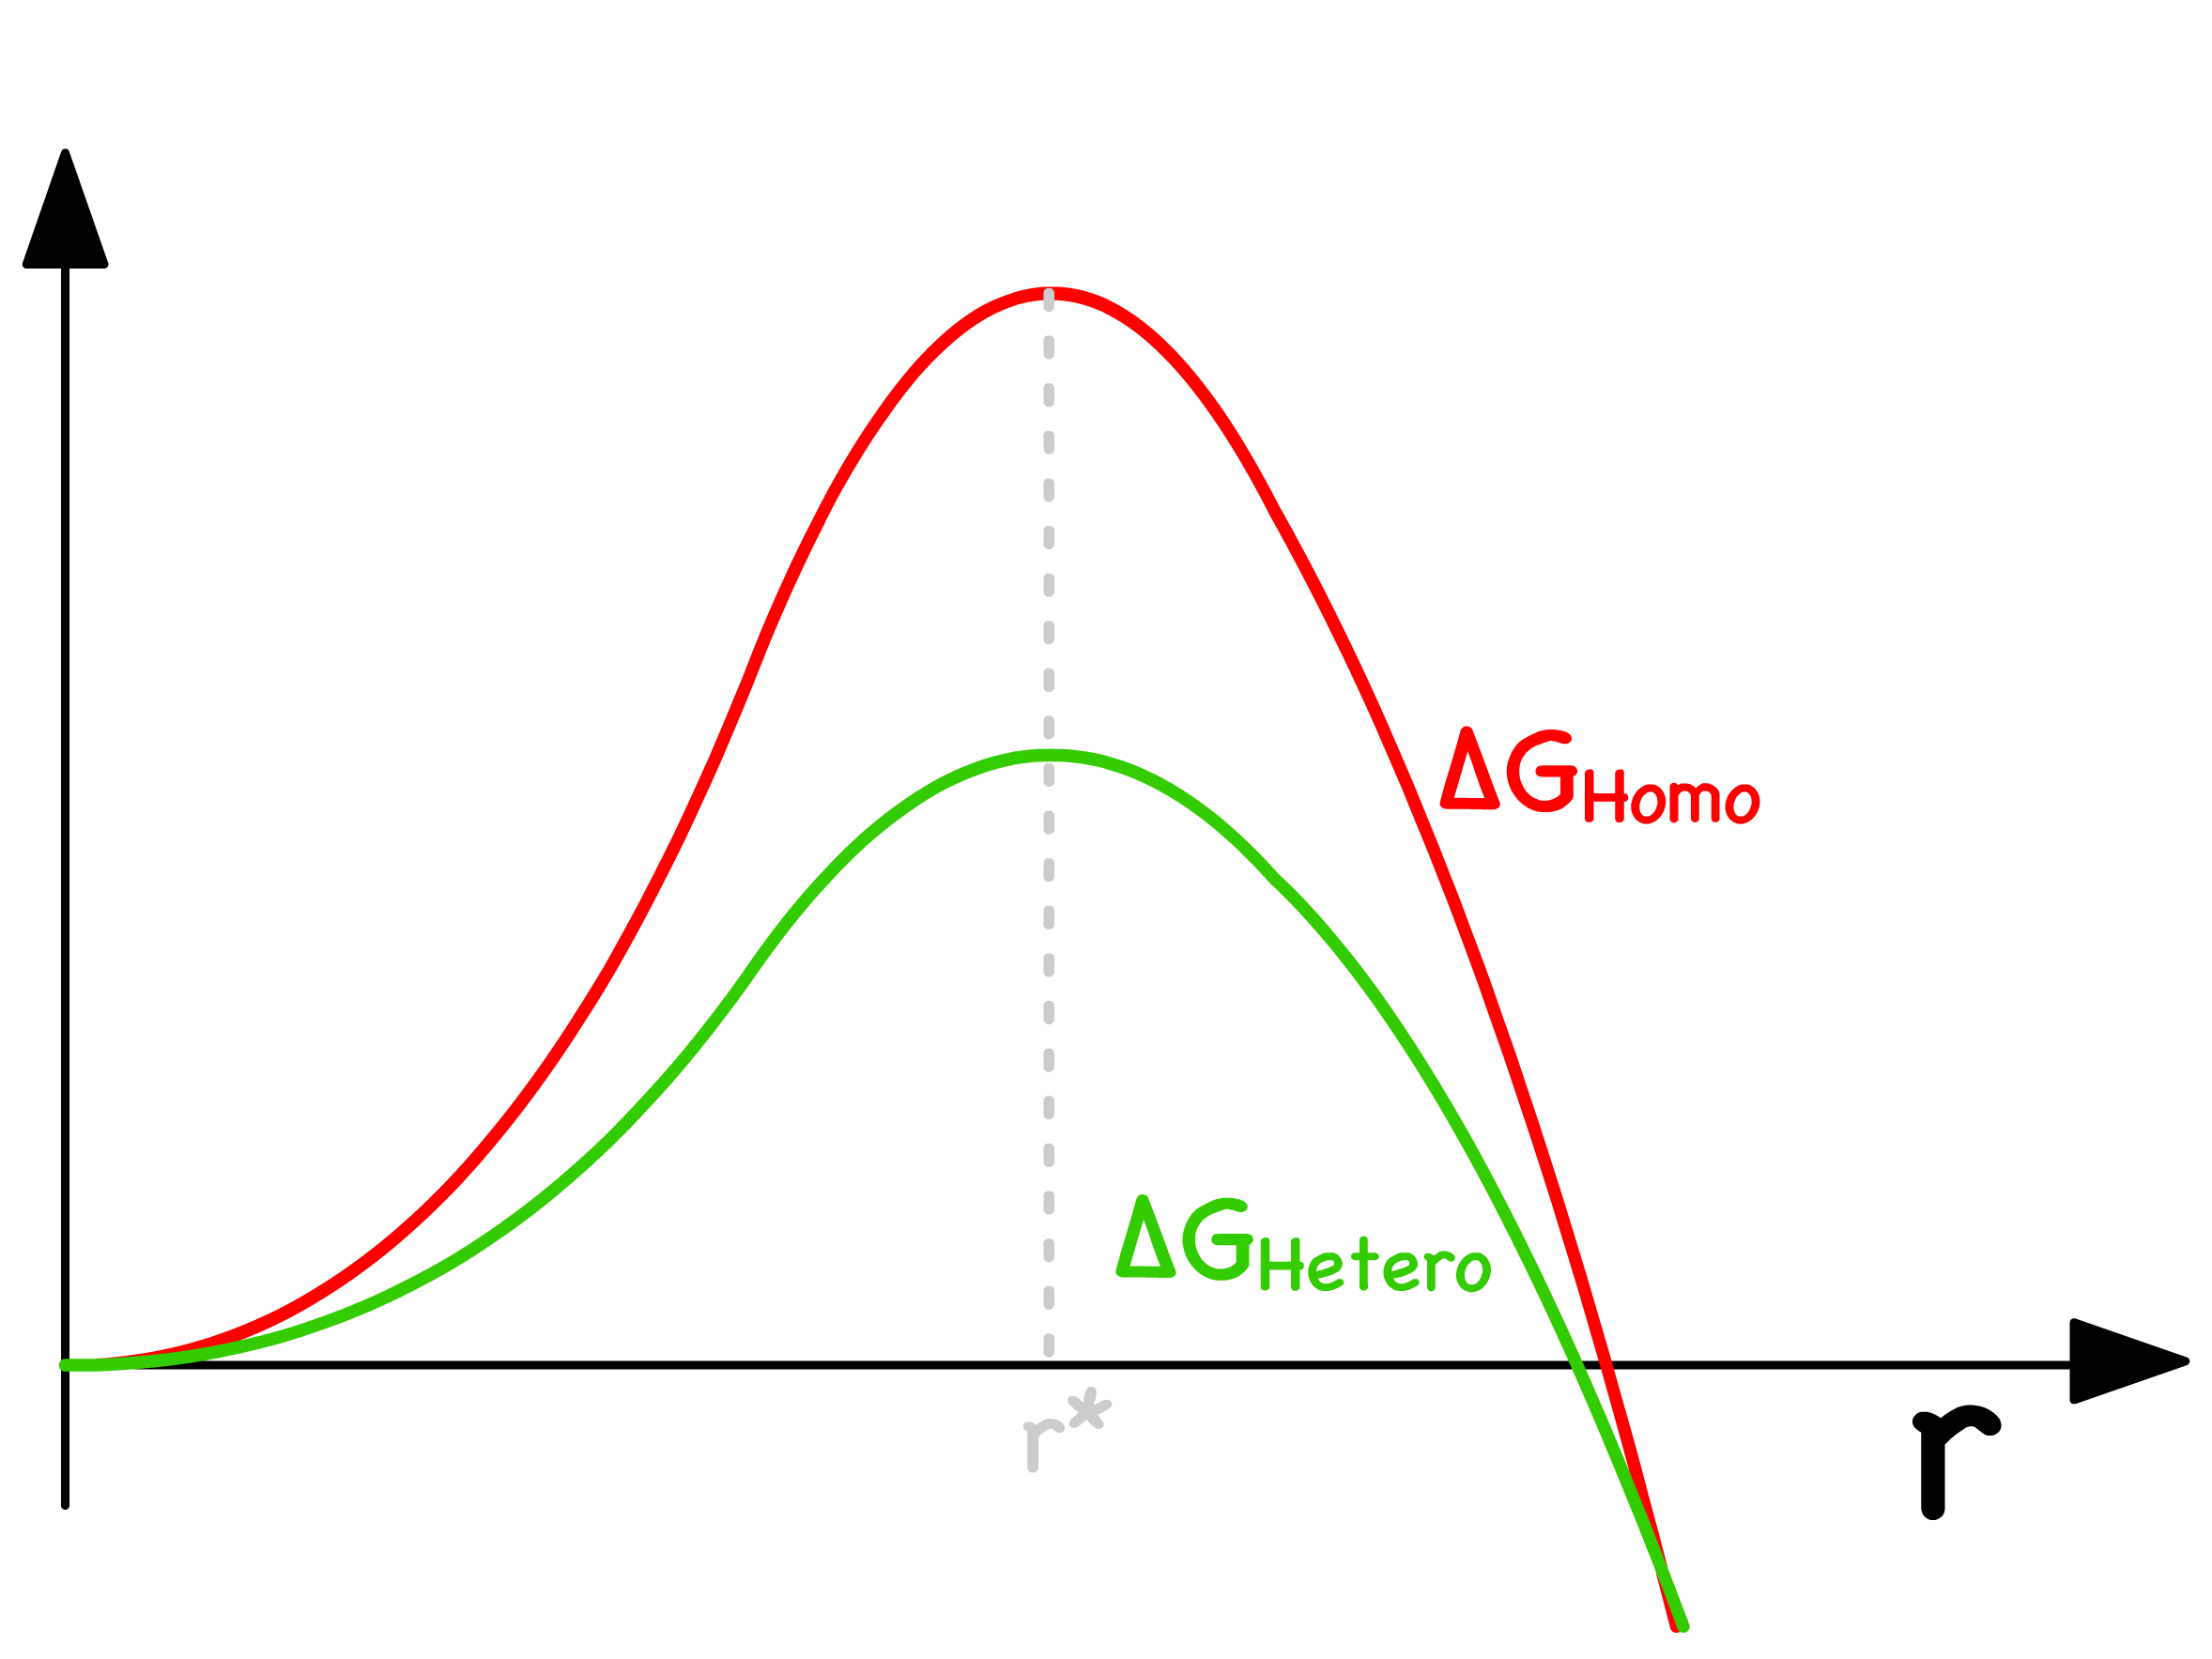
Assuming the solid nucleus has a spherical cap, we can derive the critical radius and the associated activation energy
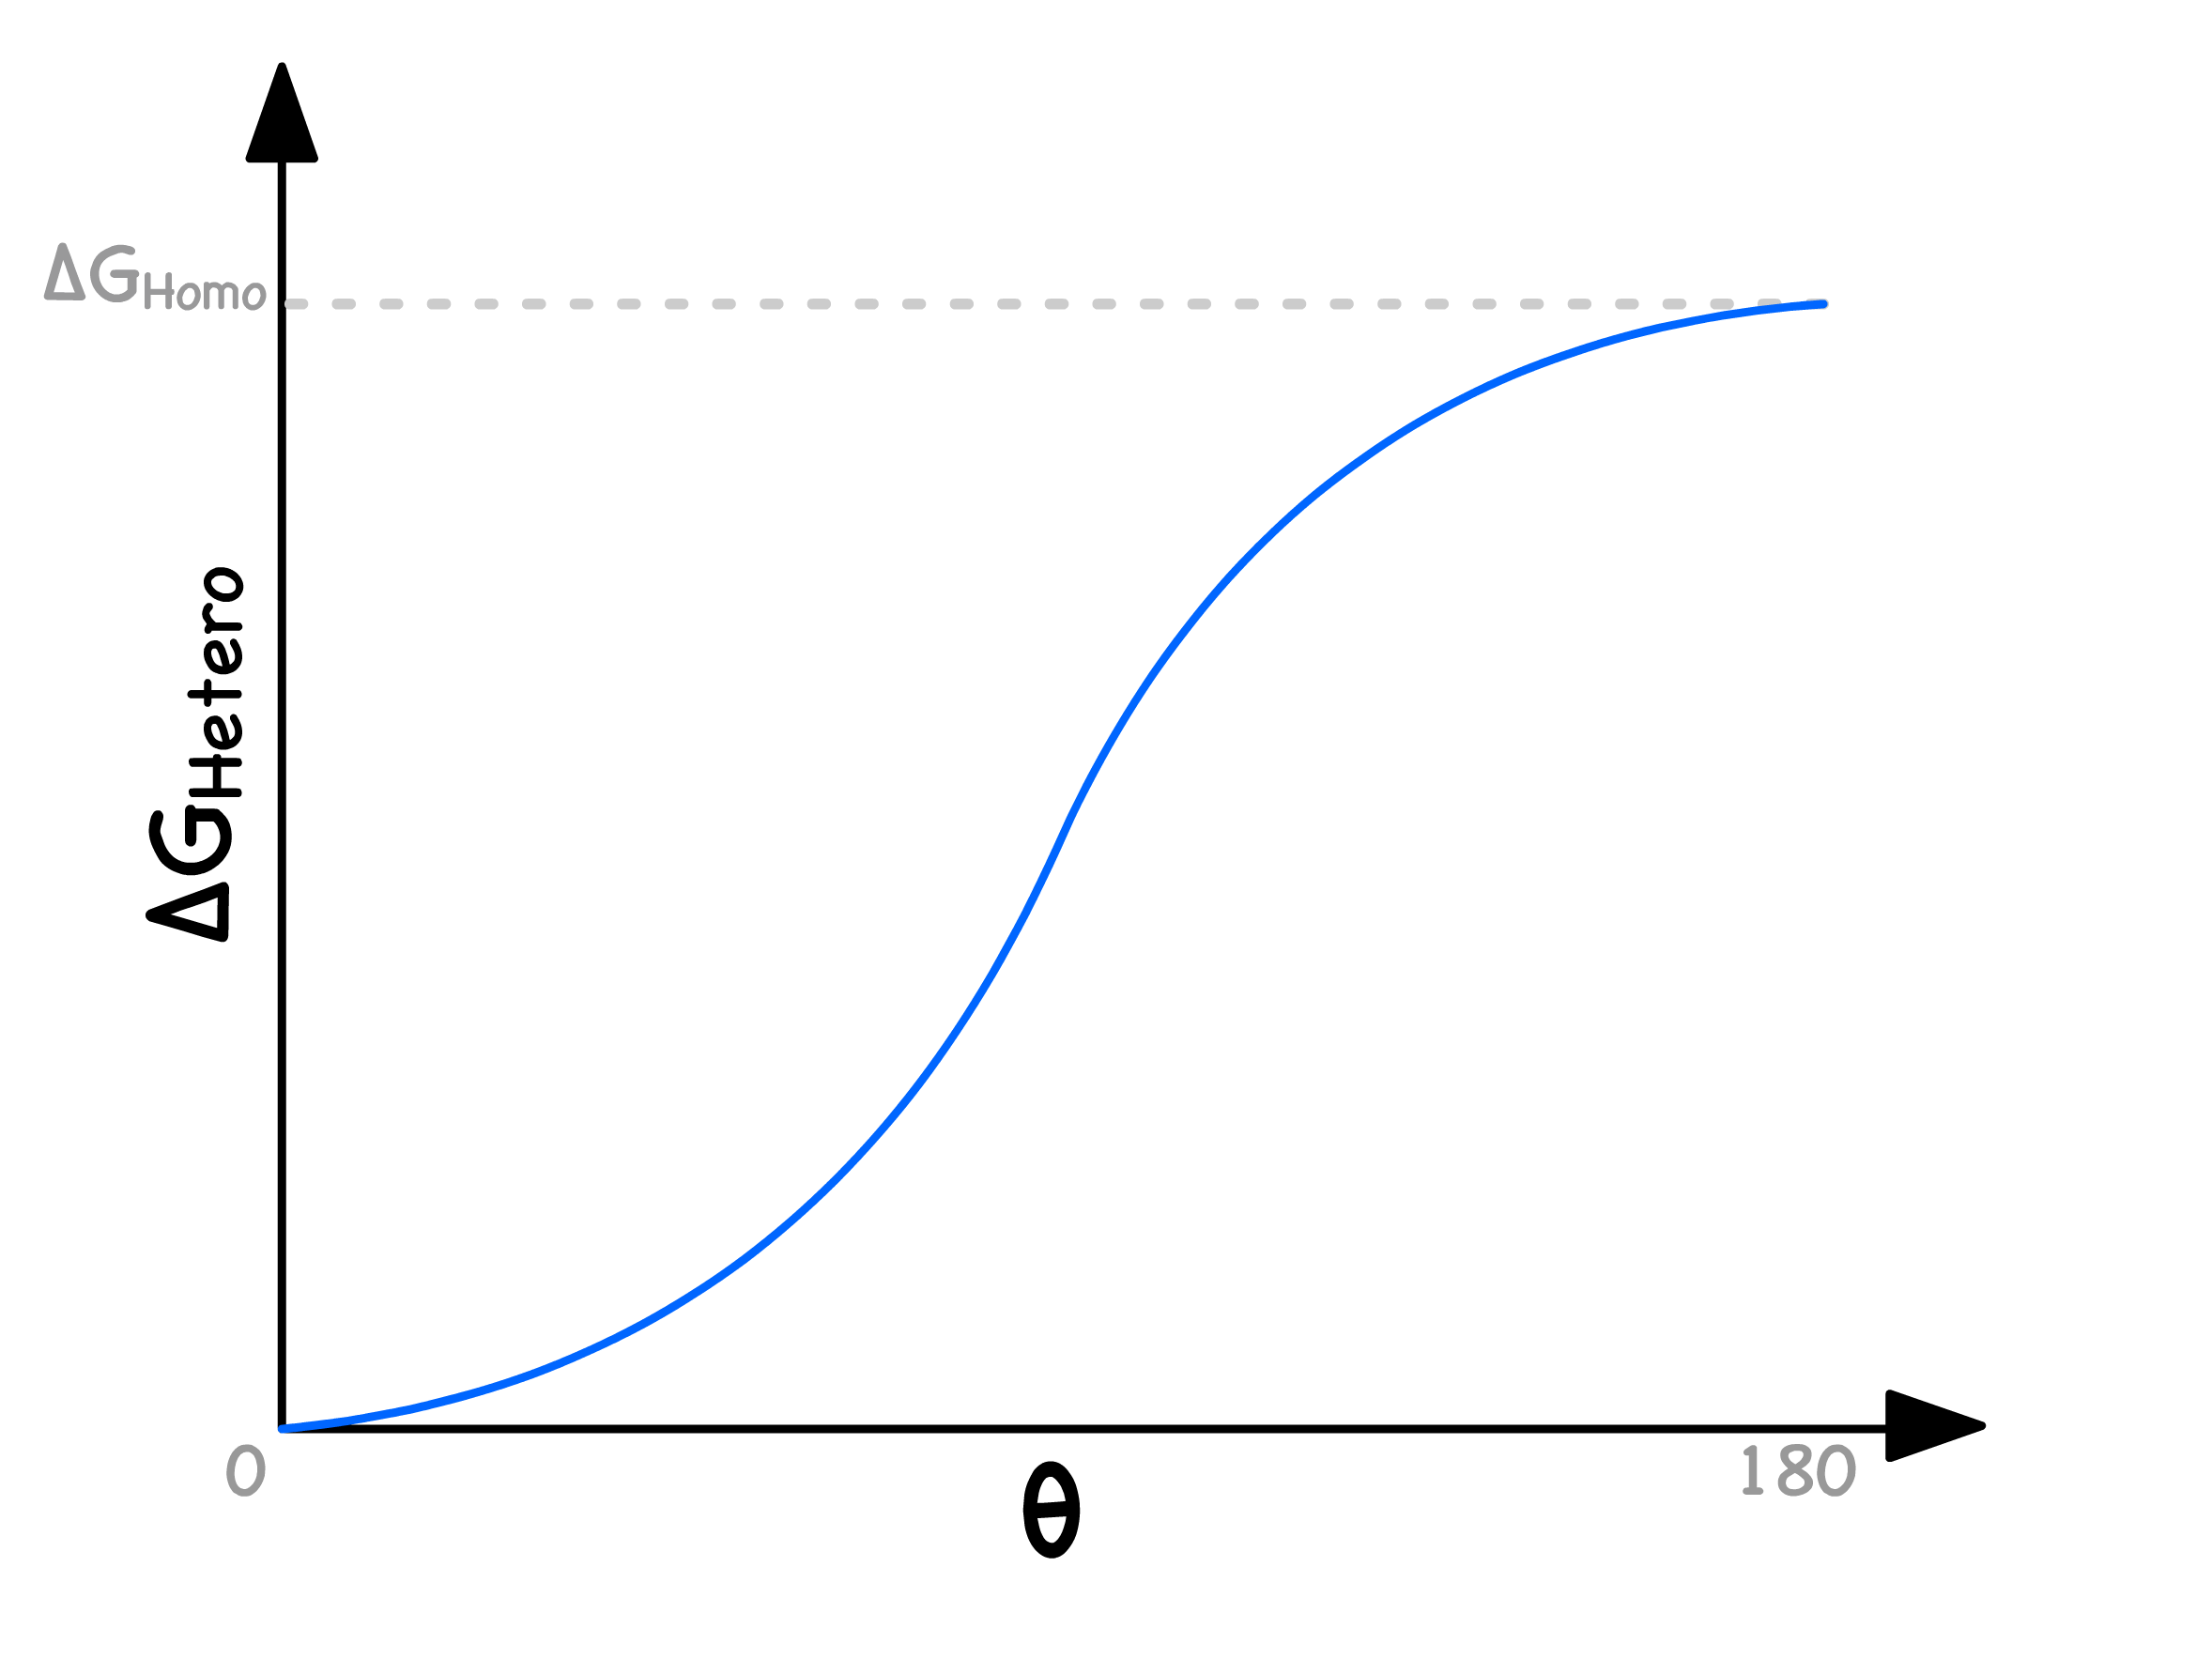
- When we plot it out, we will realize that both the homogeneous and heterogeneous cases have the same critical radius, but the heterogeneous nucleation has a lower activation energy
How much lower the heterogeneous activation energy will be depends entirely on the contact angle
- In general, the more "wettable" the mould is, the lower the activation energy
¶ Glasses
Glasses are materials that are identical in their state of order with liquids, but behaves mechanically like a solid
- This means glasses have short-range order but no-long range order like liquids, but have a shear modulus like solids
- In other words, glasses have a finite shear modulus but an effectively infinite viscosity
It is however not accurate to claim that glass is just a liquid with a very large viscosity
- Possessing a non-zero shear modulus is a qualitative change of properties
- This means that transition between liquid and glass is a thermodynamic transition, albeit a special one
¶ The Glass-Transition
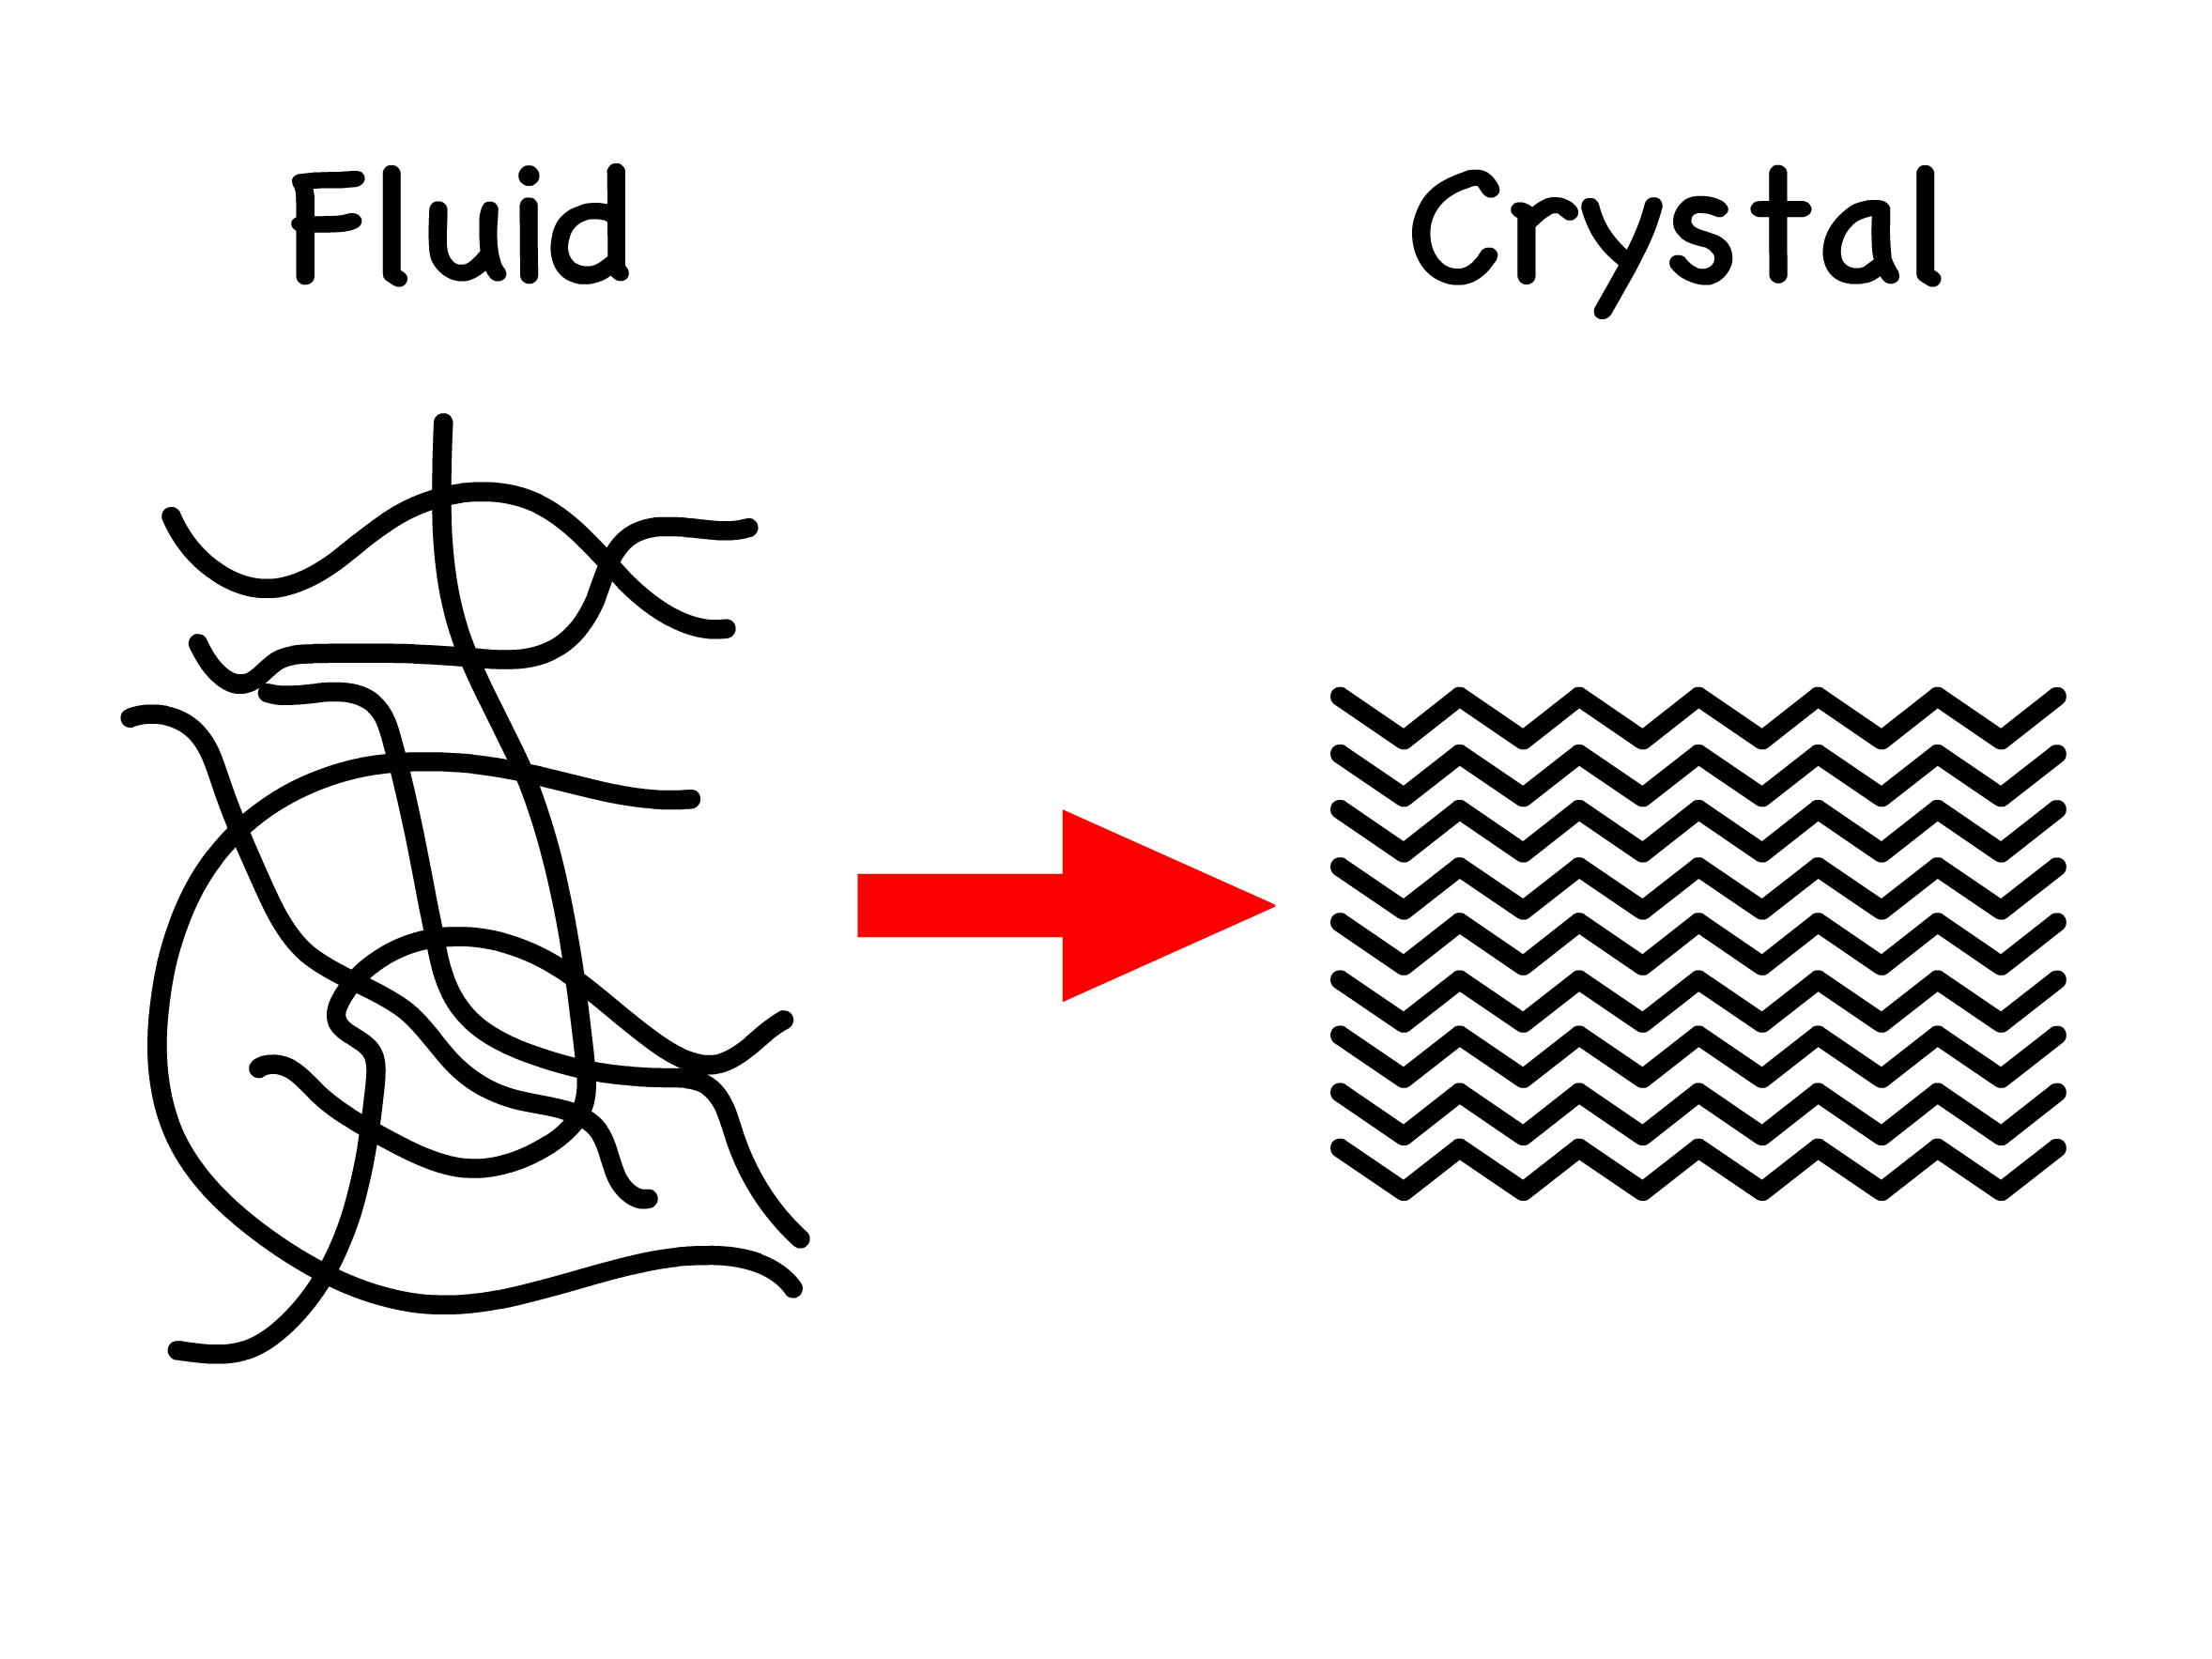
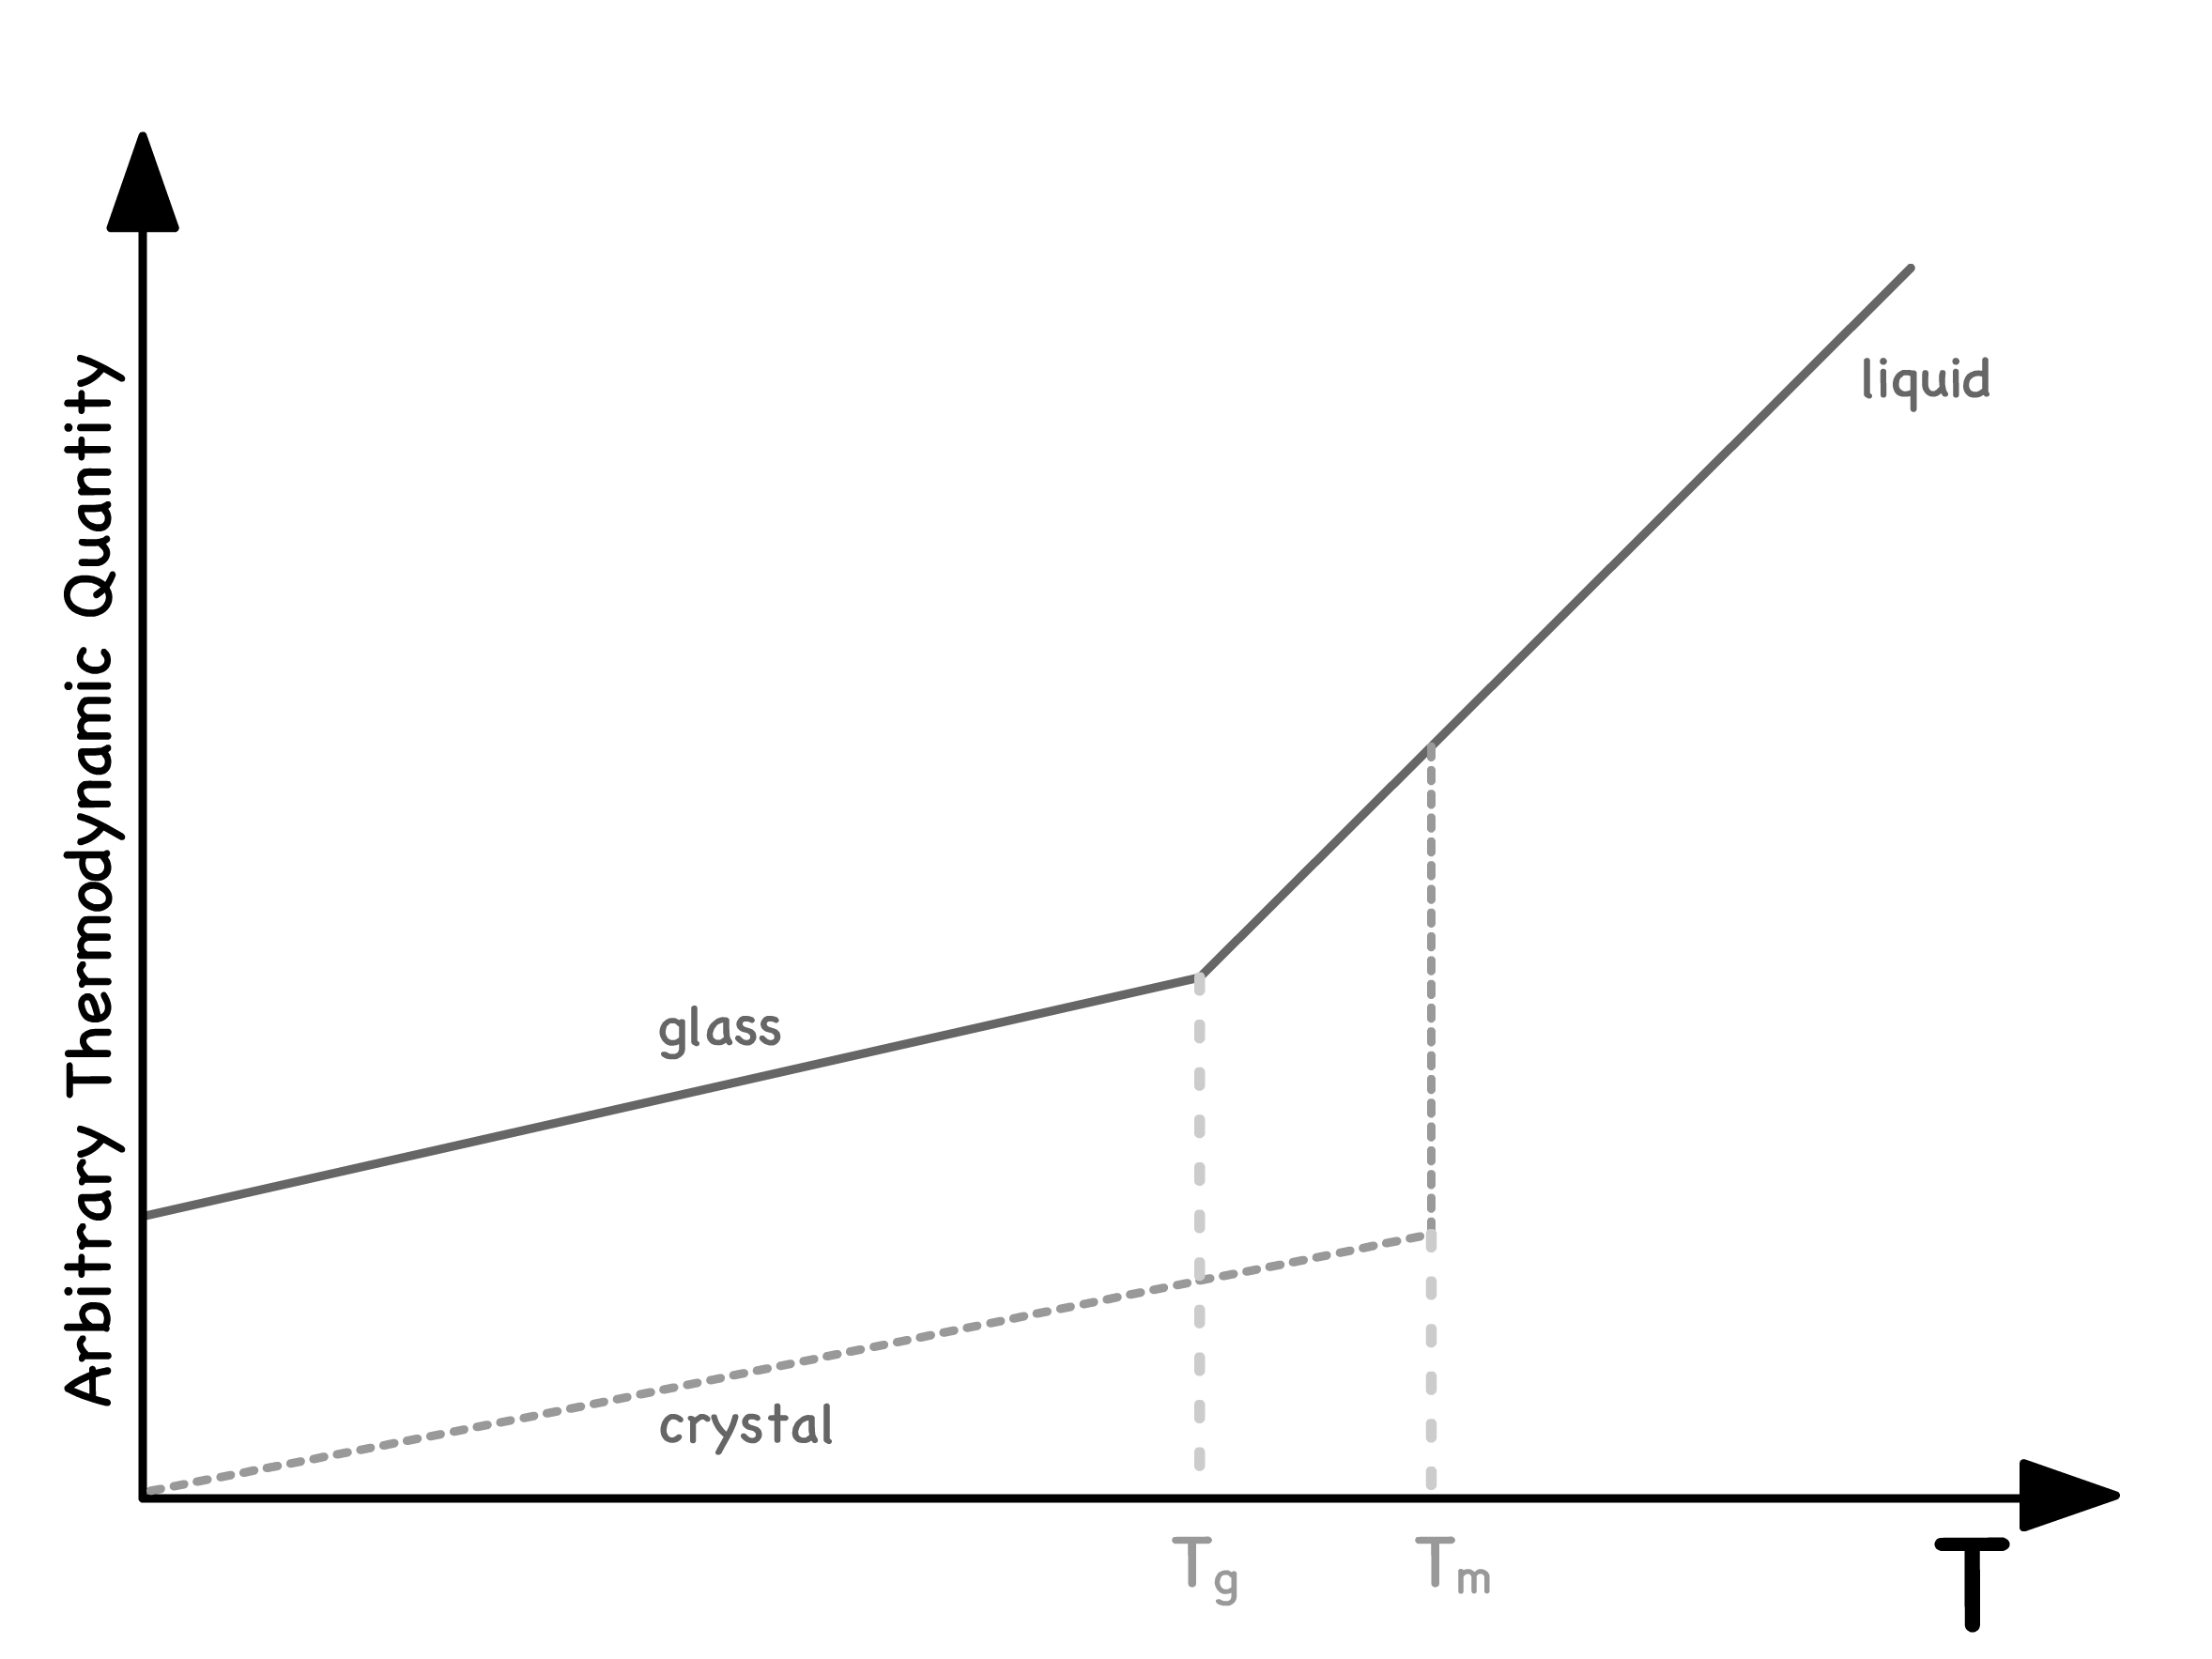
When a liquid is cooled, a phase transition is inevitable
- Intuitively, one might expect the disordered liquid to transform into a well-ordered crystalline material
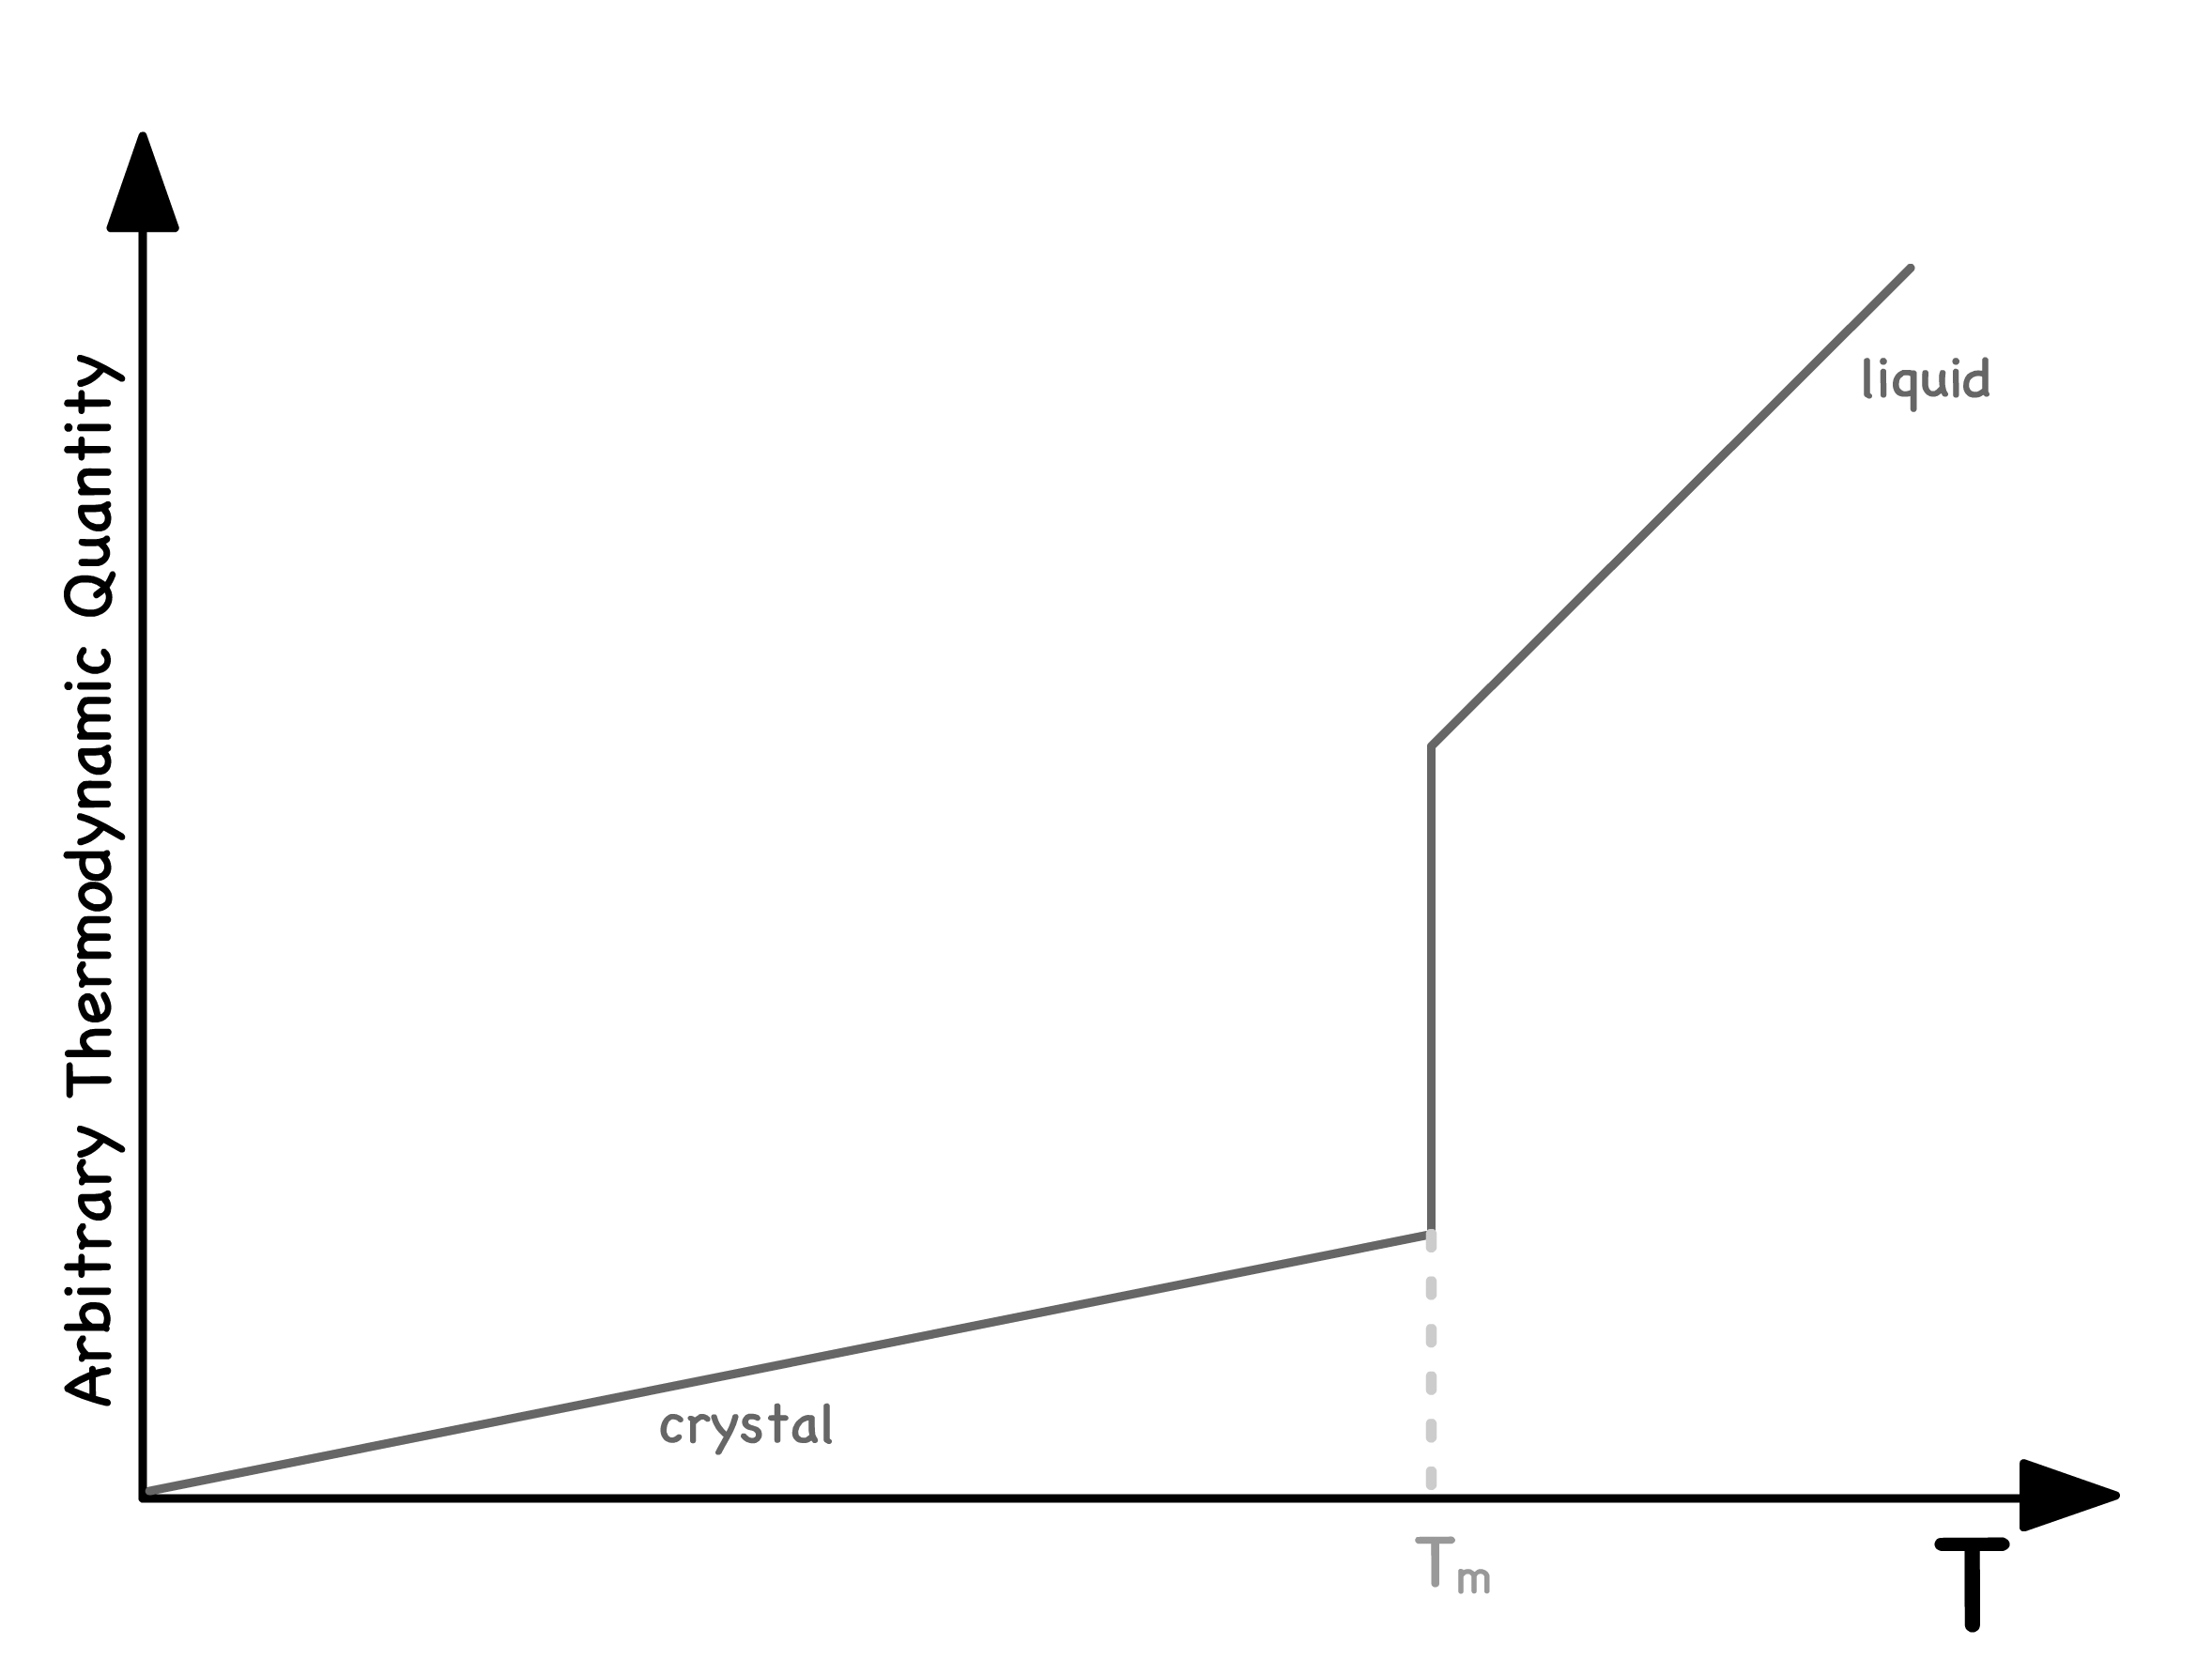
- This transformation is characterized by a sharp and discontinuous change in certain thermodynamic quantities. The temperature at which such a process occurs is called the melting temperature
- This happens because the crystal phase has a qualitatively different degree of symmetry to the liquid
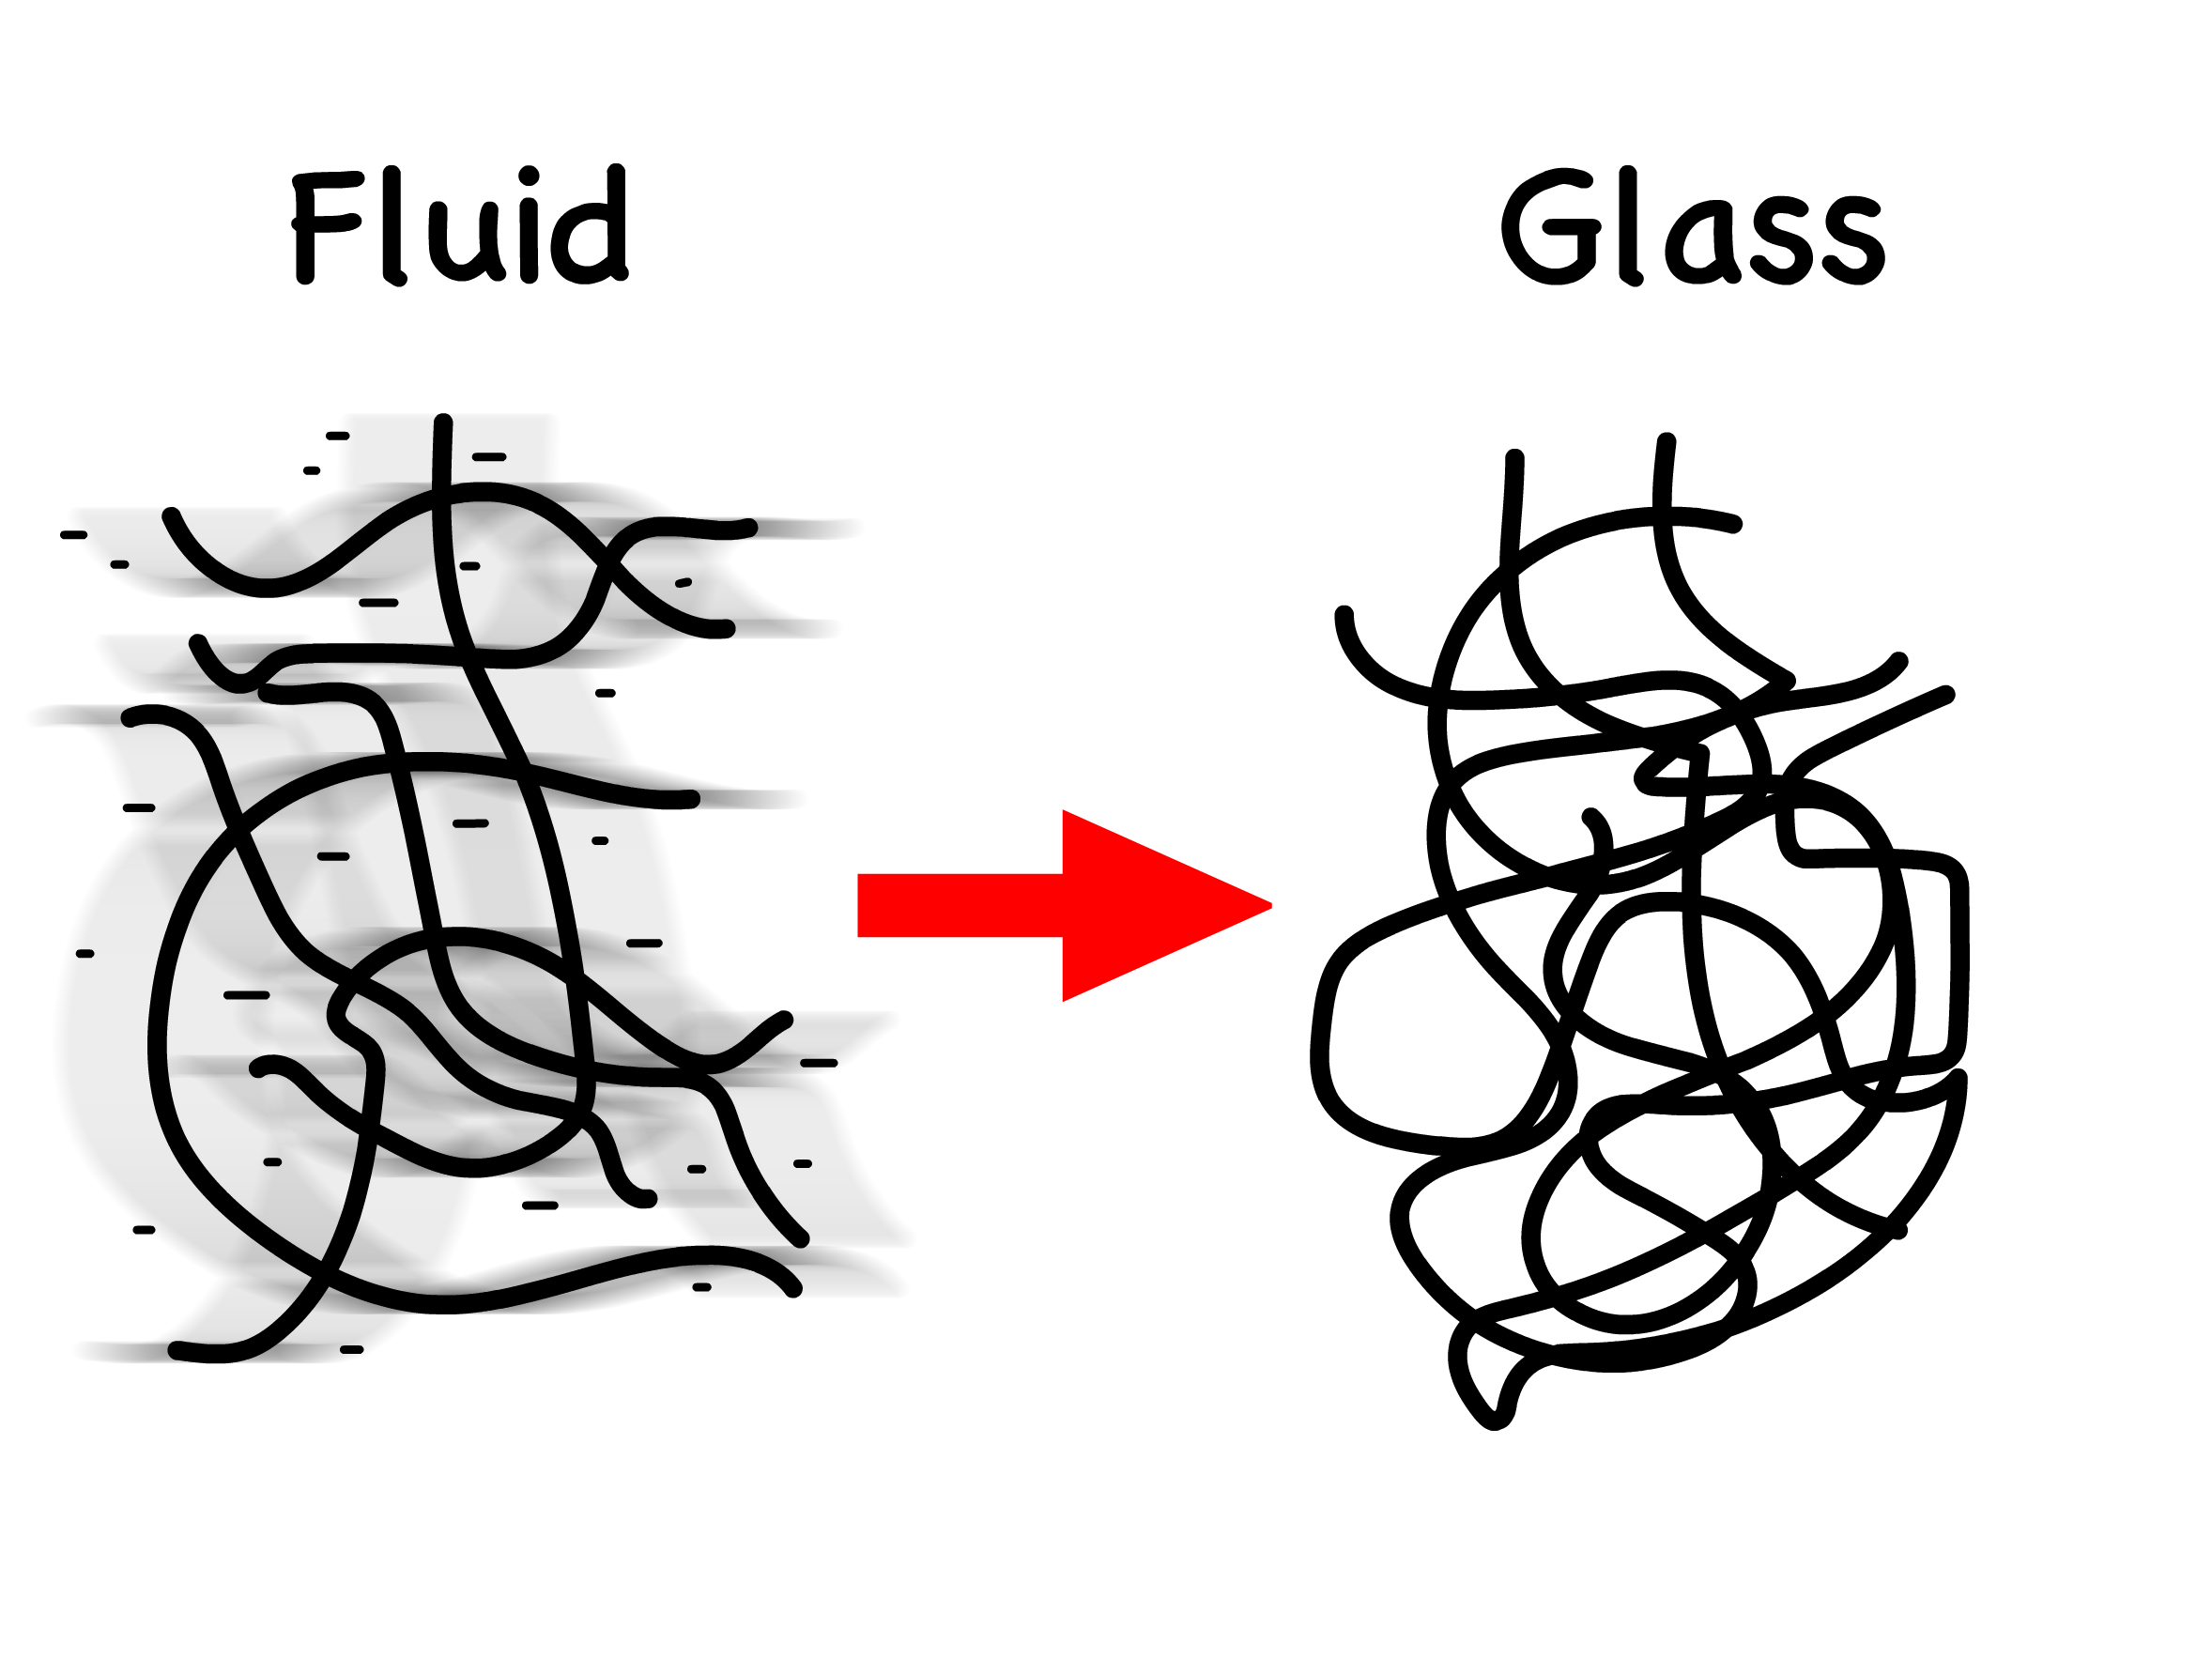
However, there are scenarios where the liquid fails to form a crystal at , either due to an excessively fast cooling rate or inherent material properties preventing crystallization
- In such cases, the liquid undergoes a transition without acquiring a more orderly structure
- This transition, marked by a sharp change in thermodynamic properties, is no longer discontinuous
- The temperature associated with such a change is called the glass transition temperature,
Mechanism of Glass Transition
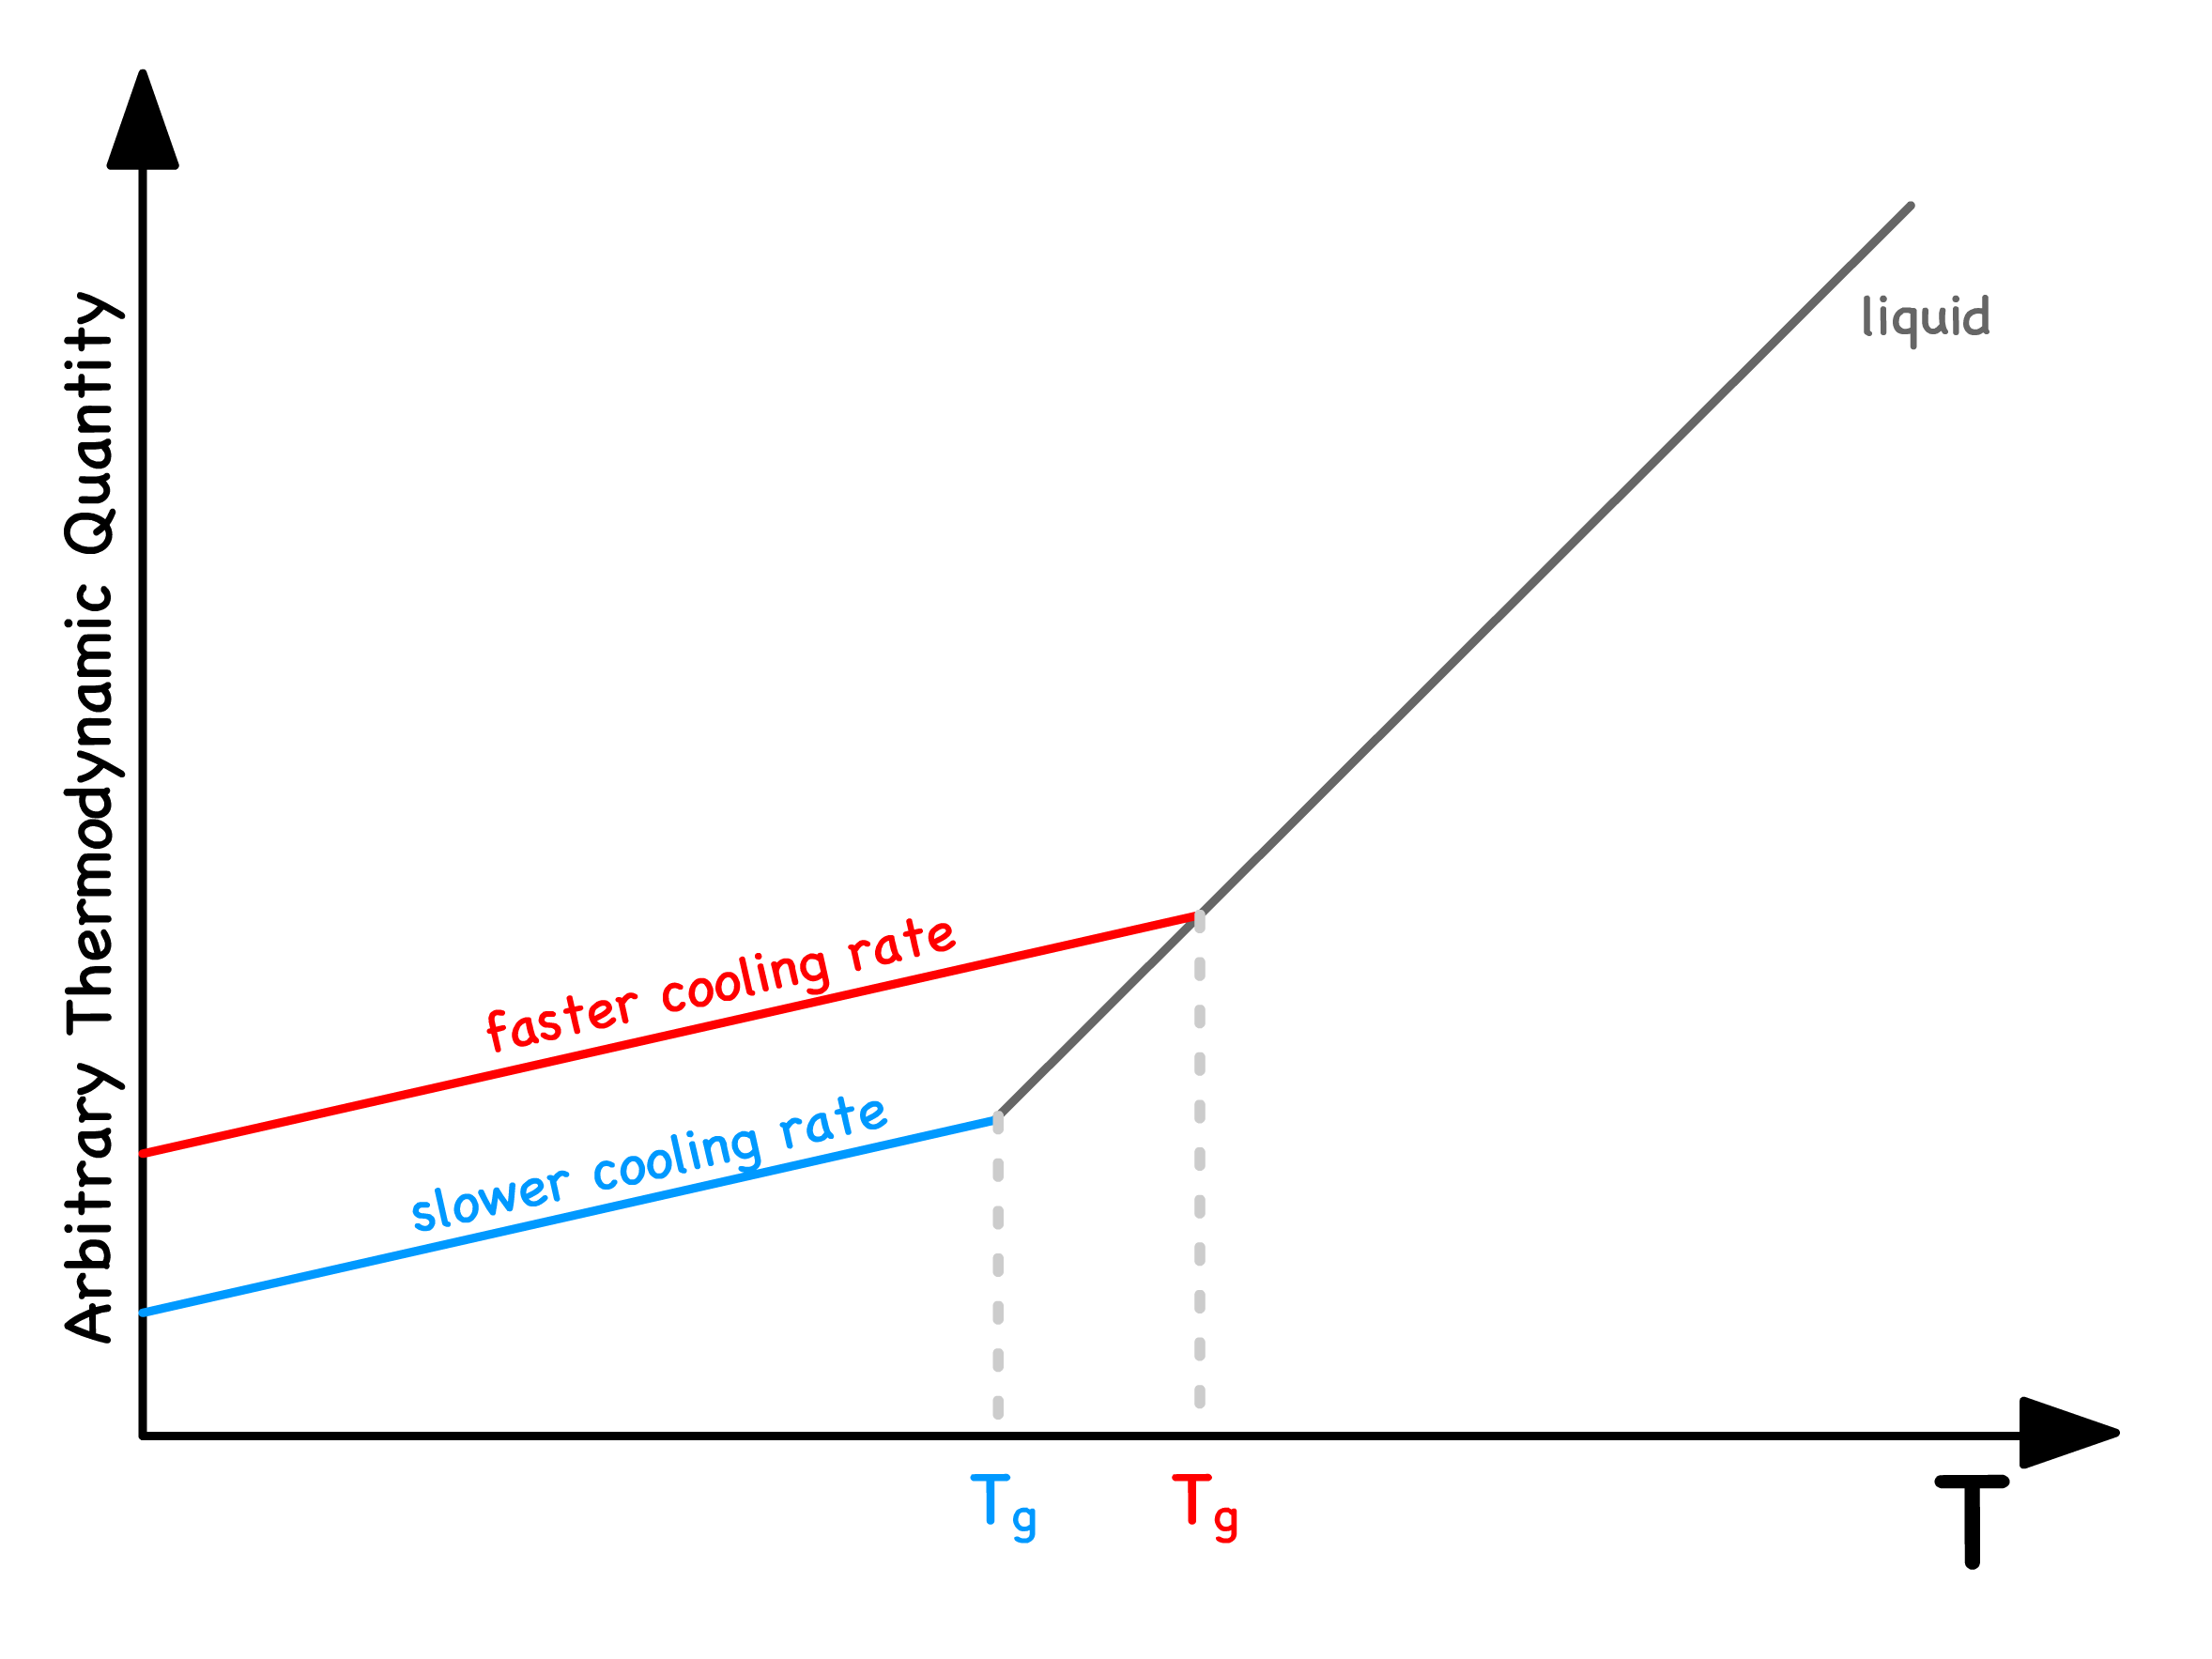
The occurrence of glass transition hinges on the relative timescale of cooling
- When the cooling timescale aligns with the timescale of molecular rearrangement, the translational motion of molecules fails to reach equilibrium, leading to the observation of a glass transition
- This lack of equilibrium in translational motion leads to the observation of a glass transition
It turns out that unlike the melting temperature, is not a characteristic property inherent to the material itself
- By gradually cooling the system, we decrease the cooling timescale, allowing us to reach a lower temperature before the cooling timescale aligns with the timescale of molecular rearrangement
- In other words, a lower cooling rate will result in a lower
Entropy and Glass Transition
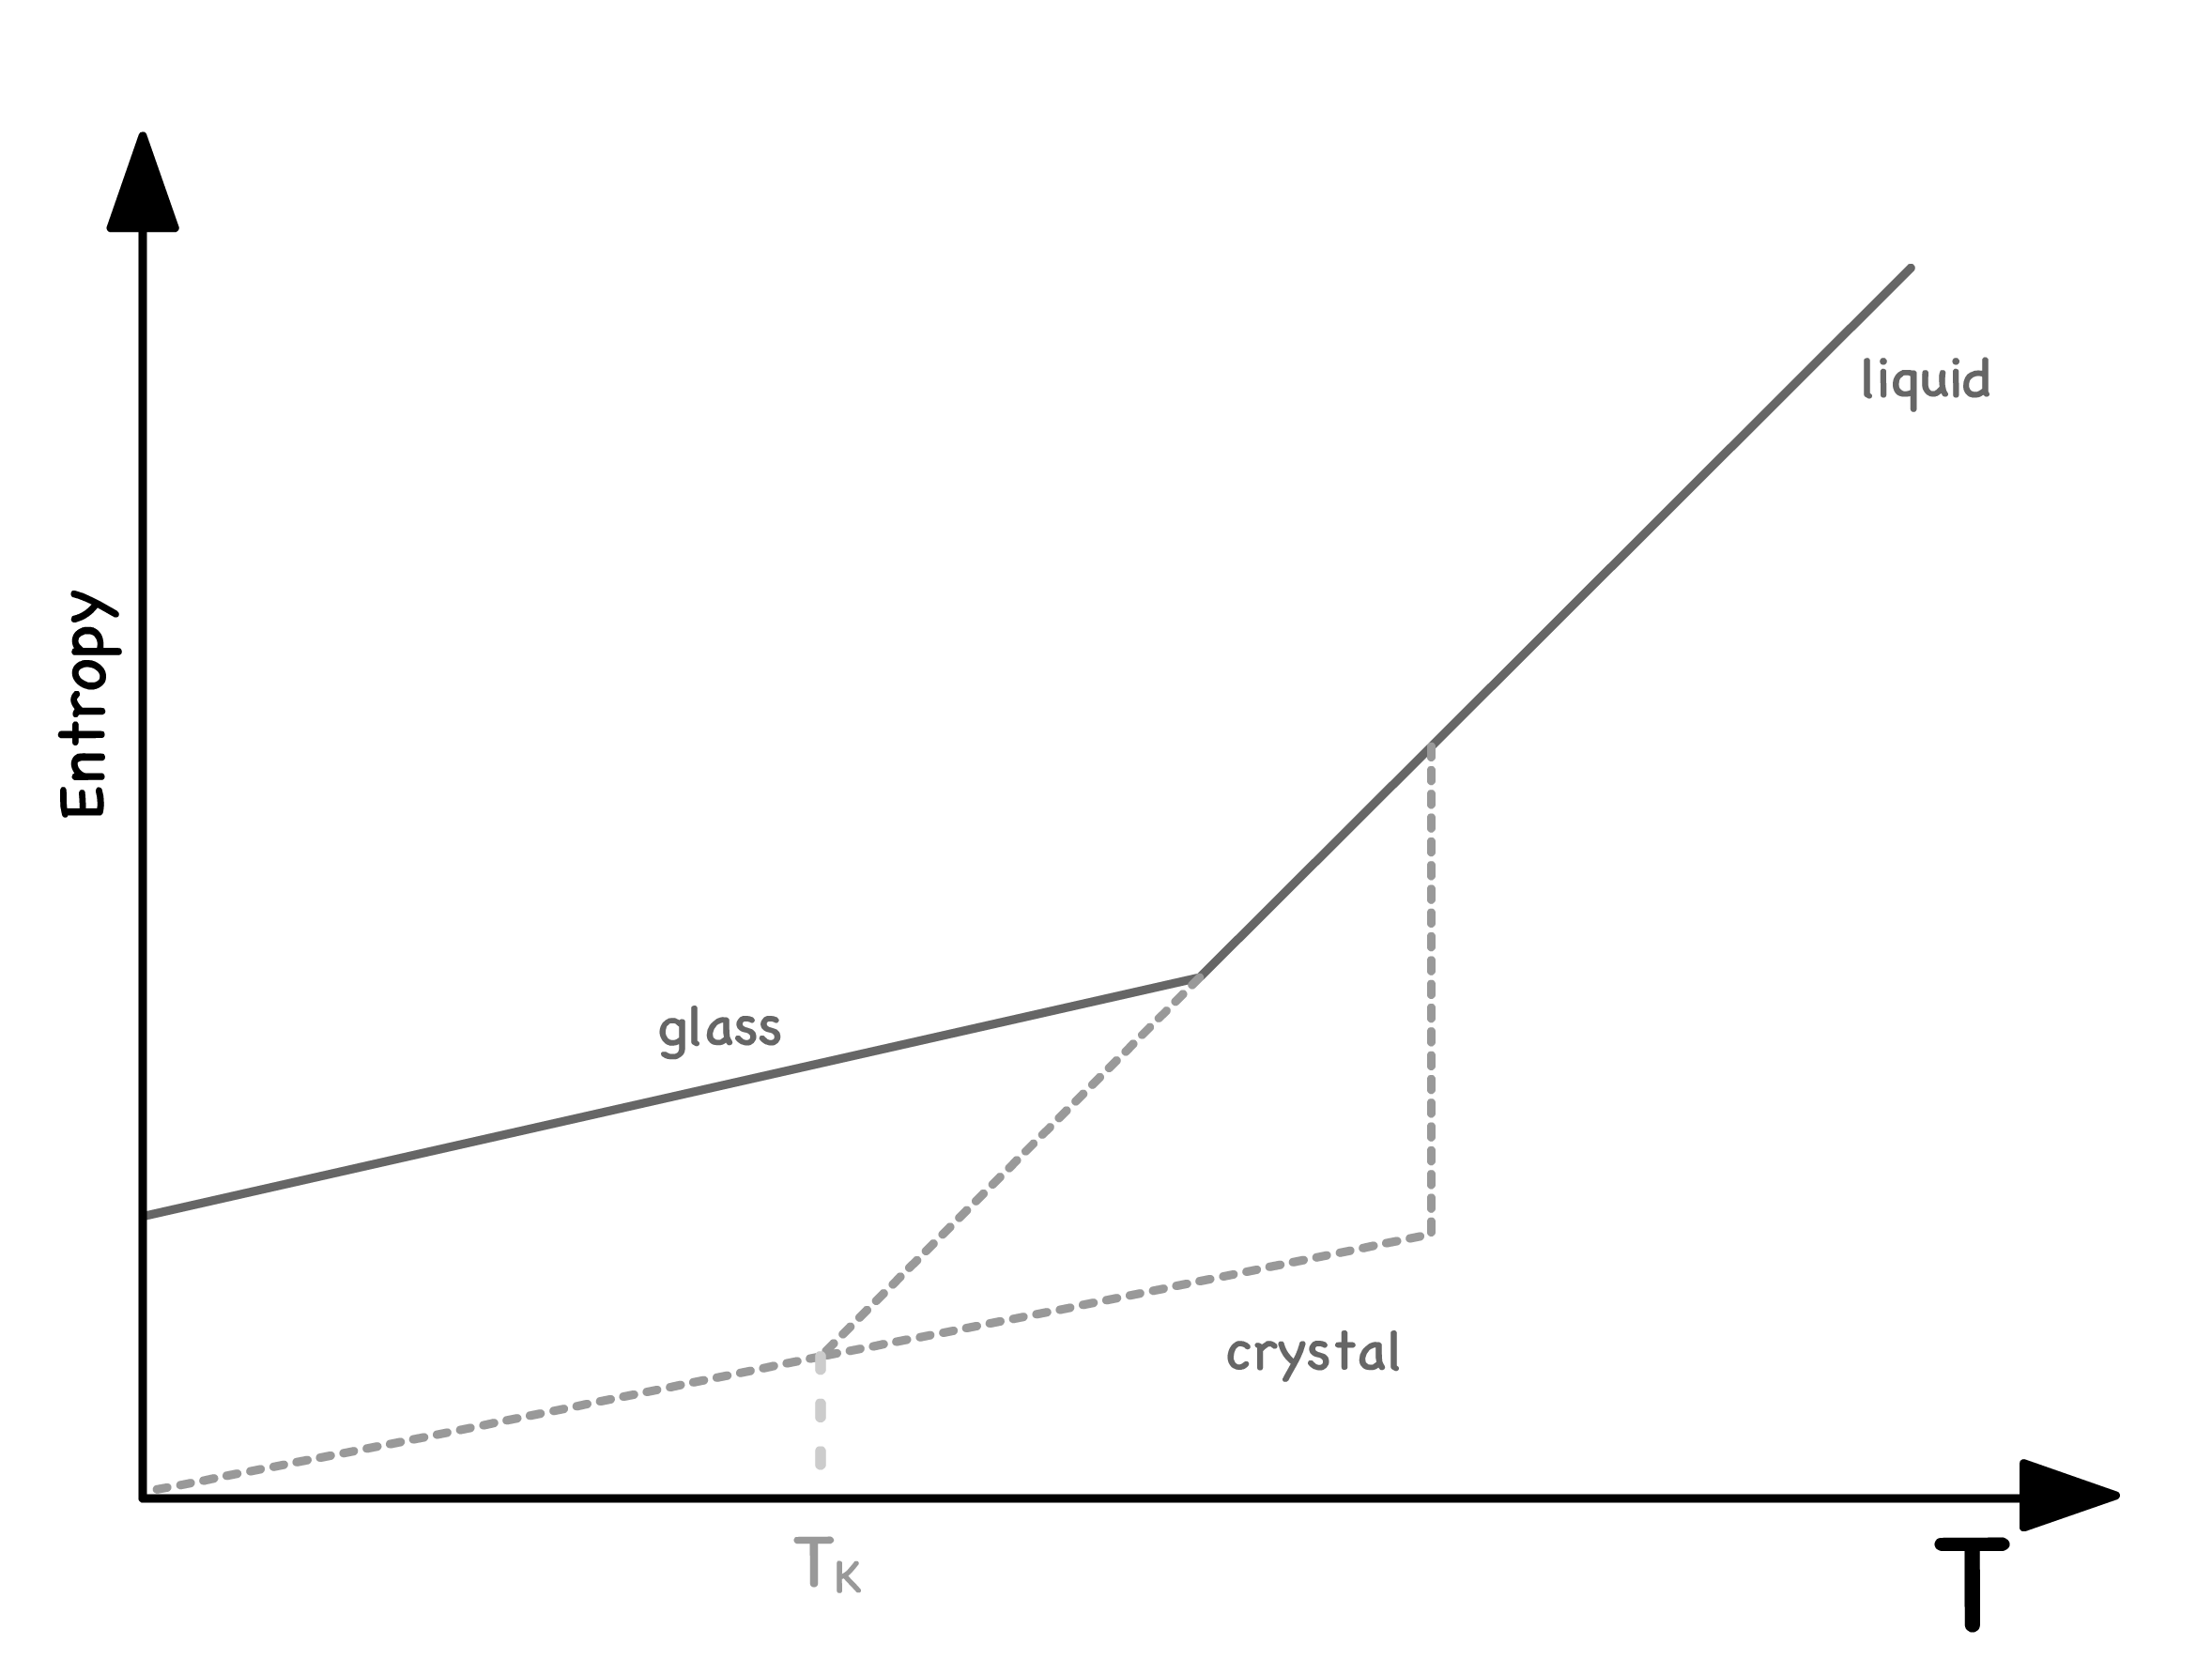
The entropy-temperature relationship in glass-forming liquids reveals several intriguing features
- Upon extrapolation to absolute zero, the entropy of glass remains finite
- The glass thus has a certain residual entropy assocaited with its configurational disorder
- The entropy of glass is not a pure thermodynamic function of state
- This is because it not only depends on the current properties of the glass but also on the sample's history
- TIn the glassy state, the system cannot explore all possible statistical mechanical microstates on an experimental timescale, a phenomenon known as broken ergodicity
- There exists a lower limit to the glass transition temperature
- If we envision an experiment with progressively reduced cooling rates, we anticipate lower and lower measured
- However, there must be a point where the entropy curve for the supercooled liquid intersects with the entropy curve of the crystalline solid
- This intersection, denoted as the Kauzmann temperature , serves as an effective lower limit on the glass transition temperature, as it is physically impossible for glass to have lower entropy than crystalse
¶ Strong and Fragile Glasses
Recall that we are able to model viscosity using the Arrhenius equation
- The assumption made is that confined particles can break free from its confinement through a thermally activated jump to a lower-energy location
- This equation works for most liquids and strong glass
For fragile glasses, we have to modify the equation slightly to the Vogel-Fulcher-Tammann equation
- is the Vogel-Fulcher temperature ( ) , which is the temperature at which the relaxation time would become infinite according to the equation
- The equation reflects the idea that the relaxation time of a glass-forming material diverges as the temperature approaches the Vogel-Fulcher temperature
- This is because activation energy increases with decreasing temperature, due to co-operative rearrangement
¶ Colloidal Dispersions
A colloidal dispersion is a homogeneous system in which particles of solid or droplets of liquids with dimensions of order of to
- Such dispersions are characterized by an extremely high area of interface
- Colloids are large enough to approach bulk properties but small enough that thermal energy can counteract gravity to induce Brownian motion
¶ Brownian Motion and The Mean Square Displacement
To quantify Brownian motion, mean square displacement serves as a useful concept
- In Brownian motion, particles exhibit characteristics of a random walk, with successive steps having uncorrelated directions
- Simply taking the mean value of total displacement yields zero due to the absence of net movement in the long run
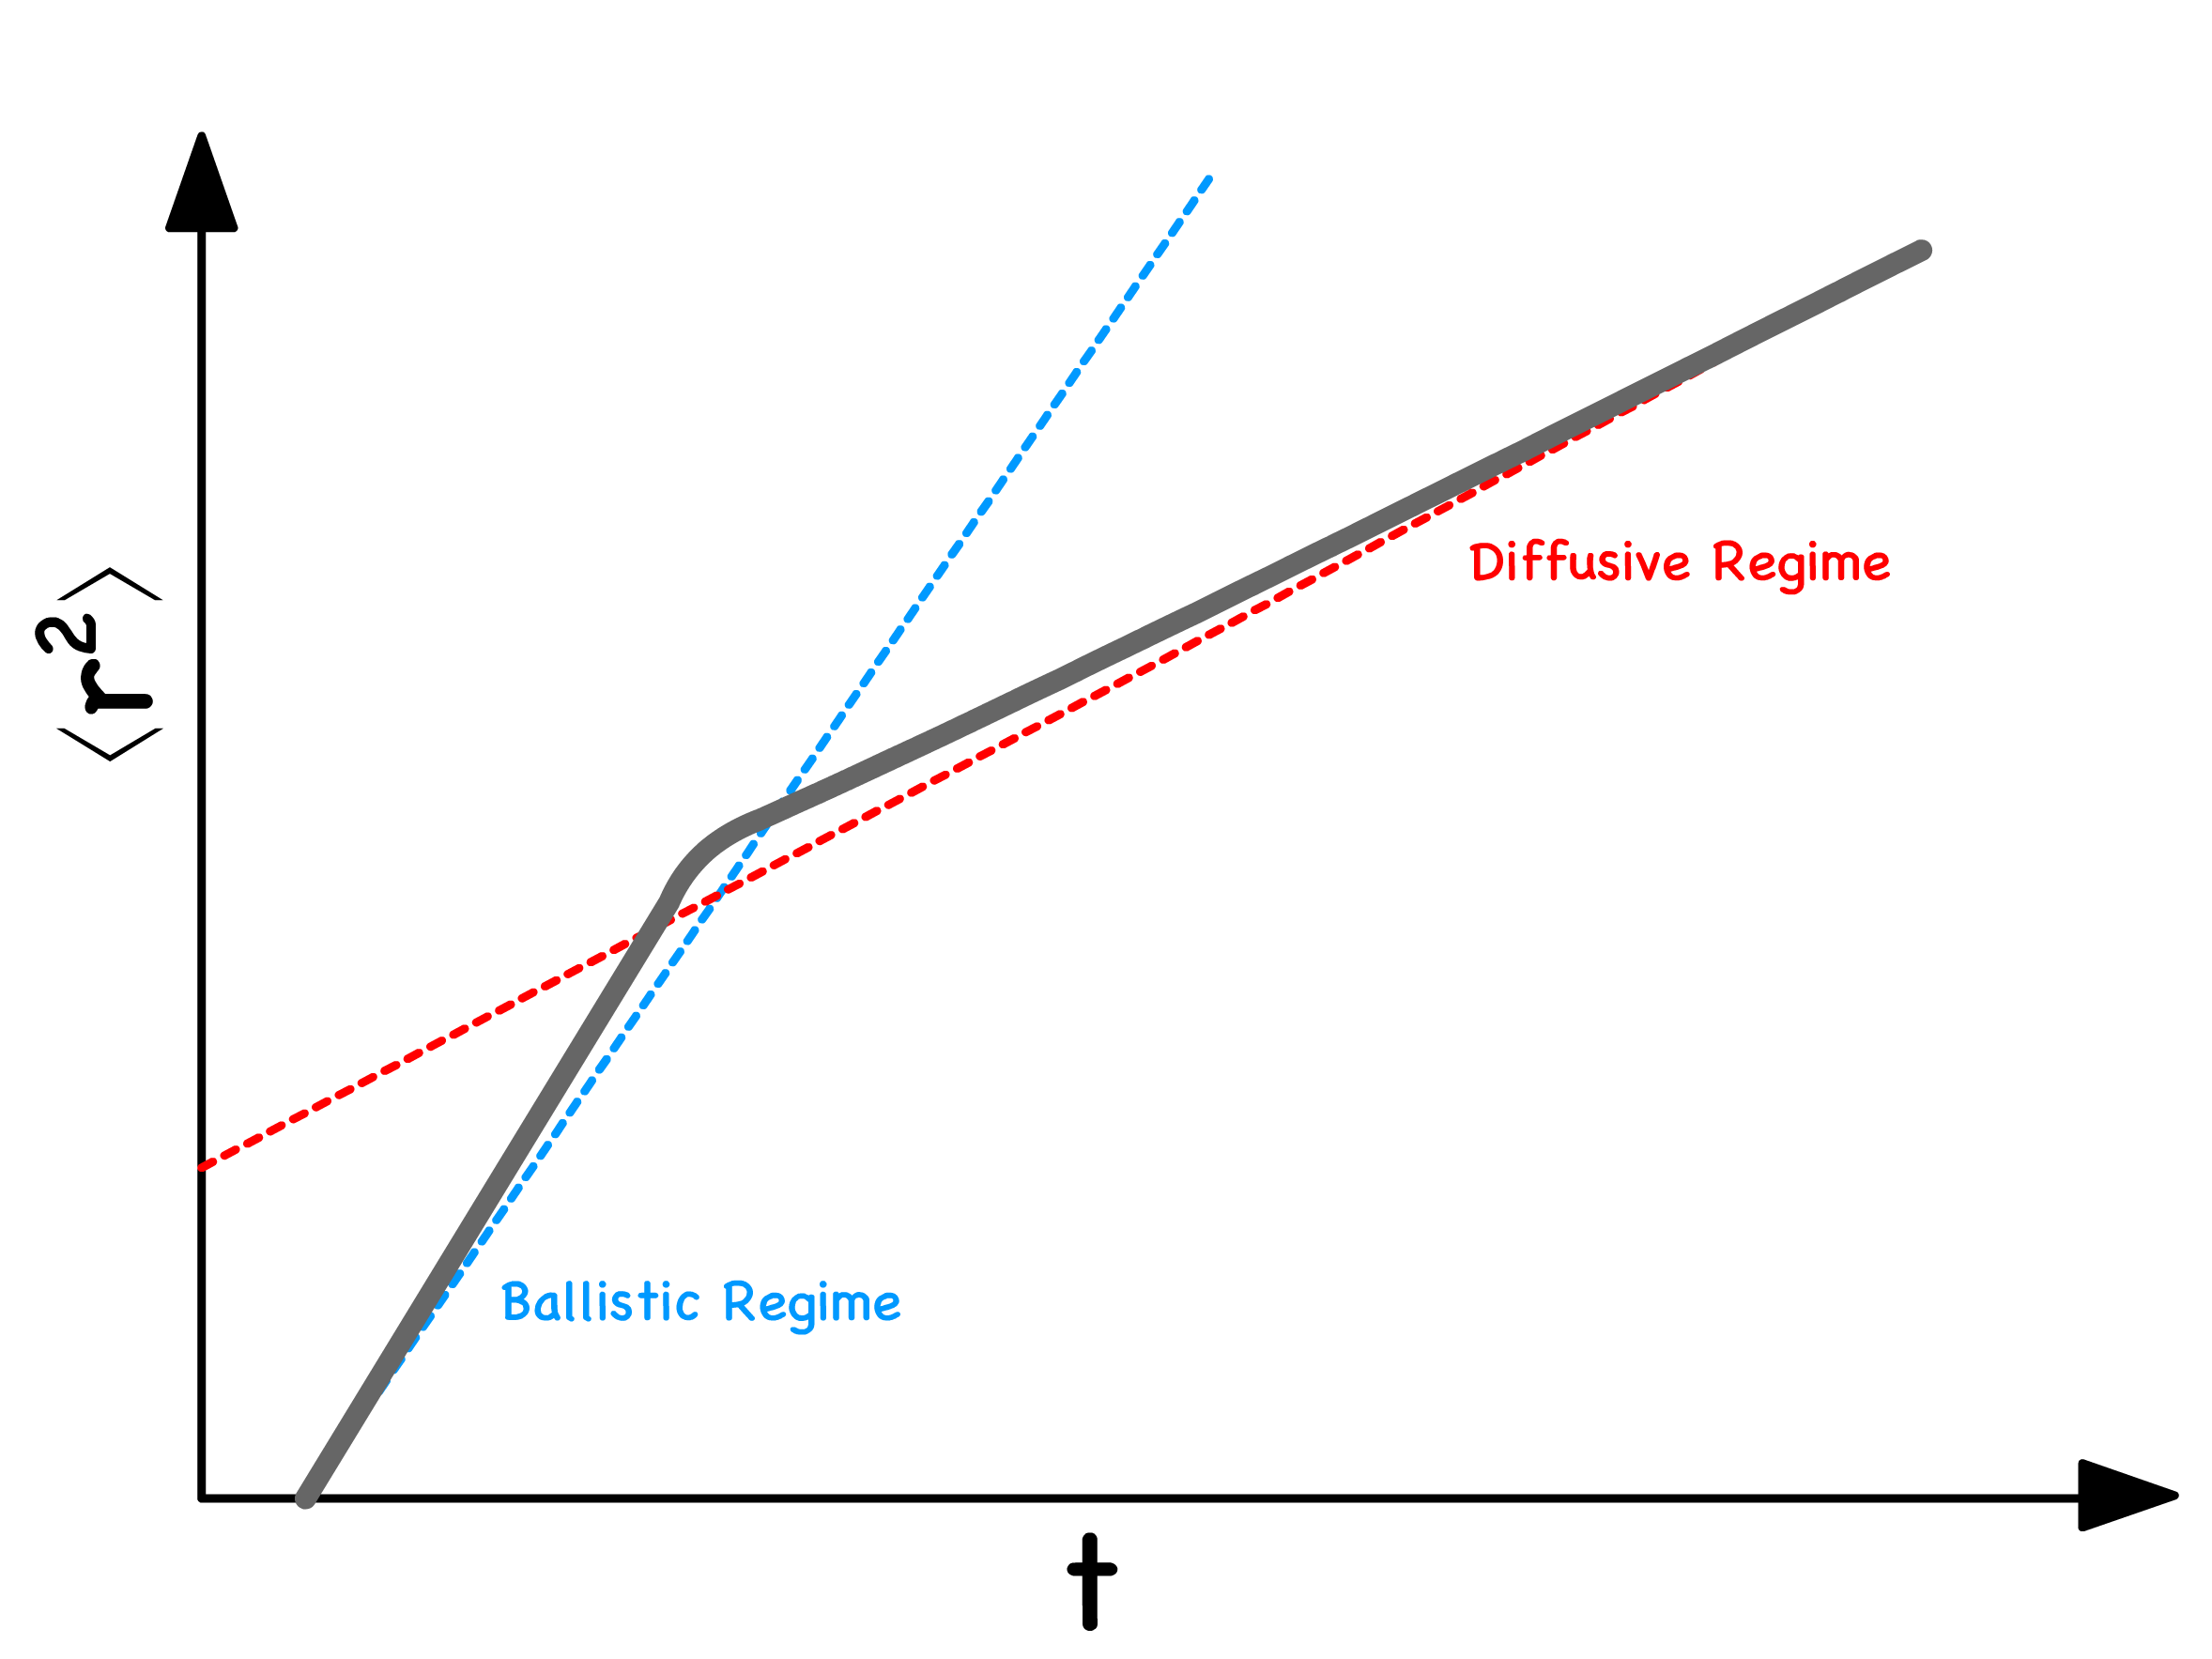
- However, considering the mean value of the square of the displacement, denoted as , is proportional to the number of steps taken
The mean square displacement of Brownian motion can be divided into two regimes
In the diffusive regime :
- where represents the number of dimensions considered, is the diffusion coefficient, and is the time
- The Diffusion coefficient is given by the Stoke-Einstein equation D= \frac{k_BT}
In the ballistic regime :
- Ballistic behavior can be predicted using simple kinematic equations, and the mean square velocity can be estimated in line with the equipartition theorem
- Where , is the mass of colloid
Peclet Number
We can measure whether the motion of colloid particles is dominated by Brownian (thermal) motion using the Peclet number
- is the shear rate
- The timescale of relaxation of a Newtonian fluid shows a viscous response, a non-Newtonian fluid shows a non-Newtonian response due to shear thickening/thinning effects
- At small Peclet numbers, the response is visocous (constant viscosity), at we see non-Newtonian effects (shear thickening (colloid 'clusters' with higher energy dissipation, barrier for diffusion) and thinning (colloid 'bands' with concerted flow)) in the normalized viscosity (referencing the equilibrium viscosity)
- We can rewrite the Peclet Number using and to
- The Peclet number is dependent on the Reynolds number
¶ DLVO Theory
The DLVO Theory deals with colloidal interactions that are governed by the Van-der Waals forces and electrostatic forces
Van Der Waals Interactions
To proceed from a knowledge of the forces between two atoms to the total force between two macroscopic bodies, we need only to sum up the interactions between all pairs of atoms in each of the bodies
- The dispersion interaction between 2 atoms can be written as:
- The interaction between 2 colloids Colloids can be modelled similarly, as a function of the average separation between particles in each colloid, .
- Performing the integration gives us the Hamaker constant ( )
- Where is the dimensions of the colloid. In addition to colloid geometry, its solvent affects the interaction strength.
- When , the interaction is attractive
For different geometries, the VDW interactions between colloids takes different forms. Note that all expressions only apply at short separations where
- For two colloids of radius separated by
- For a colloid with radius , interacting with a solid surface separated by
- For two solid surface separated by
The Hamaker constant takes a different form in a dispersing solvent and the effective Hamaker constant can be written as
- Interactions between identical colloids are attractive
- The interactions between colloids of different compositions can be attractive or repulsive at smaller separations, this is influenced by solvent. At larger separations, the interaction is zero.
When the refractive index of the solvent is equal to the refractive index of the colloids (Refractive index matching, ), there is no interaction between the colloids, and they are treated as Hard spheres
- This is shown by the Lorentz-Lorenz equation
- The hard sphere model provides evidence for a fluid-solid transition without attractive interactions ( entropically driven due to greater free volume per particle and as a result greater free volume entropy in a solid, causing freezing )
- is greater for a solid than a fluid, so S follows the same trend. In addition, the Helmholtz free energy of a solid is less than that of a fluid, which also drives the transition
Electrostatic Double Layer Force
Many colloids are charged, so one may expect direct electrostatic interactions to be important in determining their interactions
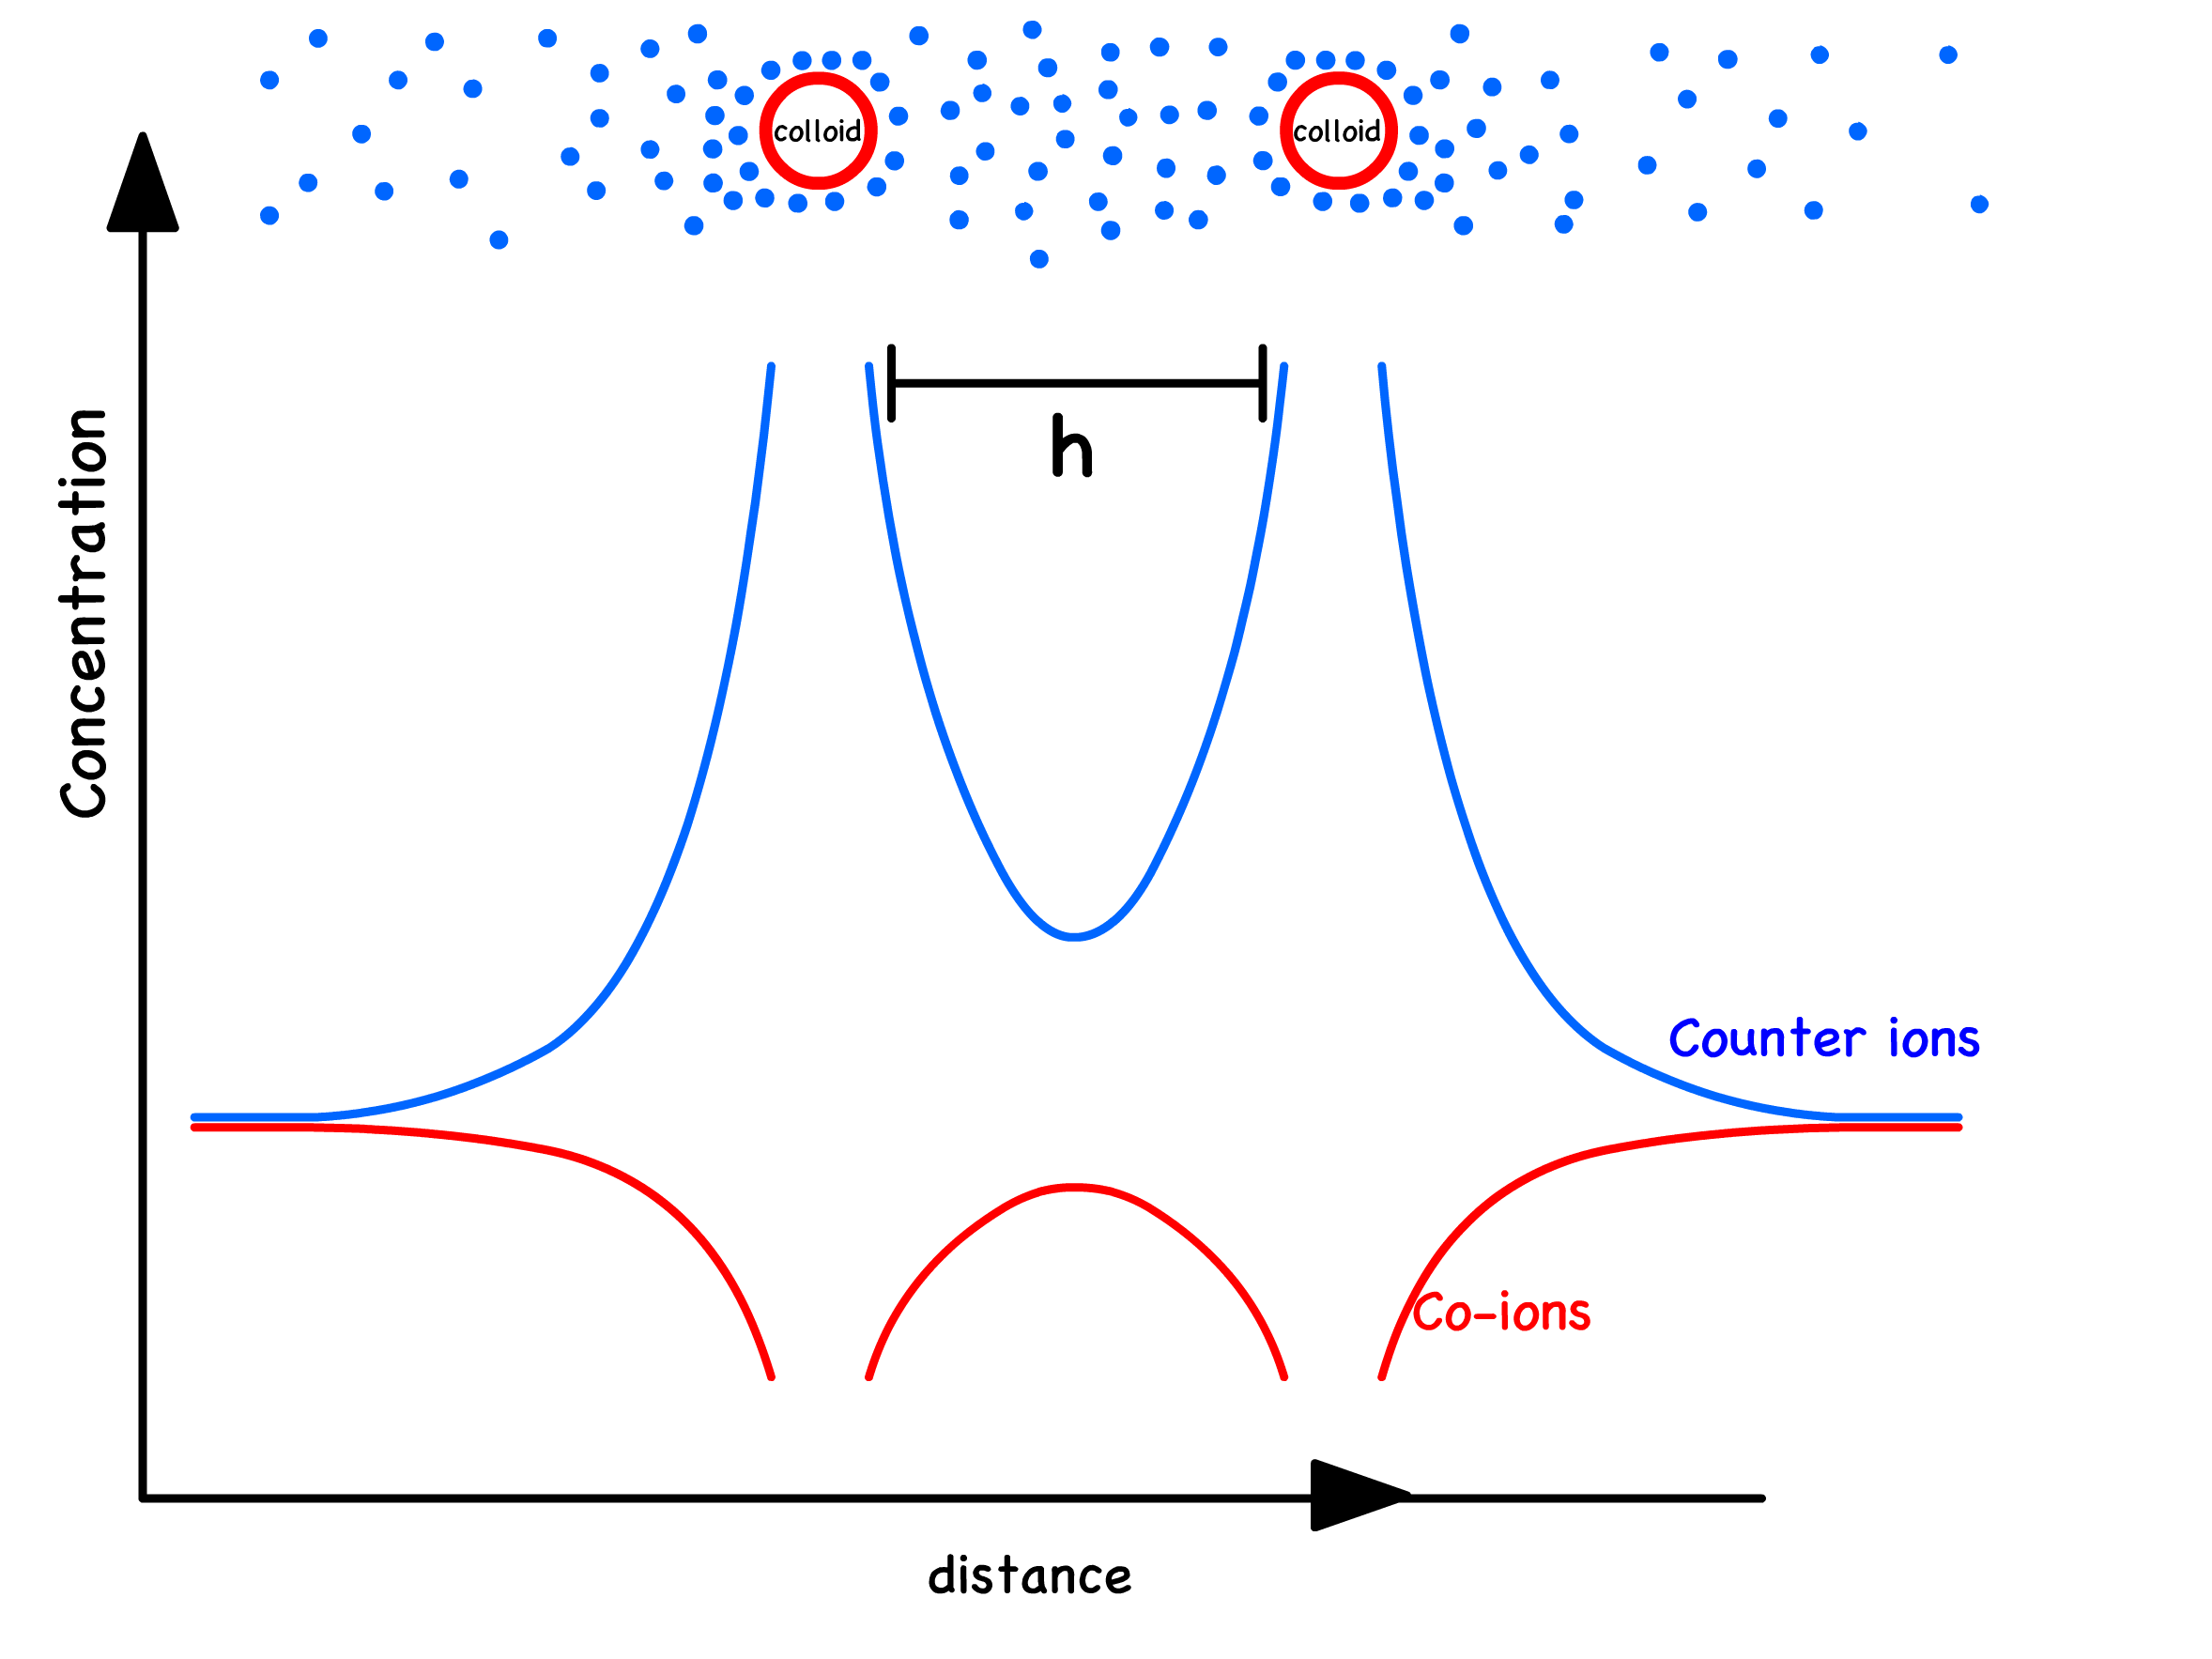
- However, when the objects are suspended in water, dissolved ions are always present, and the interaction between the charged bodies and the ions significantly modifies the nature of electrostatic interaction
- In particular, the electrostatic interactions are screened by the dissolved ions, so rather than a Columbic interaction between charged bodies, we observe a screed Columbic interaction which exponentially decays in strength with distance
The density of ions around a colloid can be estimated using the Poisson-Boltzmann equation by assuming the solvent as a continuum dielectric
- The Boltzmann equation in 1D gives the probability of finding an ion at a distance x, from the charged surface
- The Poisson equation in 1D gives the net charge density from the surface at a distance,
- Combining the Boltzmann equation with the Poisson equation gives us the Poisson-Boltzmann equation
- Solving the differential equation will give us
is known as the Debye length, it characterizes the length of screening
- At distances much greater than the Debye length, which is inversely proportional to the square root of the concentration of ions, the strength of the Columbic interaction rapidly drops to zero
Bringing two colloids of the same charge together would intuitively suggest a repulsive force between them
- However, the origin of this force is not directly due to electrostatic effects. The combination of the charged surfaces and the attracted counterions must maintain an overall charge neutrality, resulting in no net electrostatic force
- Instead, the variations in ionic concentrations within the gap between these objects, compared to the bulk solution, lead to an excess osmotic pressure of the counterions in the gap between the plates
- The concentration of counterions between the colloids exceeds that in the bulk solution, leading to an osmotic pressure
- In fact for , the potential between the two charged colloids is given by
- Since increases with concentration of ions, adding salt can increase the effect of screening, which in turns weakens repulsive force
Colloidal Stability
When discussing colloidal stability, we are concerned about whether the colloidal suspension is sustainable
- When the interaction between colloids is much stronger than that of thermal fluctuation ( ), they will aggregate together and fall out of solution
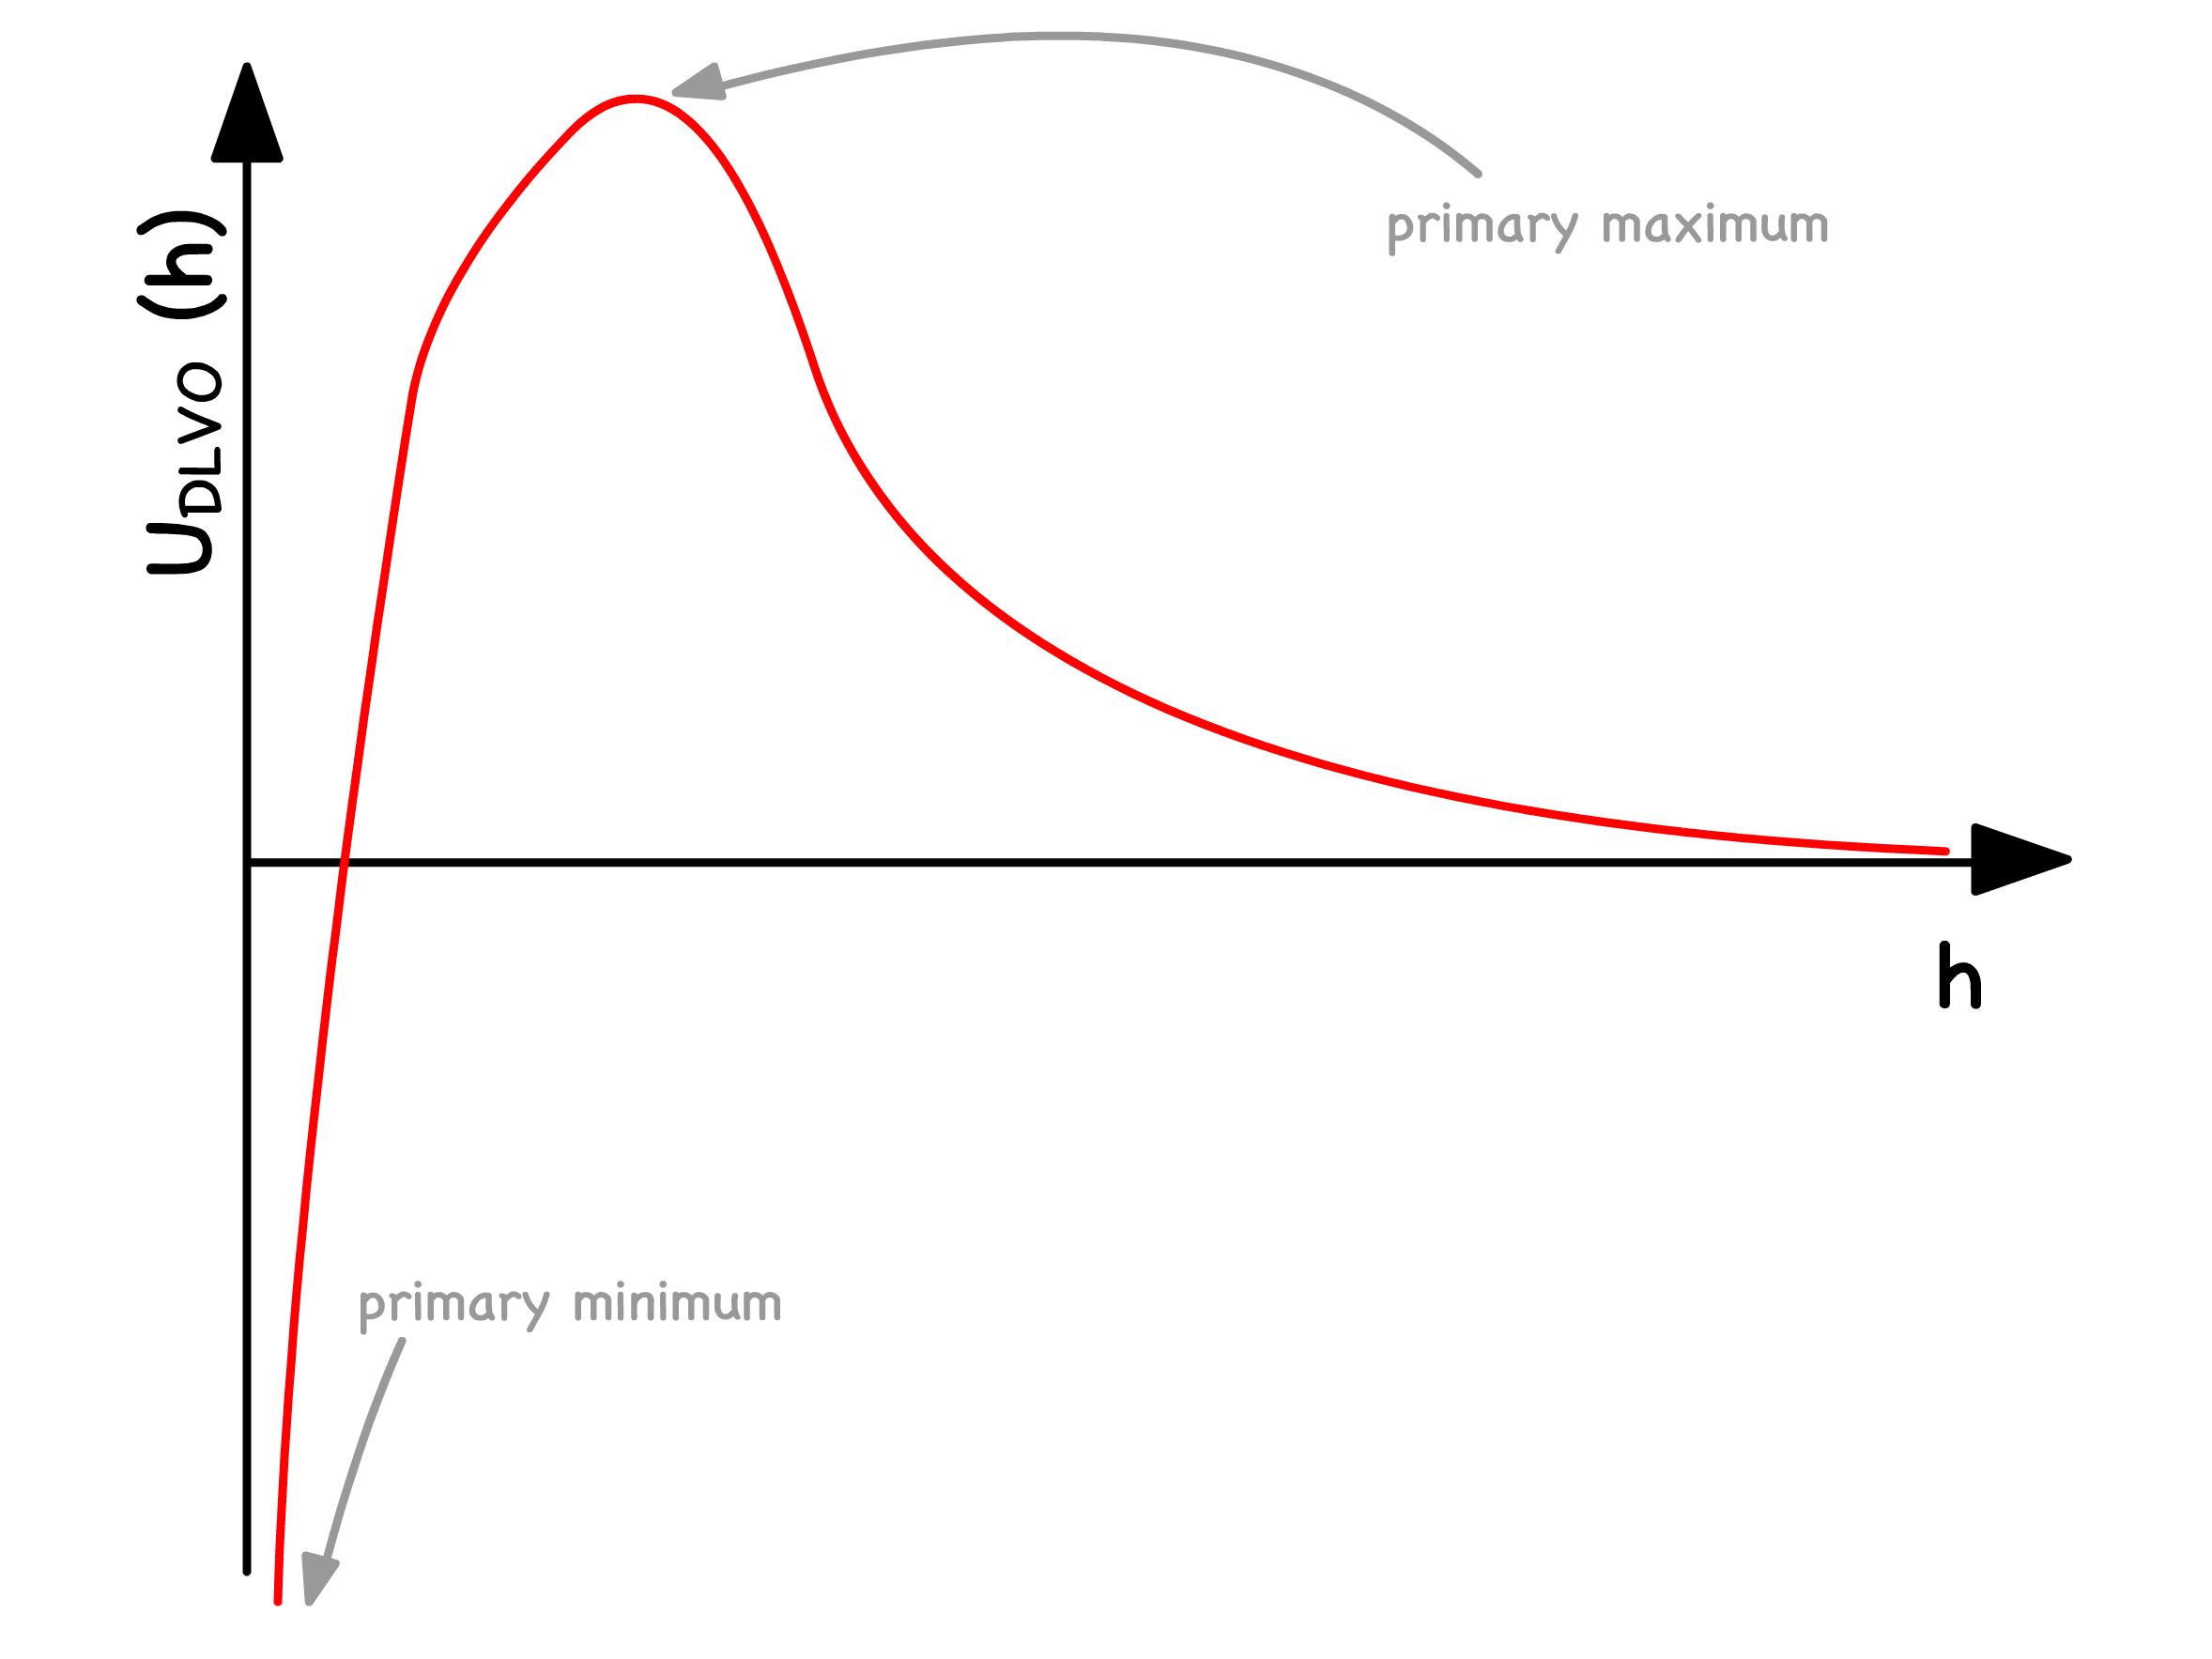
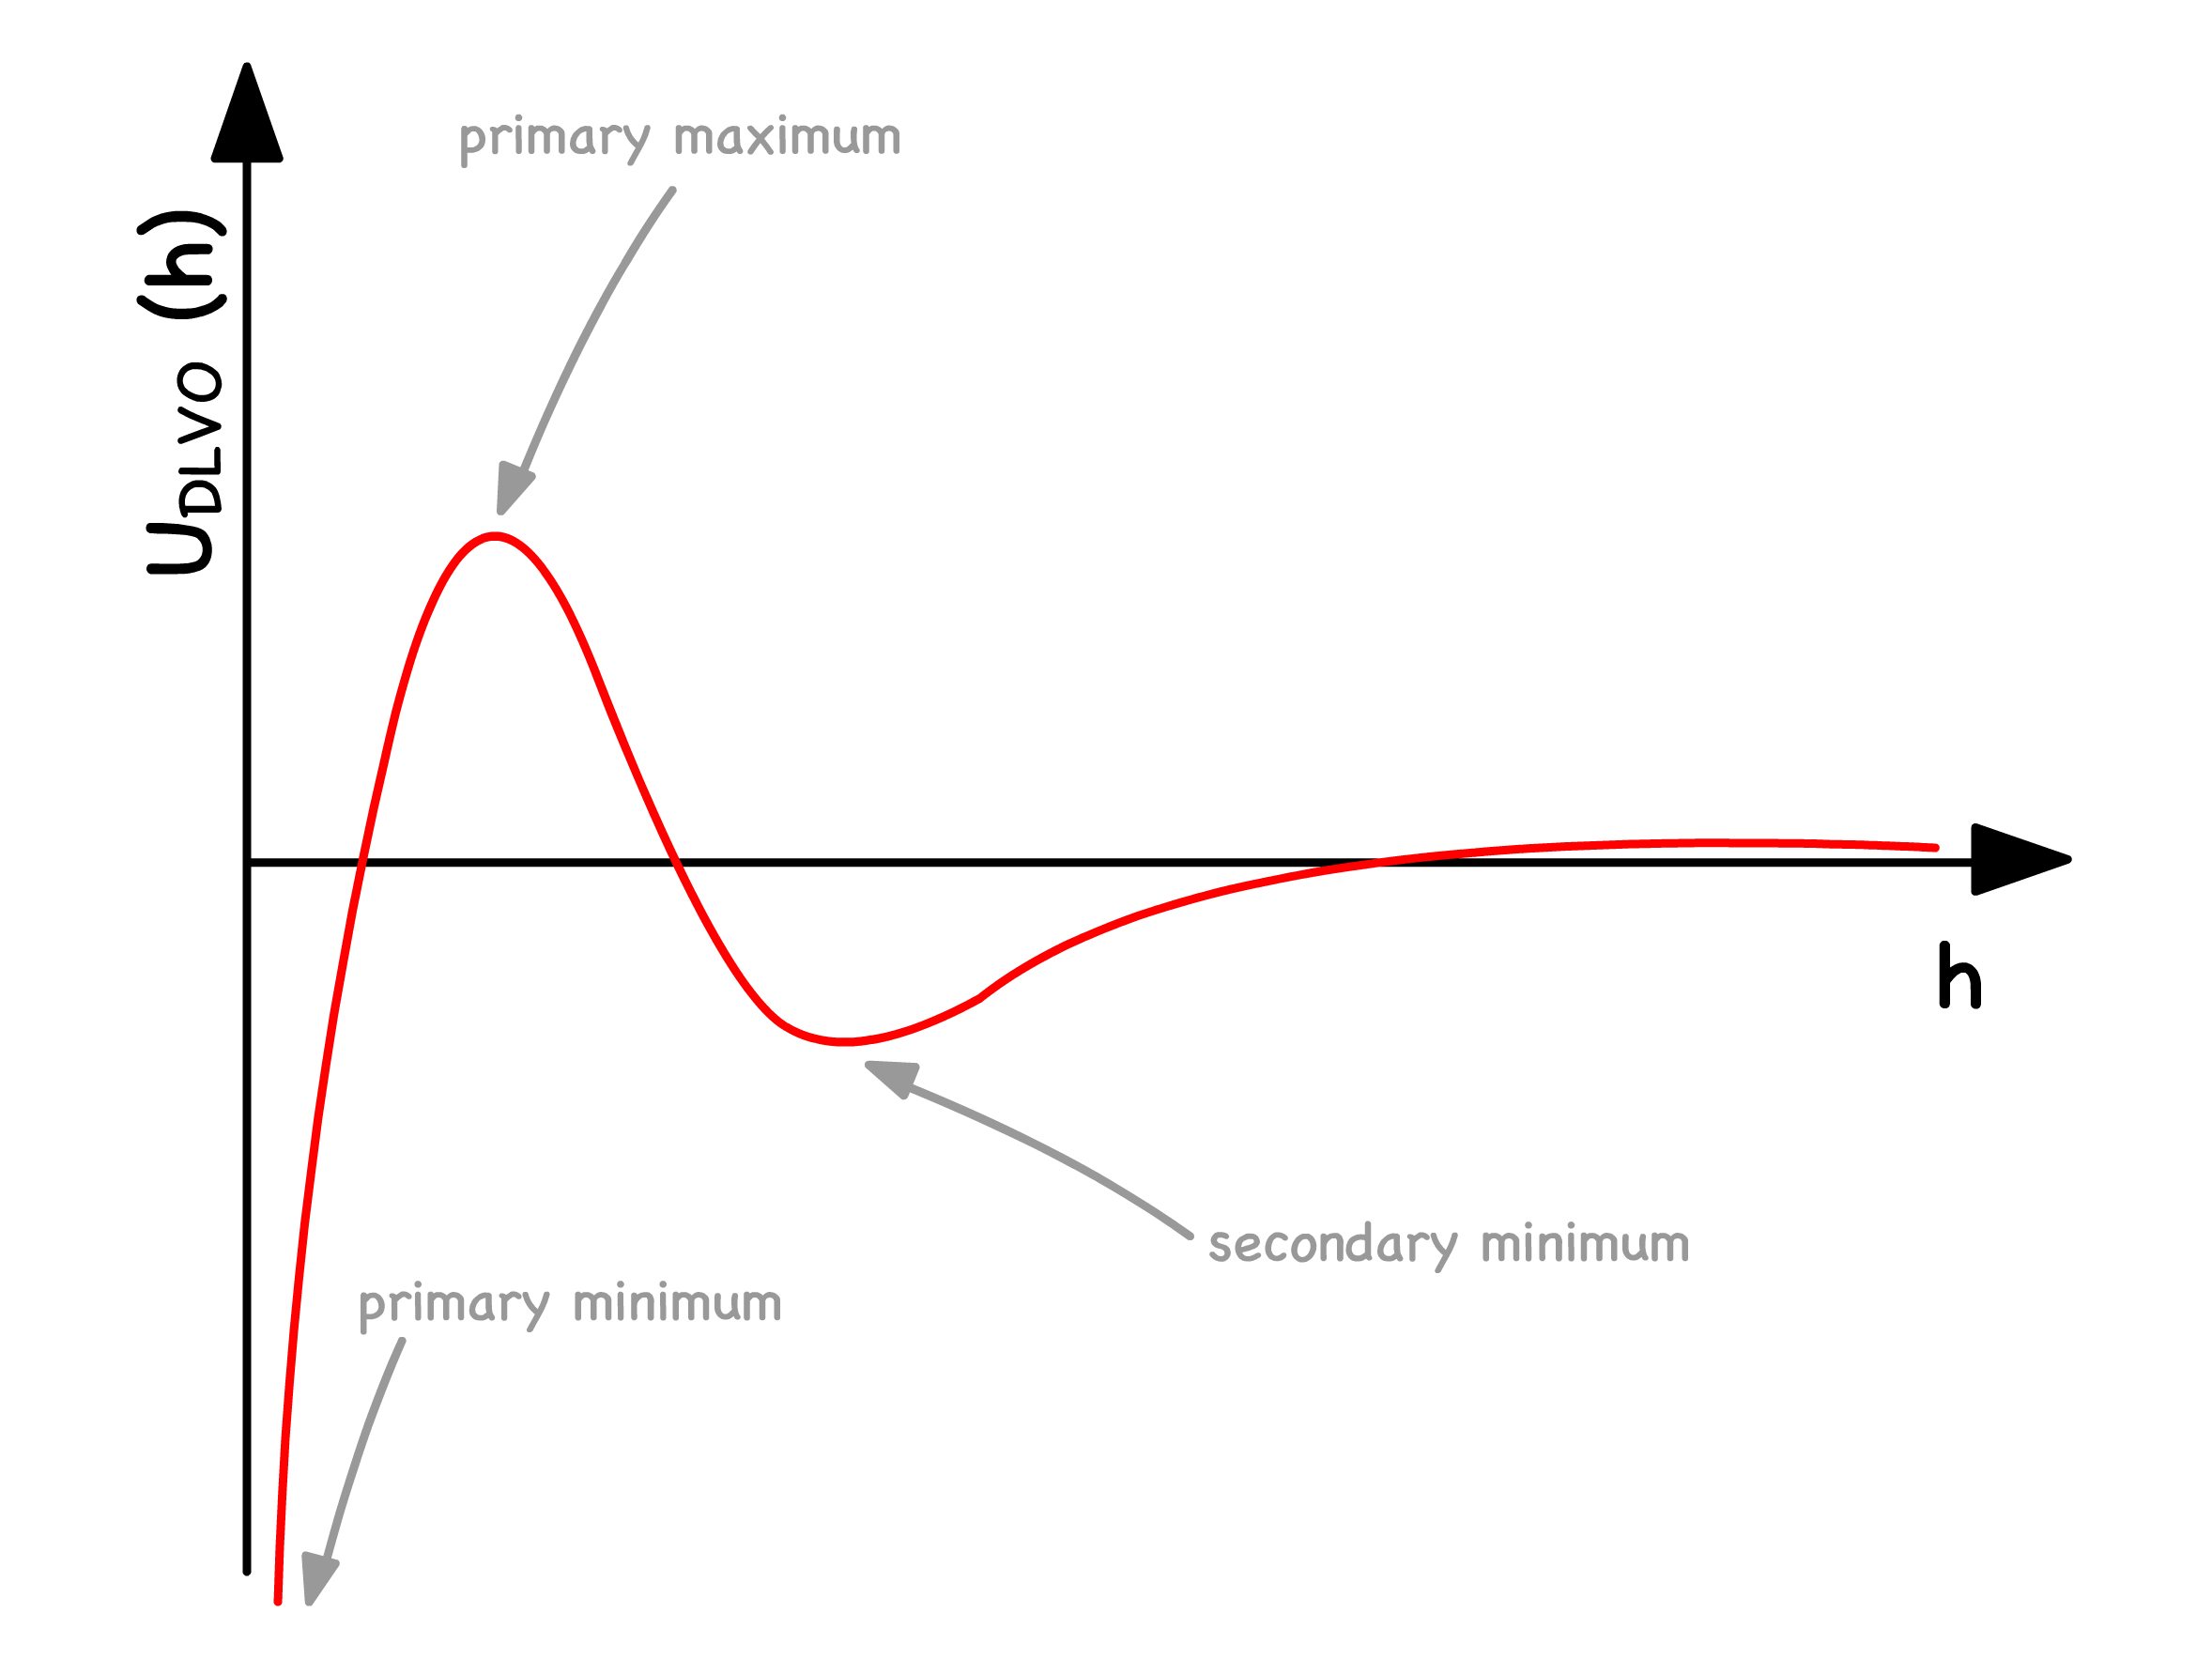
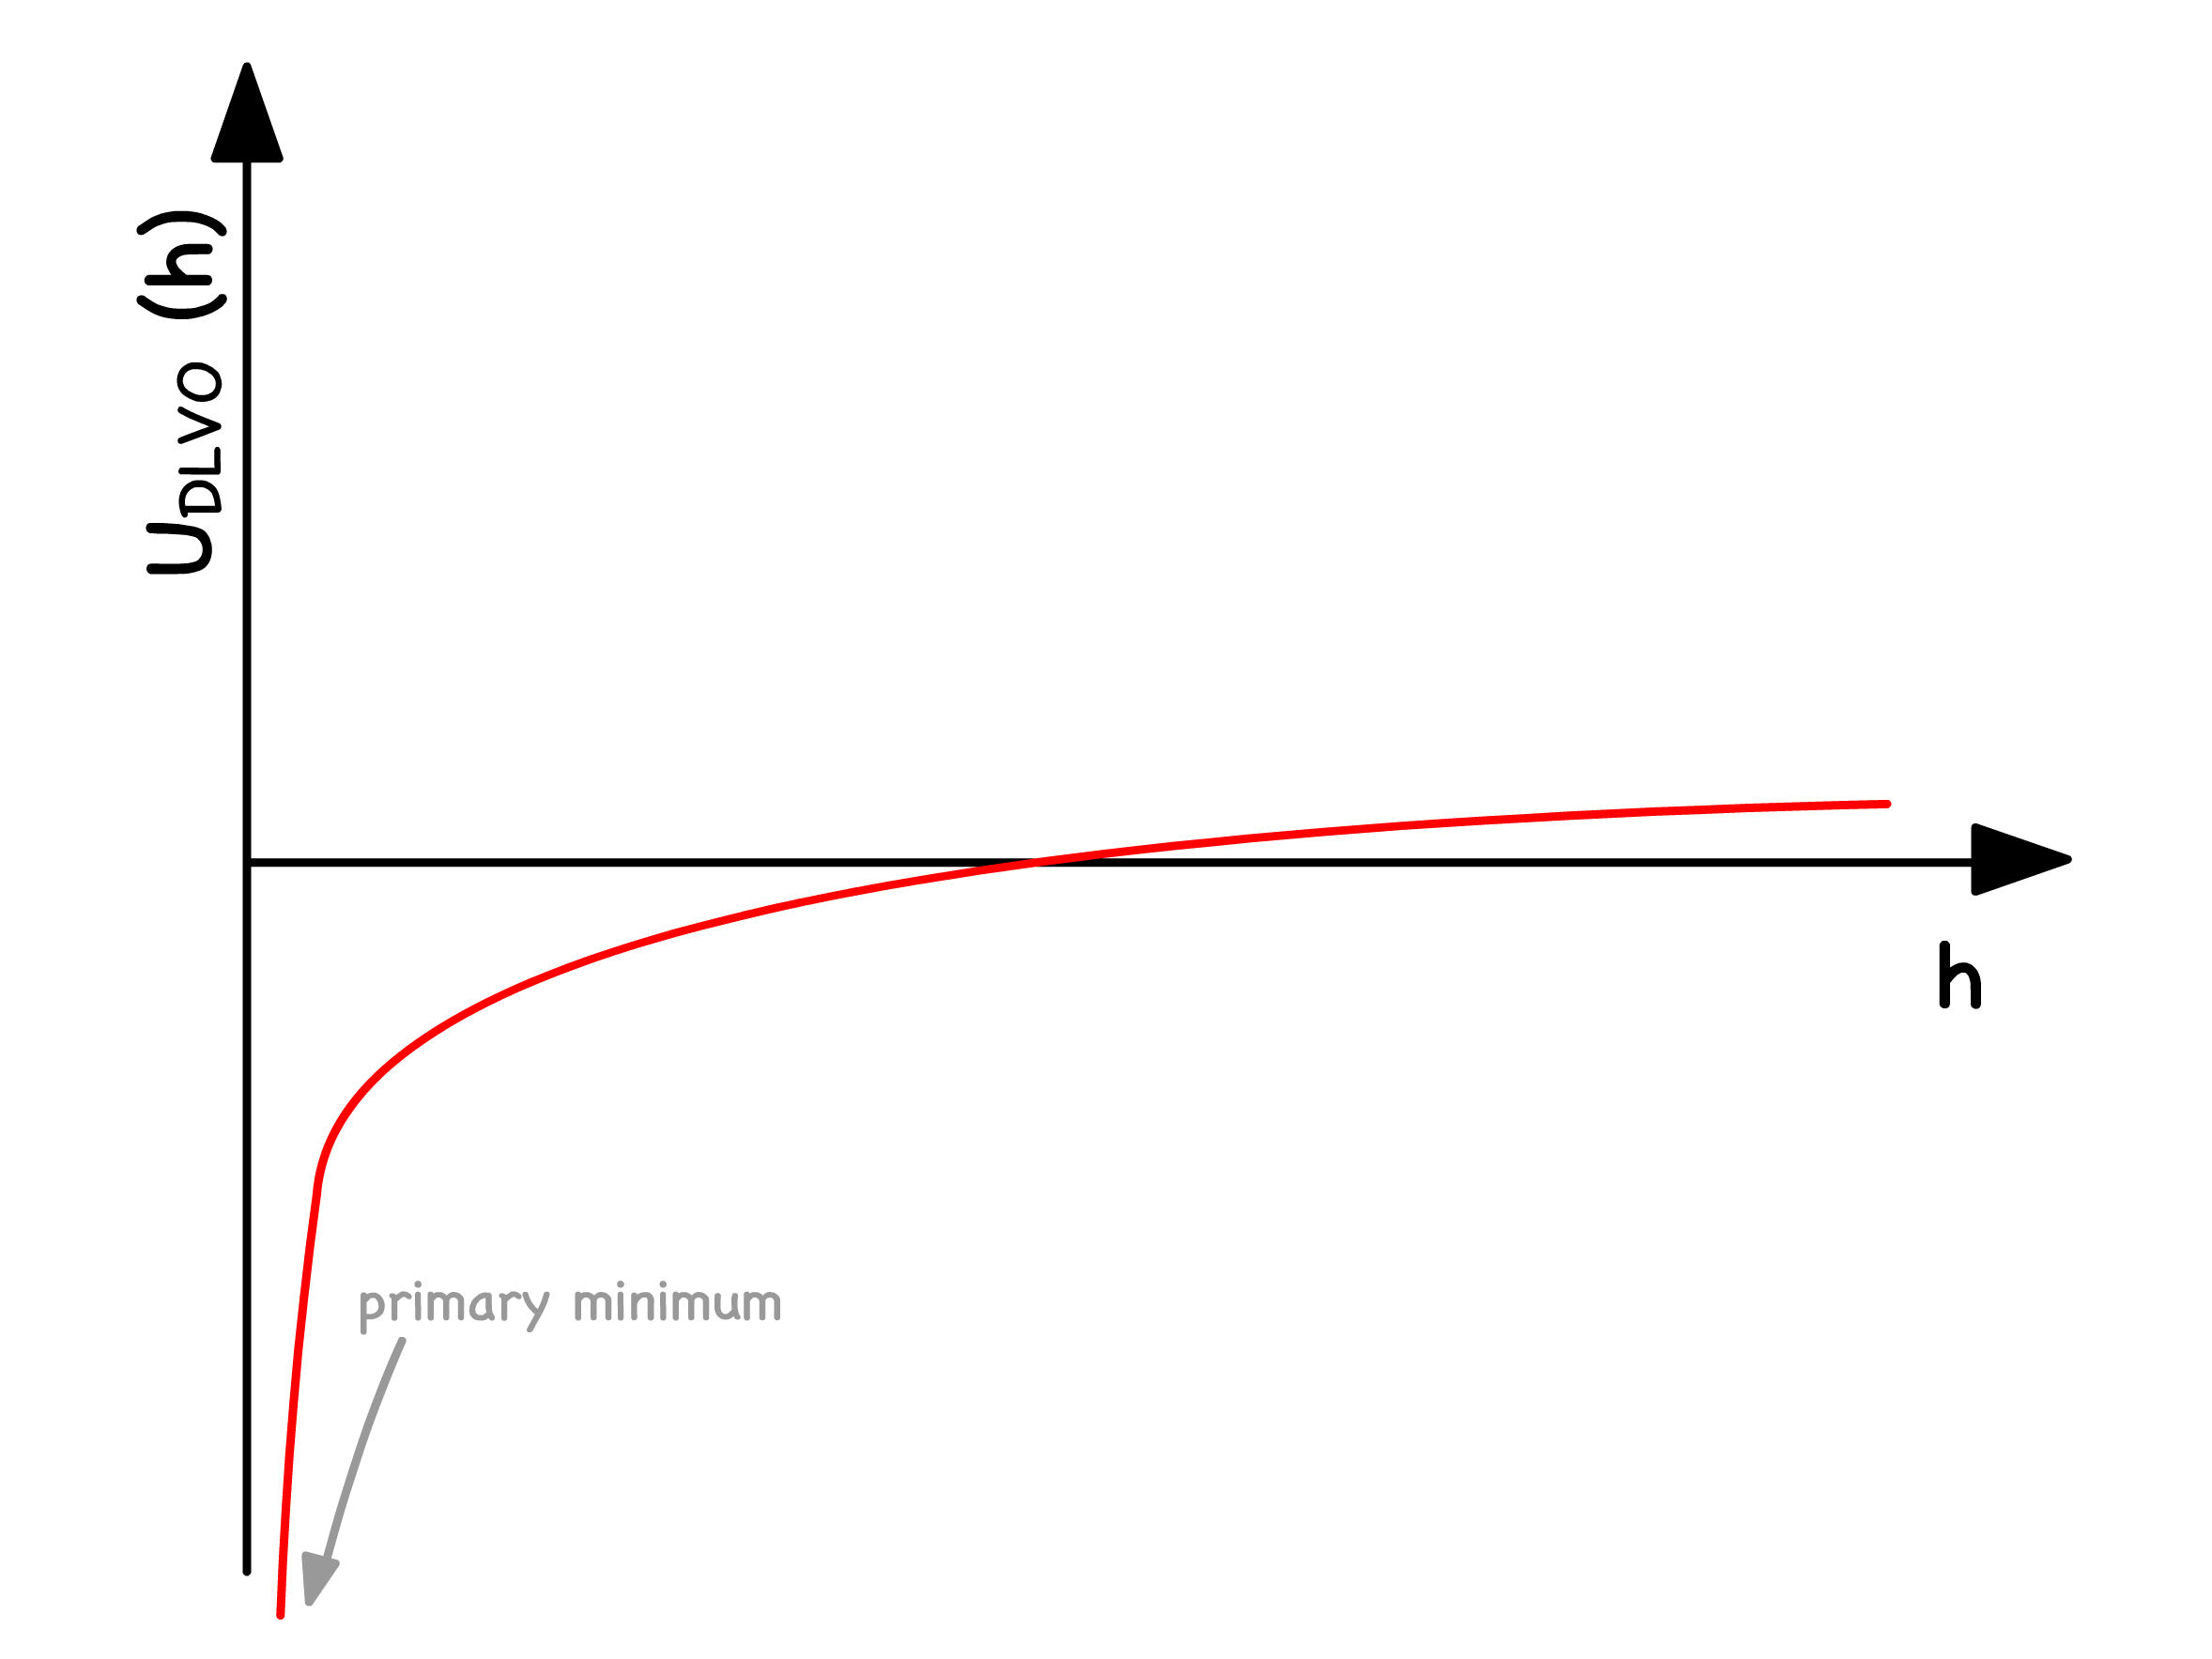
The overall potential experienced by colloids is just the sum of the the attractive Van Der Waals and repulsive electrostatic interactions
When is small, the repulsive force dominates. The primary maximum is a lot bigger than , so the suspension is stable
- At intermediate values of , the repulsive force no longer dominates. The colloids can either reversibly associate ( flocculatation ) or irreversibly associate ( coagulation )
- At large values of , the attractive Van Der Waals force dominates. The absence of a maximum indicates that colloids will always aggregate together
Since the maxima in the potential curve serves as a kinetic barrier against coagulation, it is important to study how it varys
- The separation corresponding to the maxima ( ) is equal to the Debye length
¶ Entropy-Driven Interactions
Steric Stabilisation
Adsorbing polymer coatings to colloids induce repulsive forces by increasing the distance between colloids
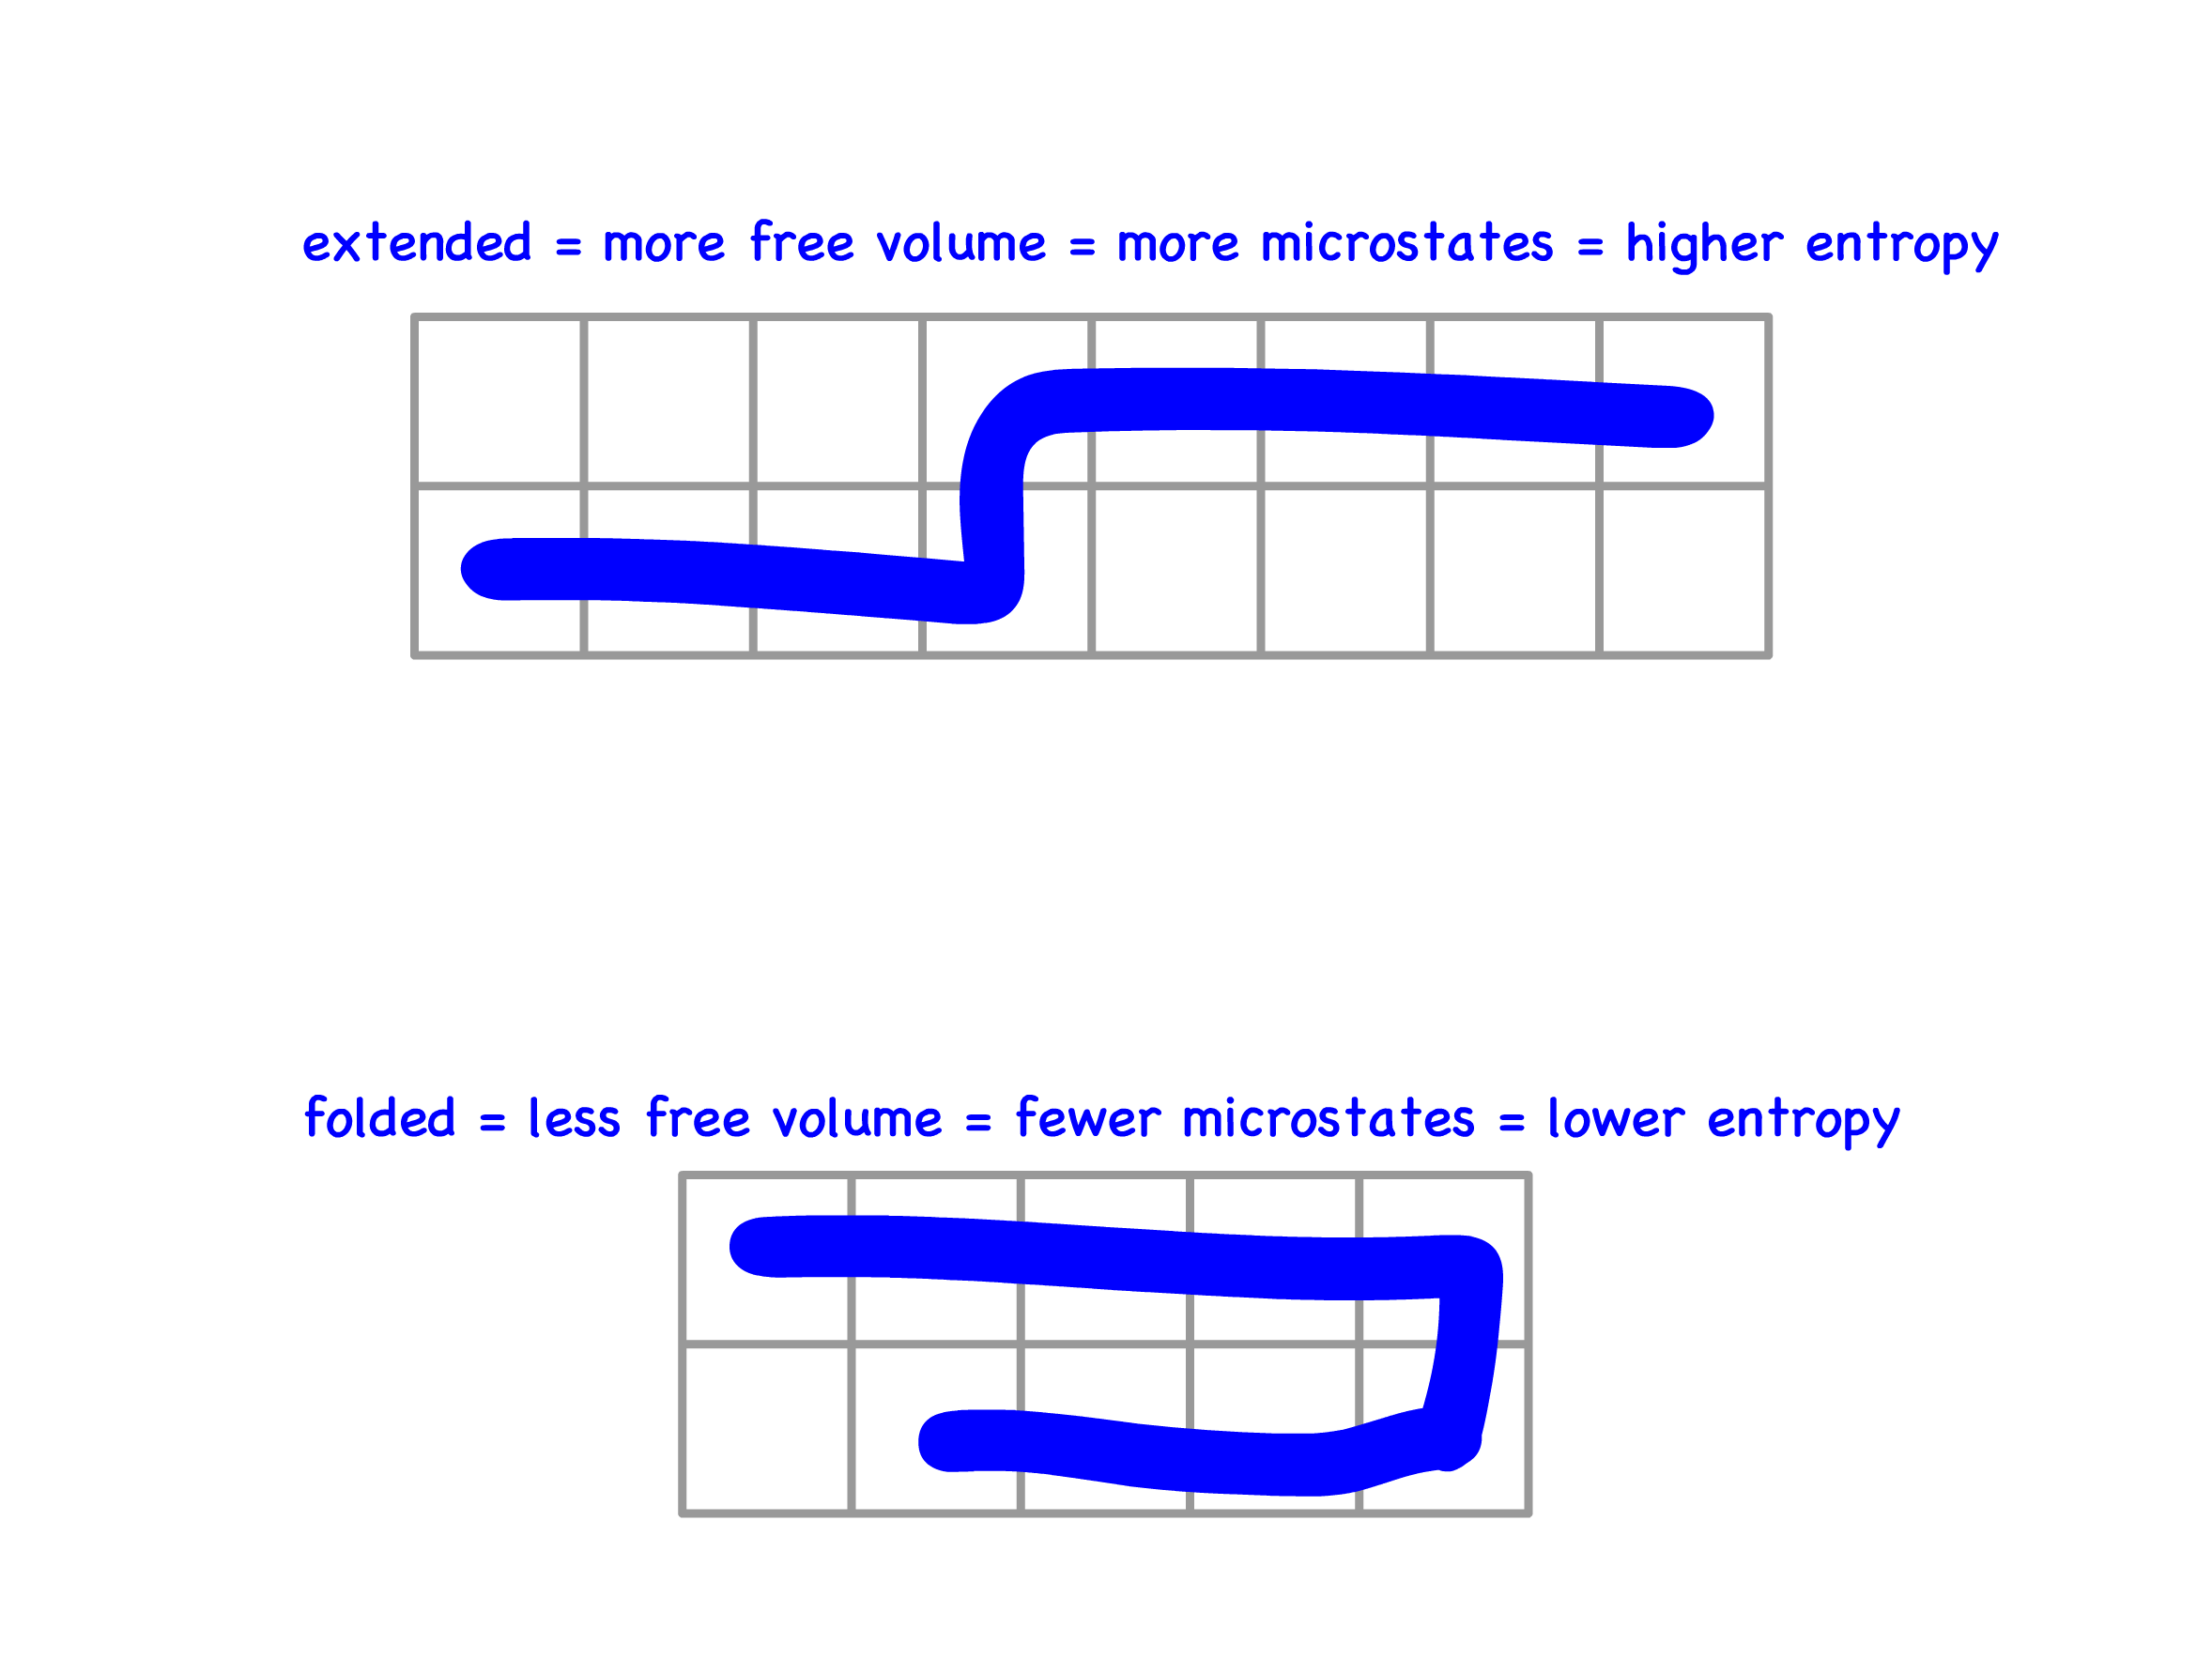
- When coated colloids approach each other, the surface polymers are forced to be folded
- Effectively the number of microstates for the polymer decreases, so the colloids move apart to maximize polymer entropy, preventing colloid coagulation
- Since this repulsive force is entropic in nature, it increases with temperature
Steric stabilization requires good solvent conditions
- Good solvent conditions imply that the solvent has an affinity for the polymer, promoting mixing rather than phase separation
- This happens when the Flory-Huggins interaction parameter is less than 0.5
Depletion Interaction
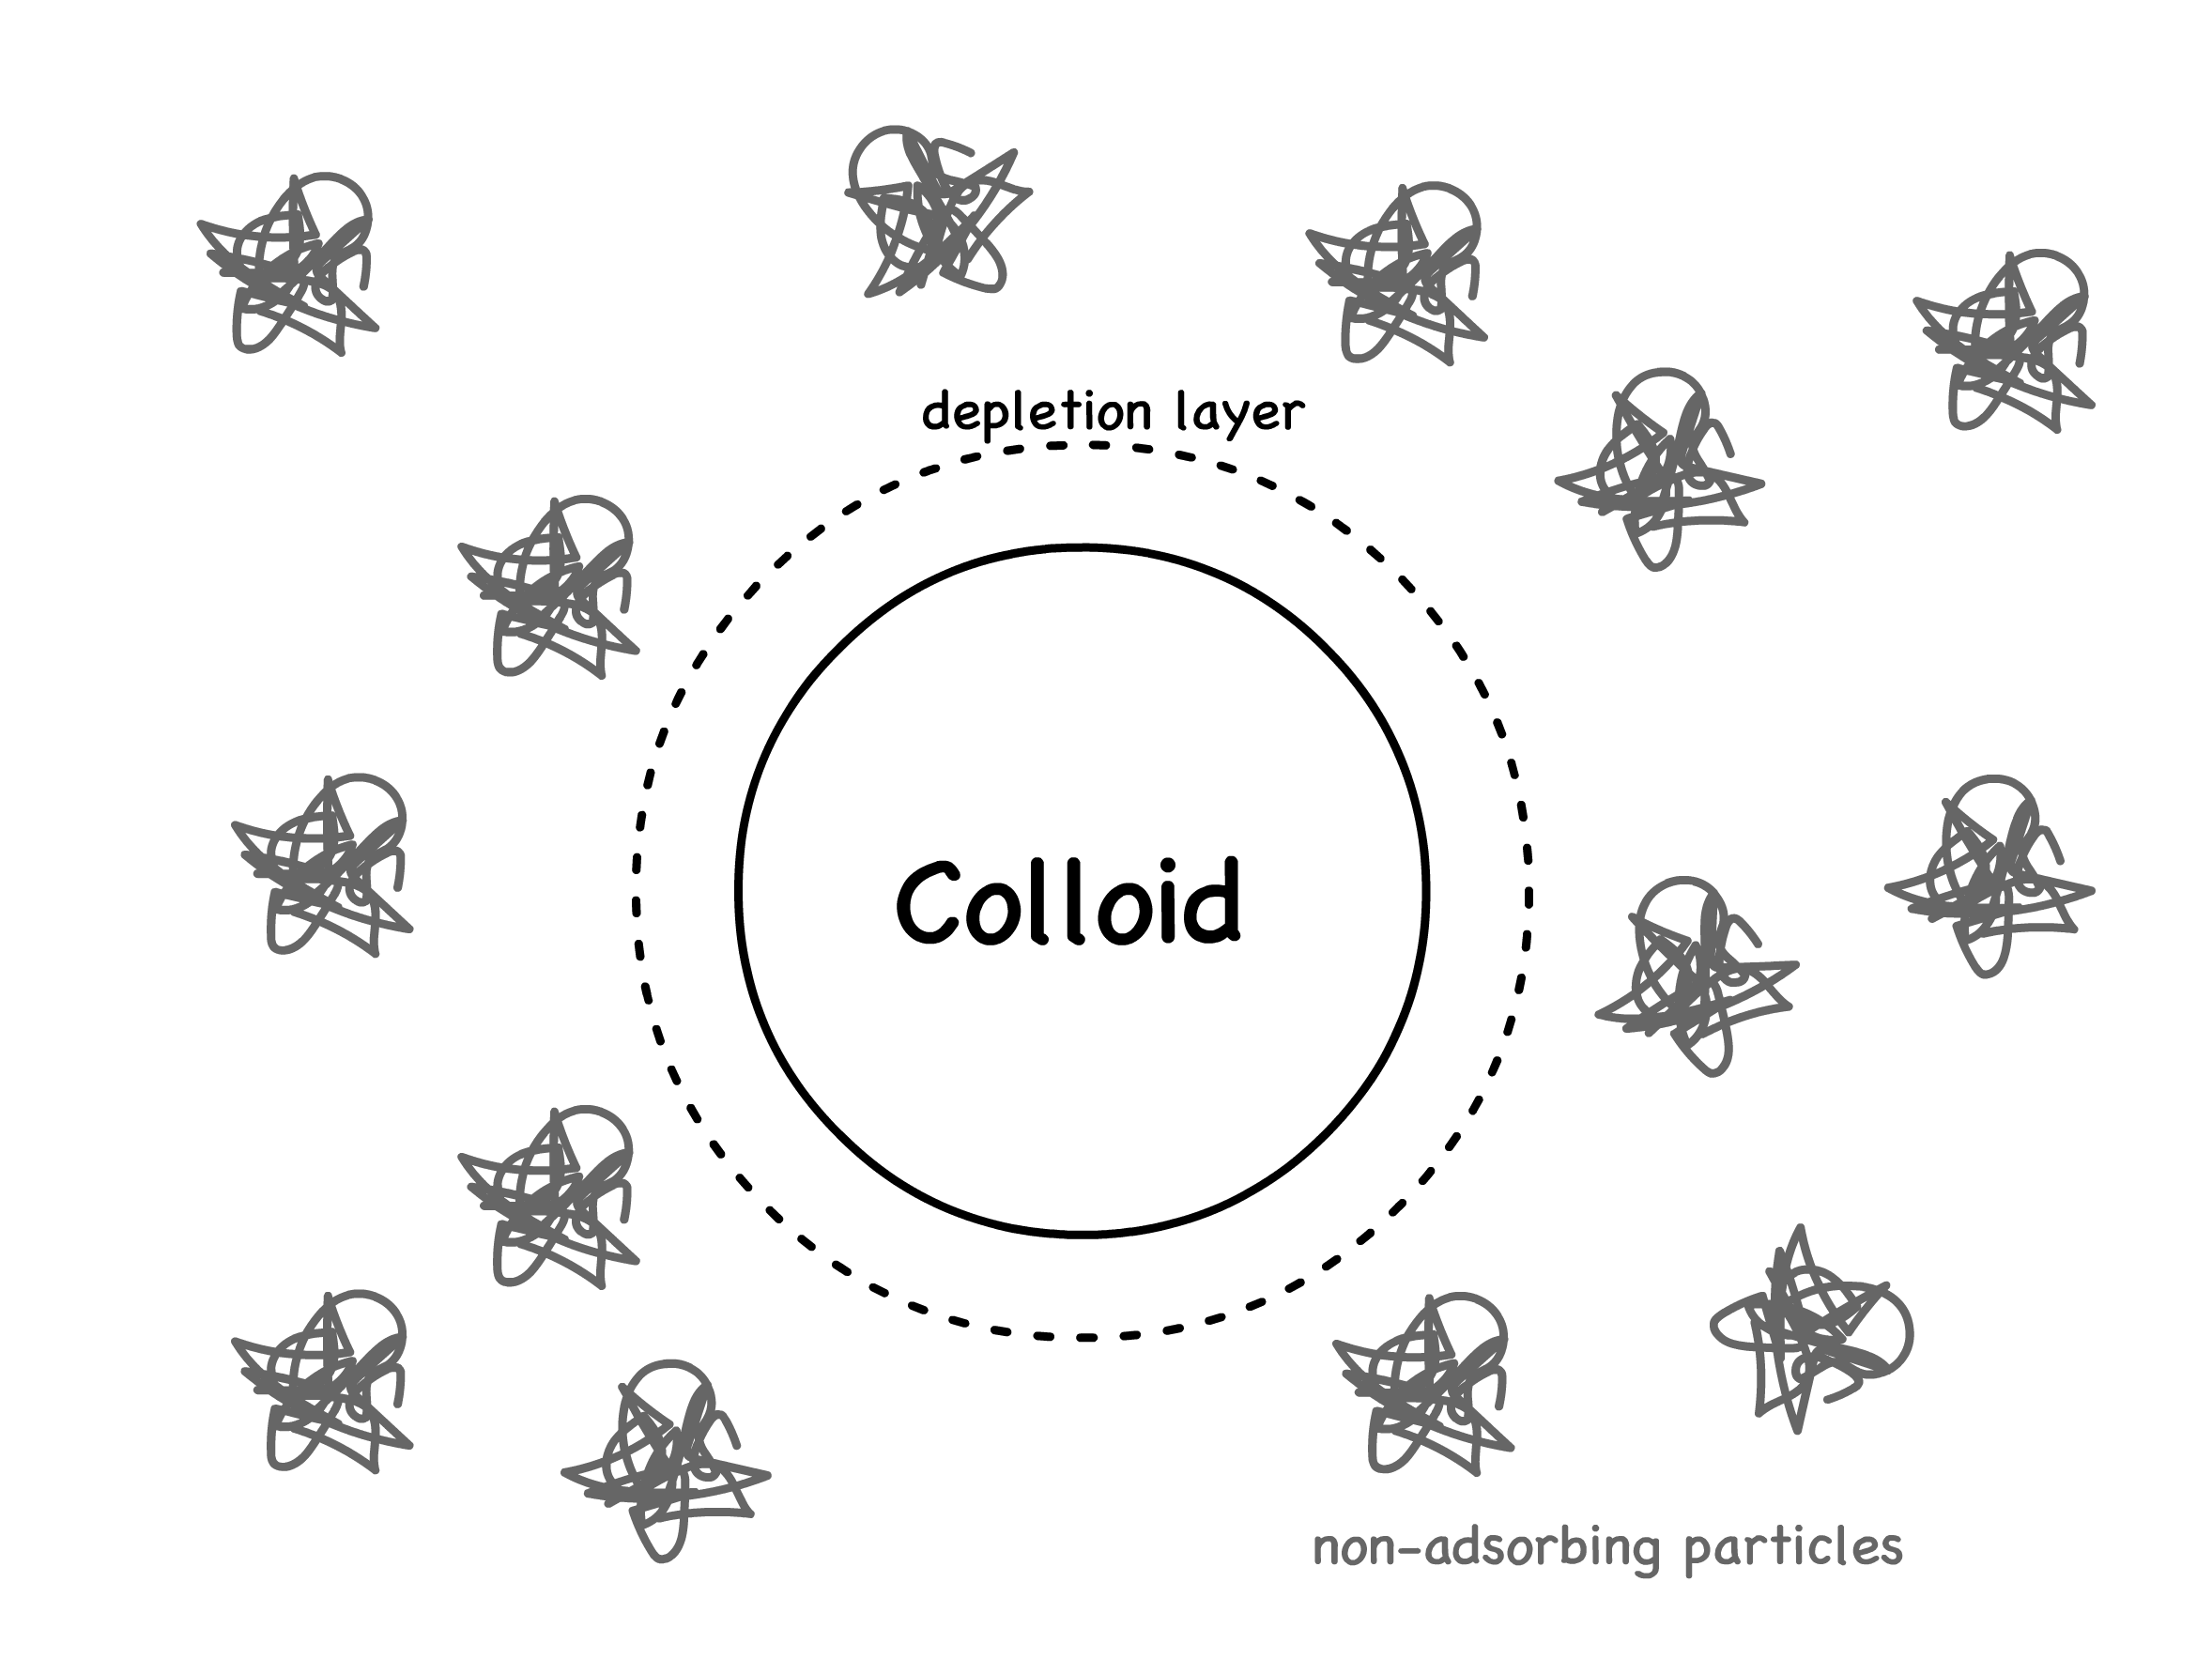
Depletion interactions arise when the solution contains, in addition to the colloids, other non-adsorbing particles that are much smaller than colloids but larger than solvent molecules
- This happens because every colloid has a depletion layer that excludes the non-adsorbing particles
Addition of nonadsorbing polymer to a colloidal suspension may induce coagulation
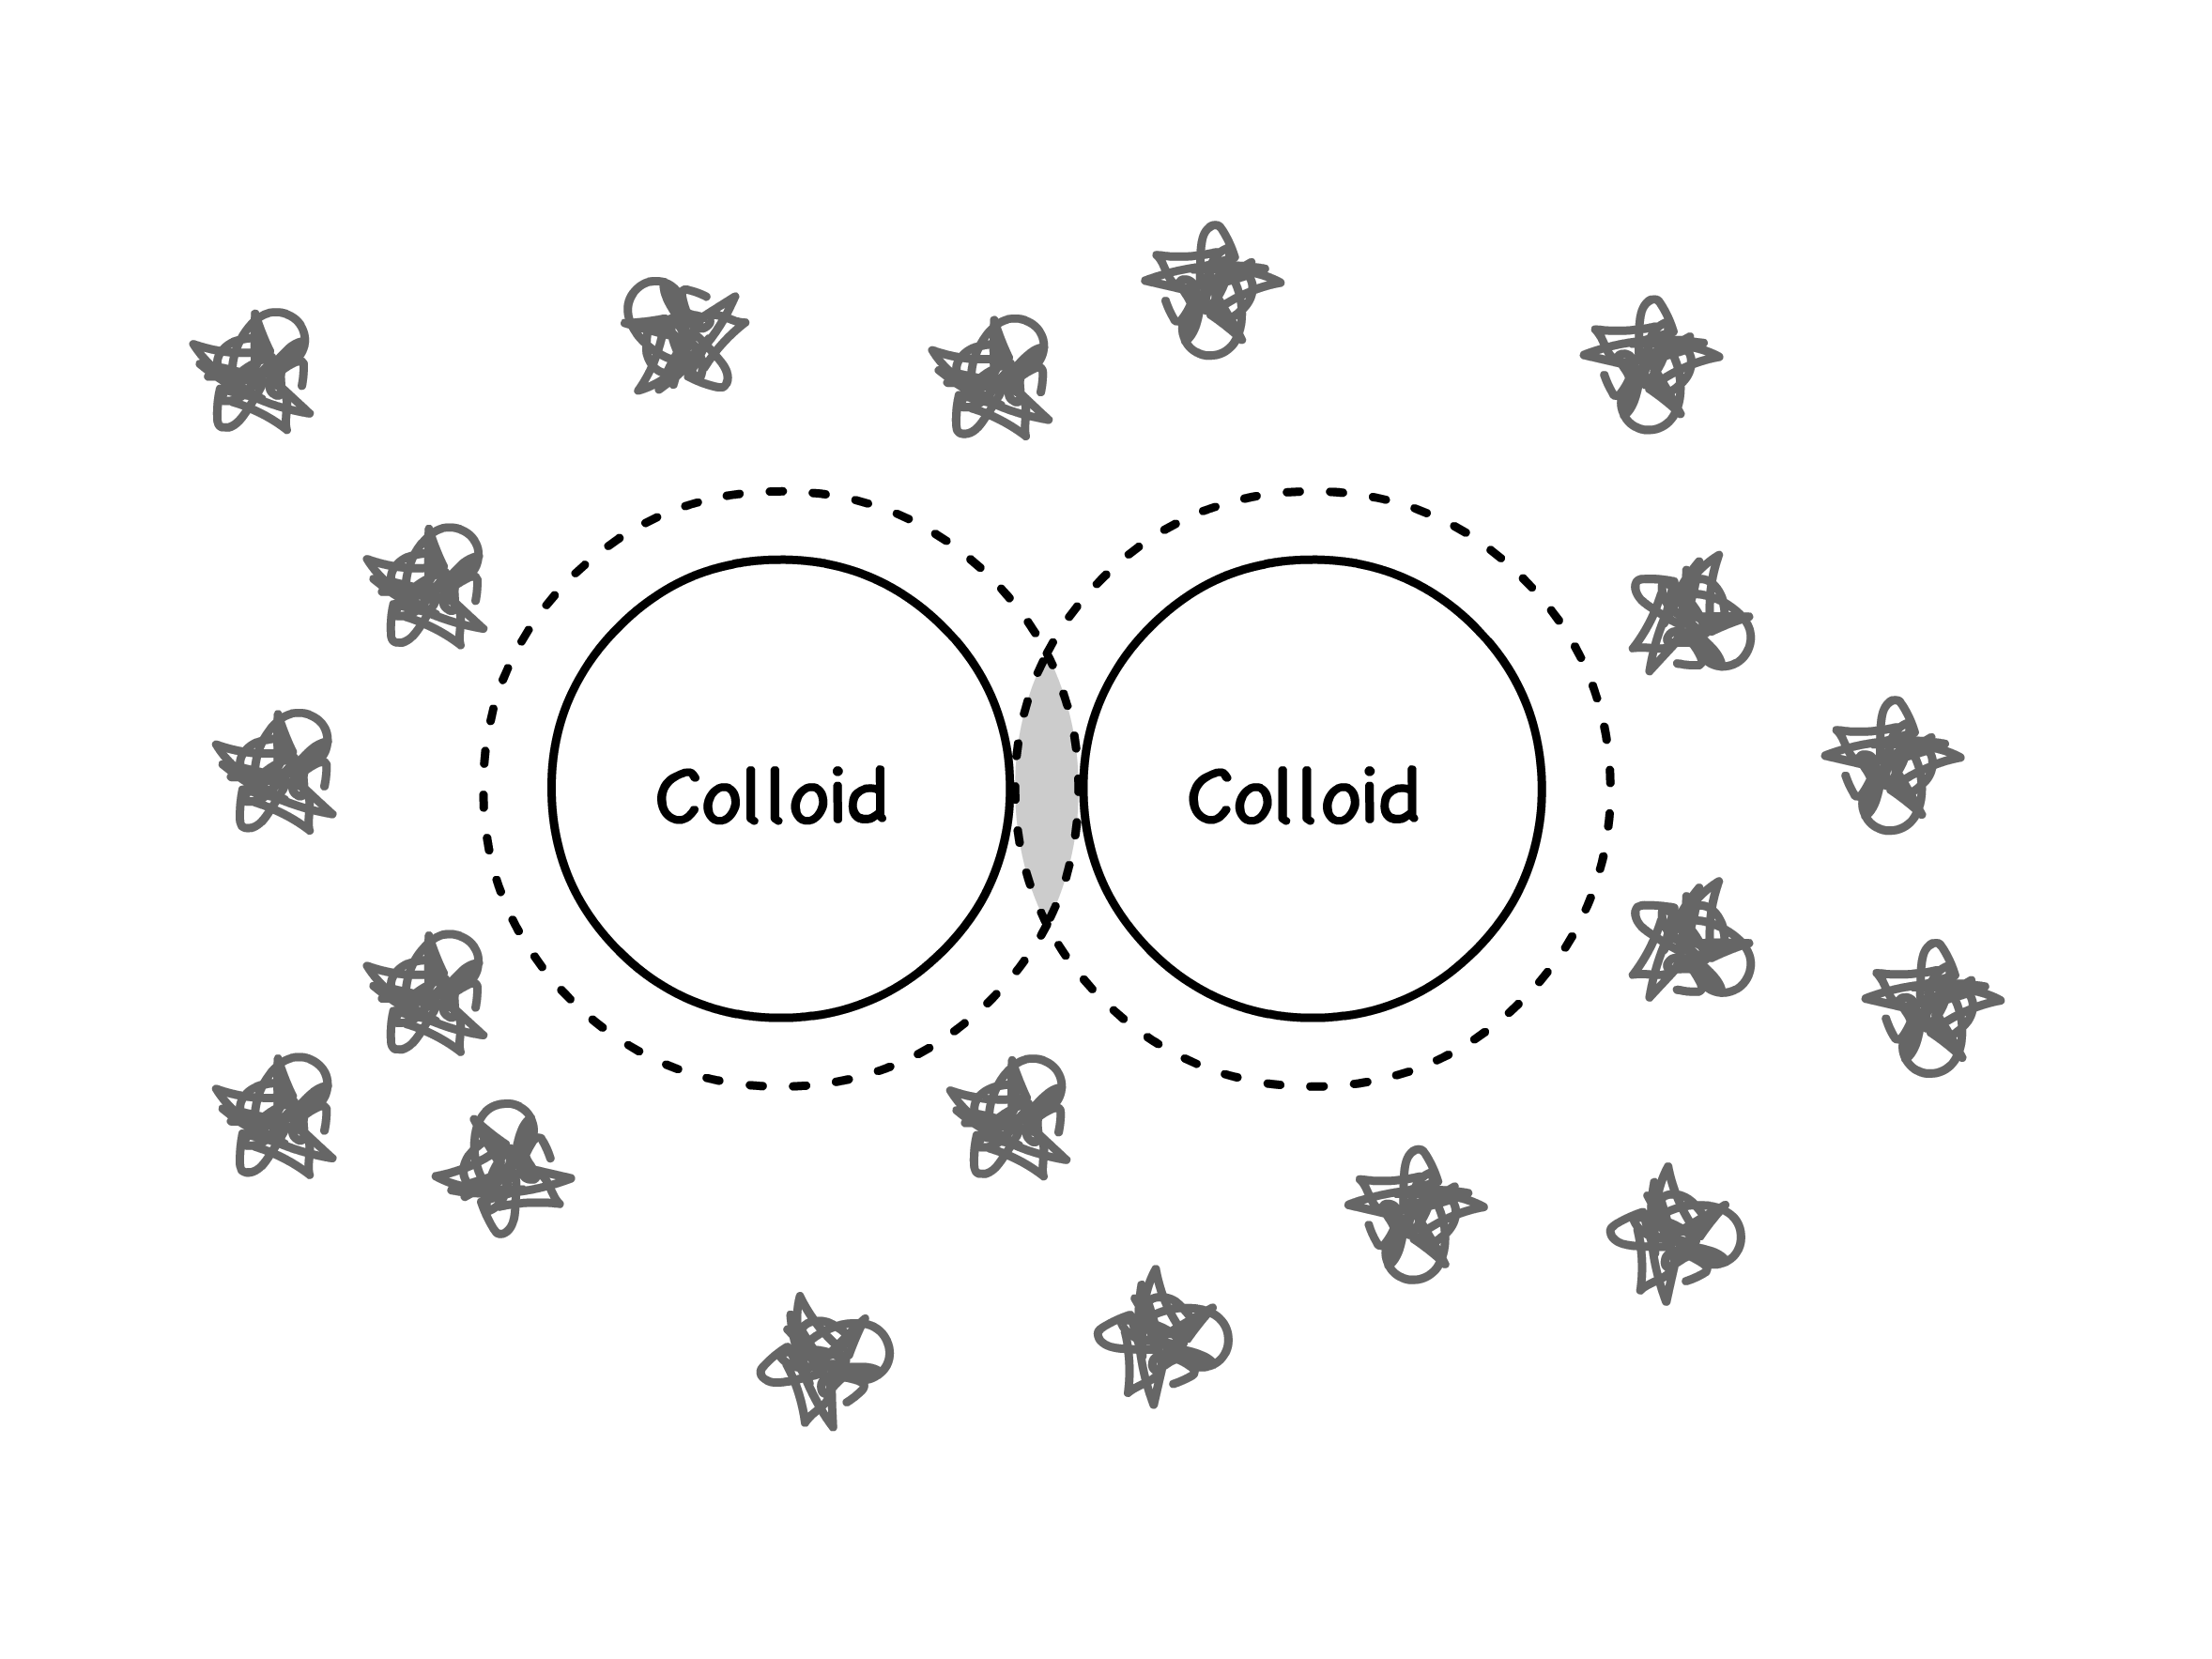
- The depletion region, which is the space between two colloids in solution not occupied by polymers
- When two colloids approach each other, their depletion layers overlap to form a depletion zone
- The concentration of the non-adsorbing particles in the depletion zone is lower than that of the bulk, thus generating an osmotic pressure to push the two colloids together
- This attractive force is entropic in nature more free volume ( thus more microstates ) in the solution as a whole is available to the polymer, giving the suspension higher entropy
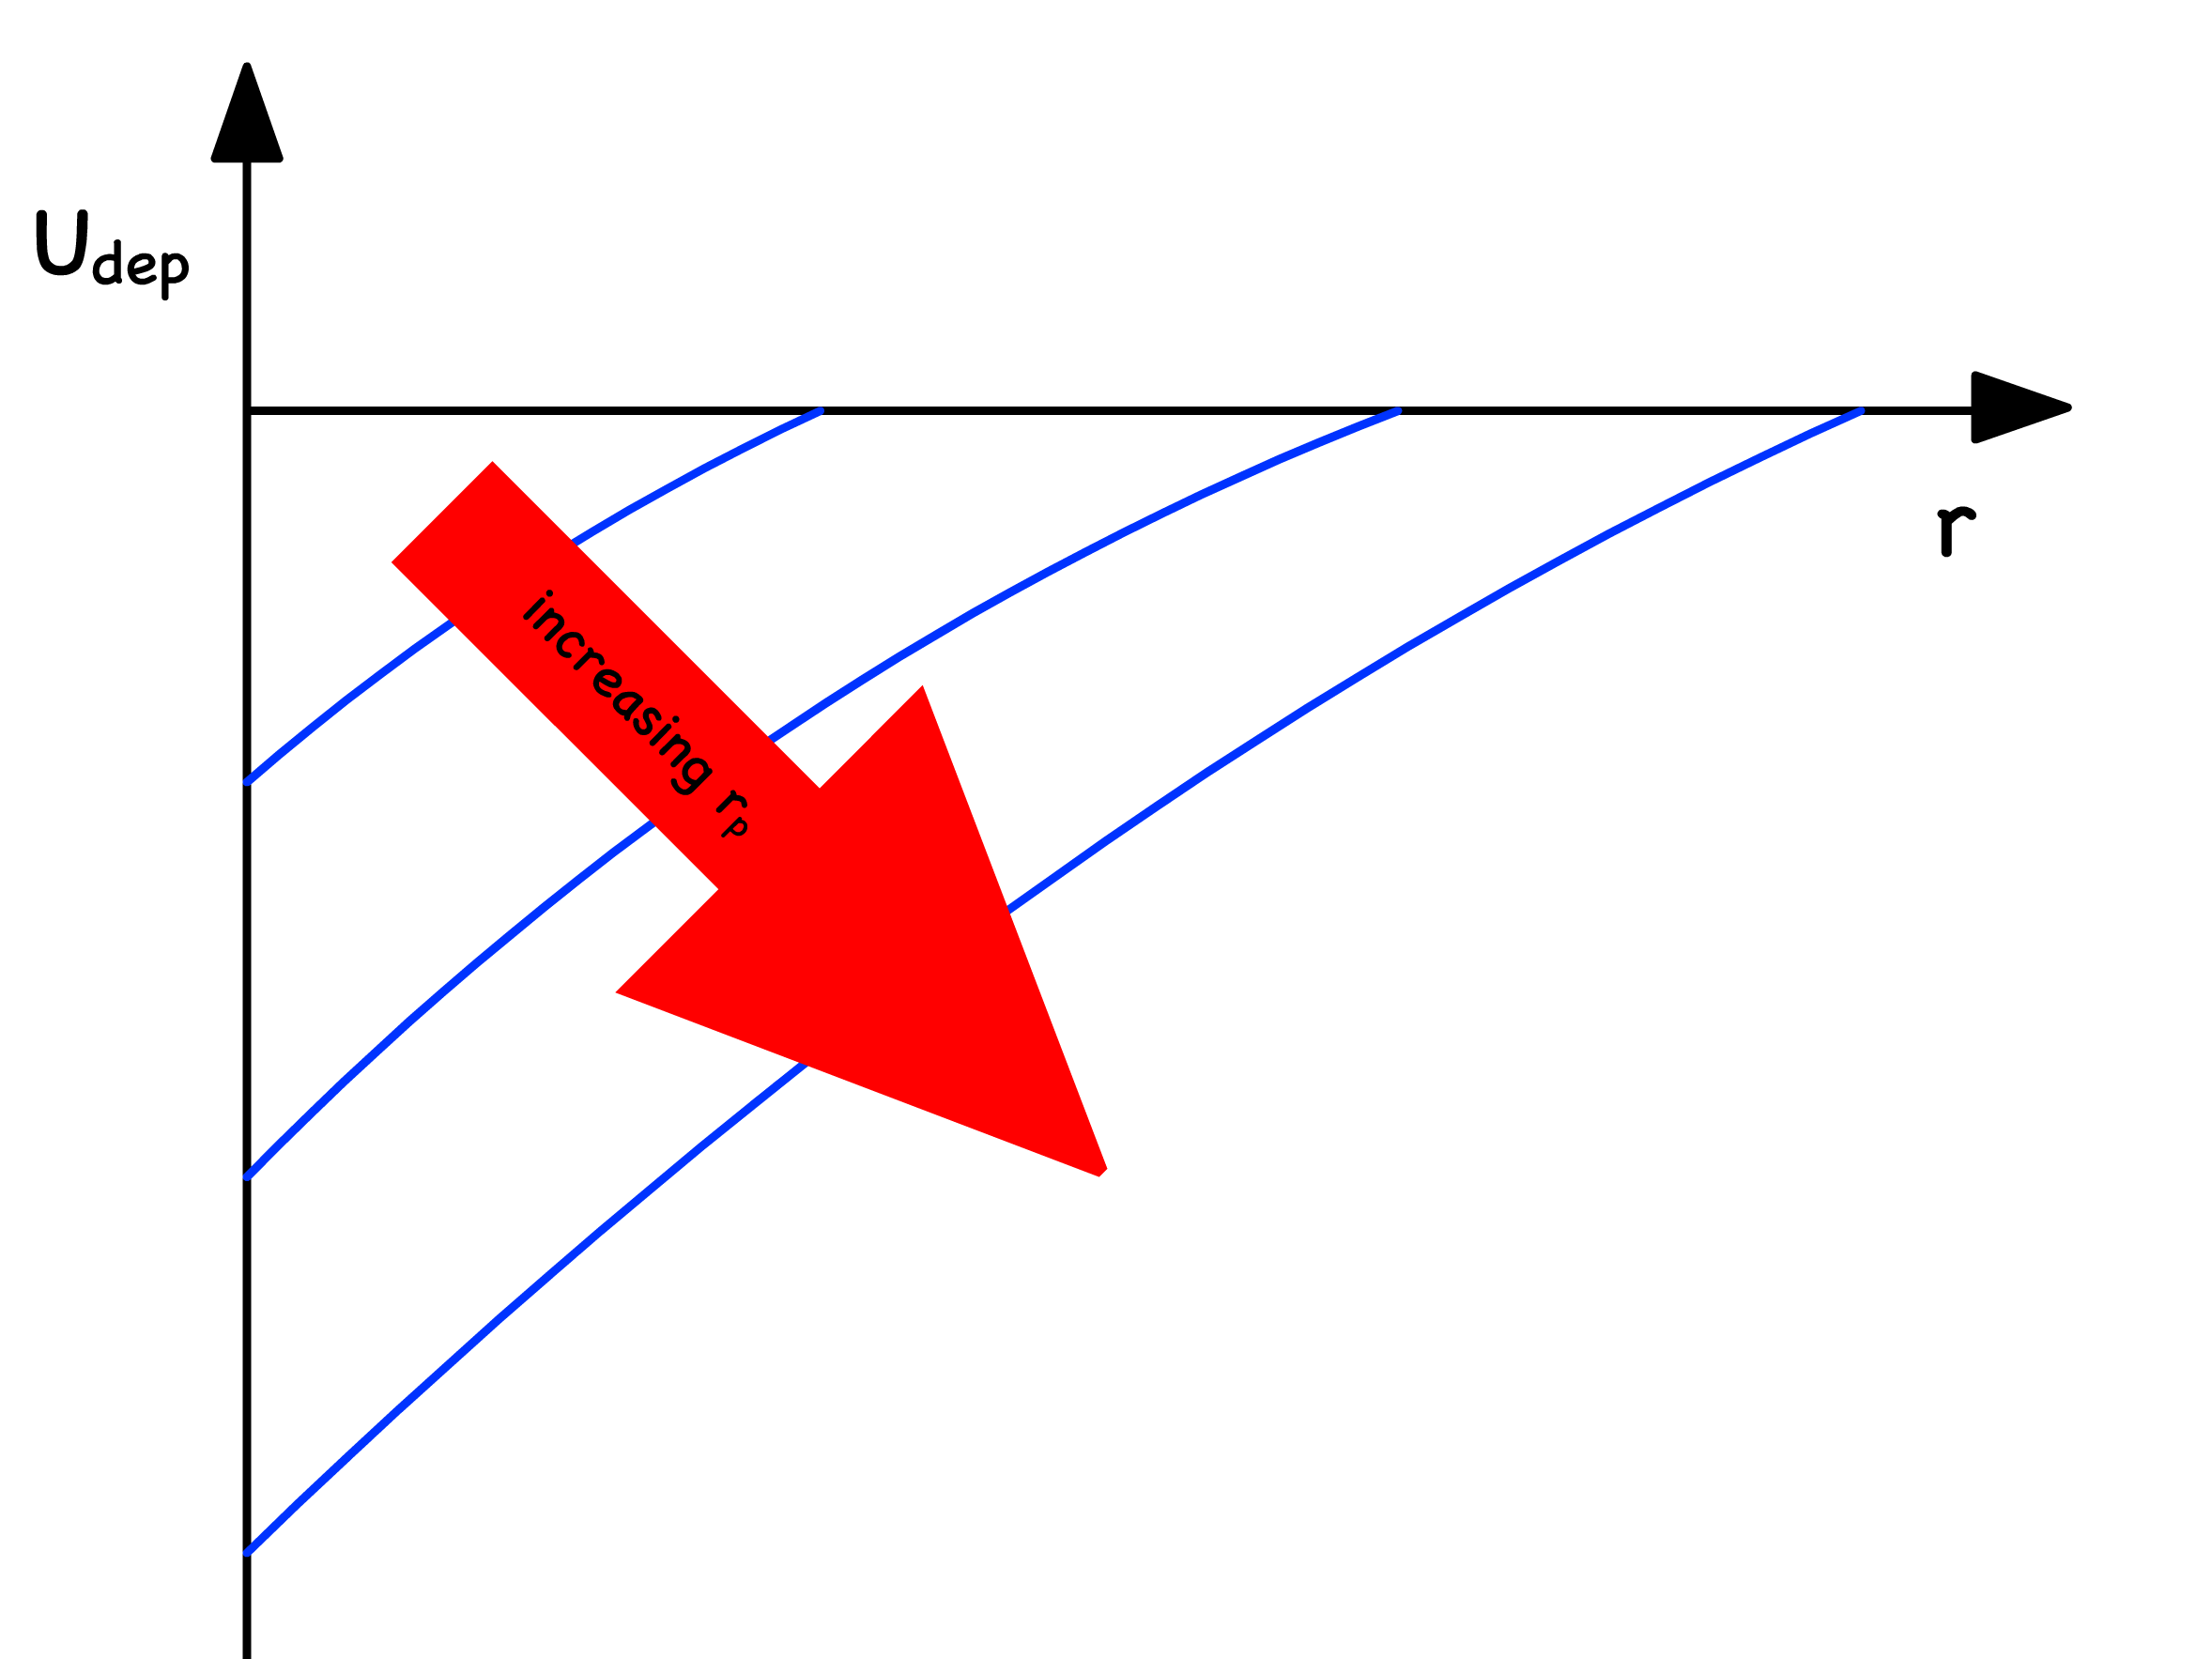
We can also then express the potential associated with the depletion force as a function of
- is the total volume between the colloids from which the non-adsorbing particles are excluded
The potential varies with the polymer/colloid size ratio
- A larger polymer radius for a fixed colloid radius means there is a larger volume in the depletion region, increasing the range/distance of interactions, preventing coagulation, and stabilizing the colloid dispersion
- As polymer to colloid radius ratio increases, the range of interactions increases, which also decreases the density of the colloidal suspension and gives rise to the gas phase. The size ratio is given by
- This is evidenced by the presence of additional gas and liquid phases at higher size ratios (and excluded volume interactions), and the longer range intearctions stabilizing the critical point of the fluid phase.
- The strength of depletion is zero for . Hence, the range depends on the polymer size
¶ Polymers
A universal behaviour amongst the variety of types of polymers occurs when we consider is the overall dimension of the polymer chain
- We are interested in knowing what the chain length of polymer would be under different circumstances
¶ Freely-Jointed-Chain Model
A few key assumptions are made in this model
- The average square of end-end distance of polymer chains, indicates characteristic size of a polymer in solution
- Bonds do not interact between chains but the chain has kinetic energy
- Angles between chains are independent of eachother
- The only contribution to the free eenergy is entropic
In this model, we consider the chain to be made up of links, each of which has a length
- Different links have independent orientations, thus the path of polymer in space is a random walk
The end-to-end vector is simply the sum of the jump vectors , which represent the direction and size of each link in the chain
- The mean end-to-end distance is given by
- If the orientations of different links are completely independent of each other, the cross-terms disappear when the average is taken
- This equation is surprisingly intuitive since is just the degree of polymerization, and is the monomer-monomer segment length . This equation has the same vibe as
The Freely-Jointed-Chain model is very unphysical because successive links in a polymer chain is not free to rotate, but instead are constrained to have certain definite bond angles
- Since the orientation of each segement is not completely uncorrelated, the average of the cross term, , will not be cancelled out completely
- To adjust for this error, we devise the Kuhn length
Statistically independent segments can be grouped with a standard length known as the Kuhn length, a_
- The Kuhn length can be thought of as the effective segment / monomer size
- The characteristic ratio measures the flexibility of a polymer
- for a Freely-Jointed-Chain polymer
- In the stretched state the Kuhn length is r_{K} = N_{K}^{1/2}a_
Thermodynamics
The thermodynamic properties of the model can be derived by acknowledging that in the limits of large , the distribution of possible end-to-end distance is Gaussian
The entropy can be derived using
- Since this model assumes that there is no internal energy, the Helmholtz free energy is just the entropy times temperature
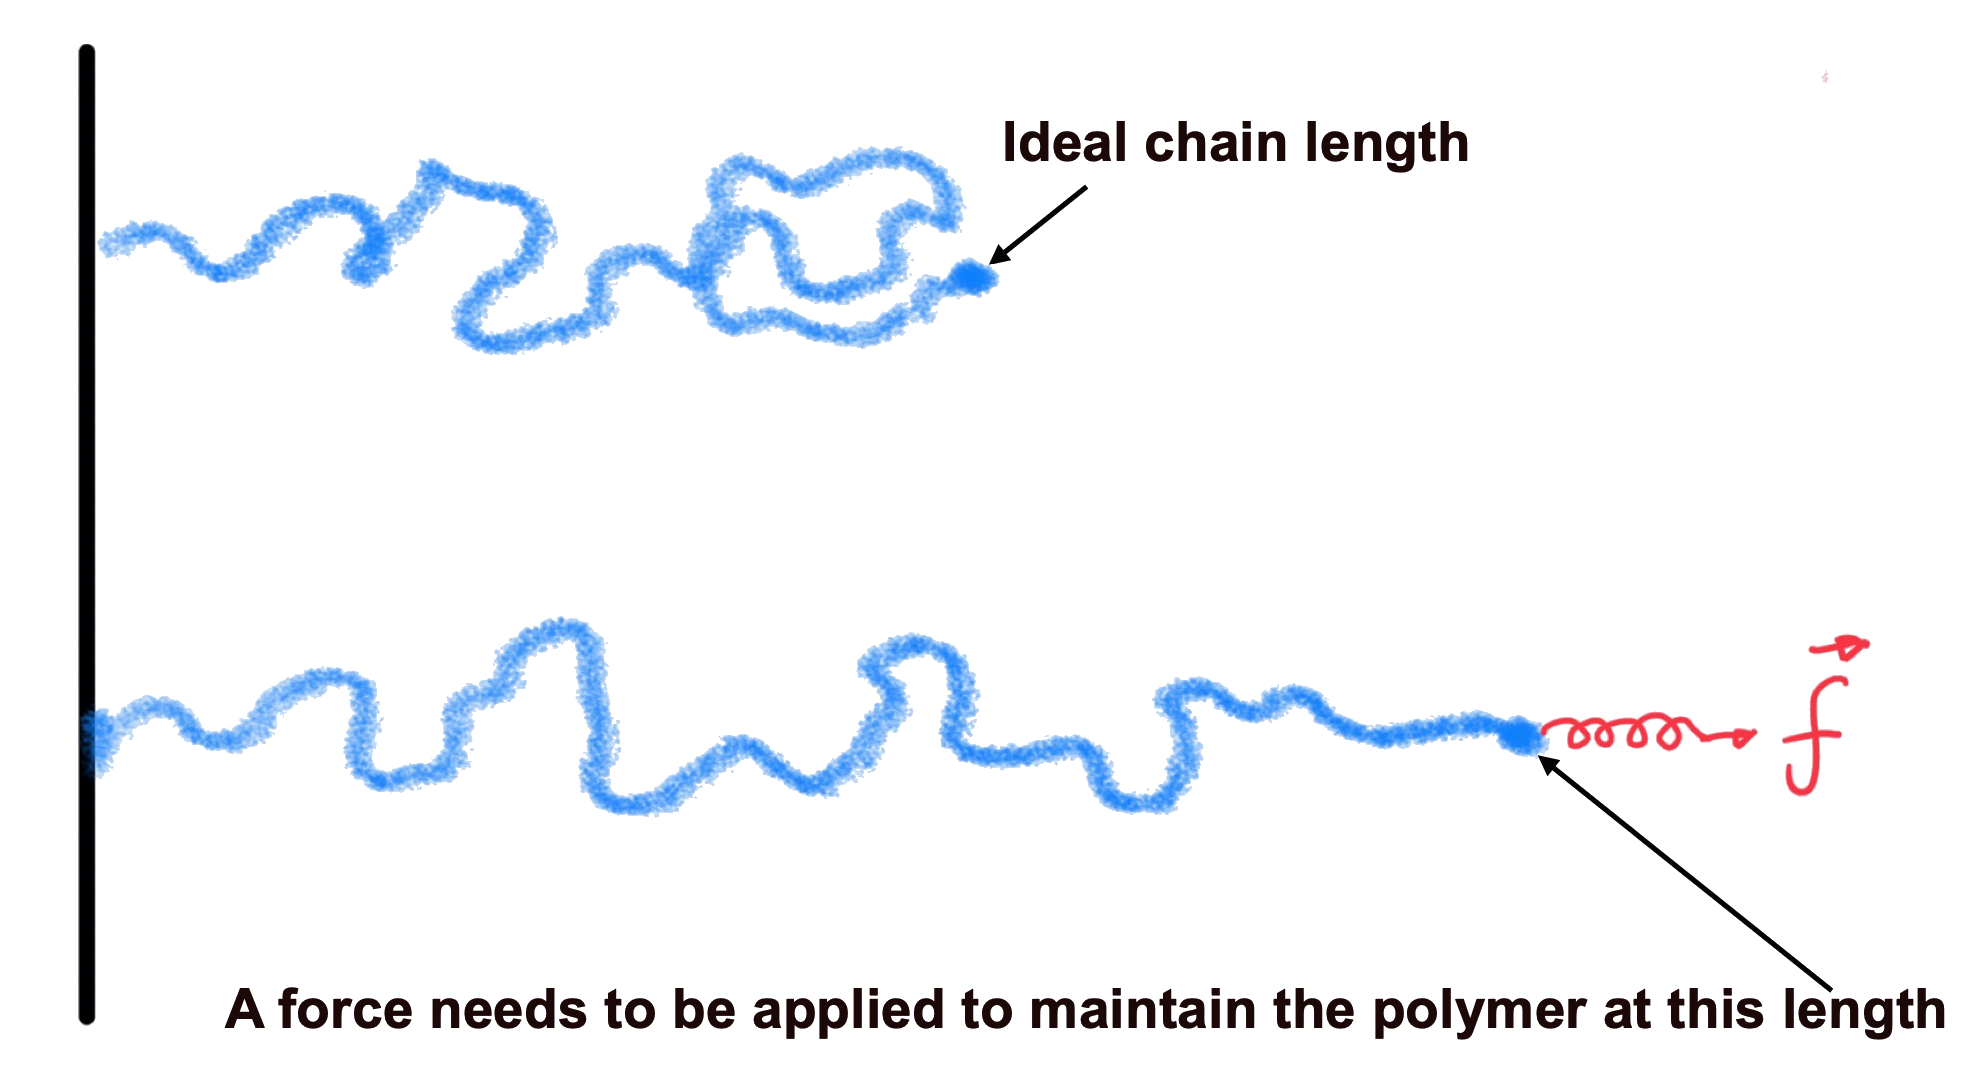
Stretching a polymer beyond its equilibrium distance, reduces its entropy, so the polymer seeks to maximize its entropy at any given end to end distance
- A force is required to achieve this stretching / change in end-to-end distance. This is defined as
- This is a harmonic force valid at small displacements from equilibrium, where the force constant is
¶ Excluded Volume Interaction
Deviations between Kuhn lengths predicted by Freely-Jointed-Chain model and experiment at larger displacements indicate the elastic response of polymers are not purely entropic, there are other factors which change end-to-end distance
Our adjustment of the Freely-Jointed-Chain Model allows us to take into account of the interactions between neighbouring links, but not the interaction between distant points on the chain
- At the simplest level, we know that the chain cannot intersect itself and we call this the excluded volume effect
Polymer interactions between distant points in the chain result in swelling
- The size of a polymer increases proportional to the degree of polymerization
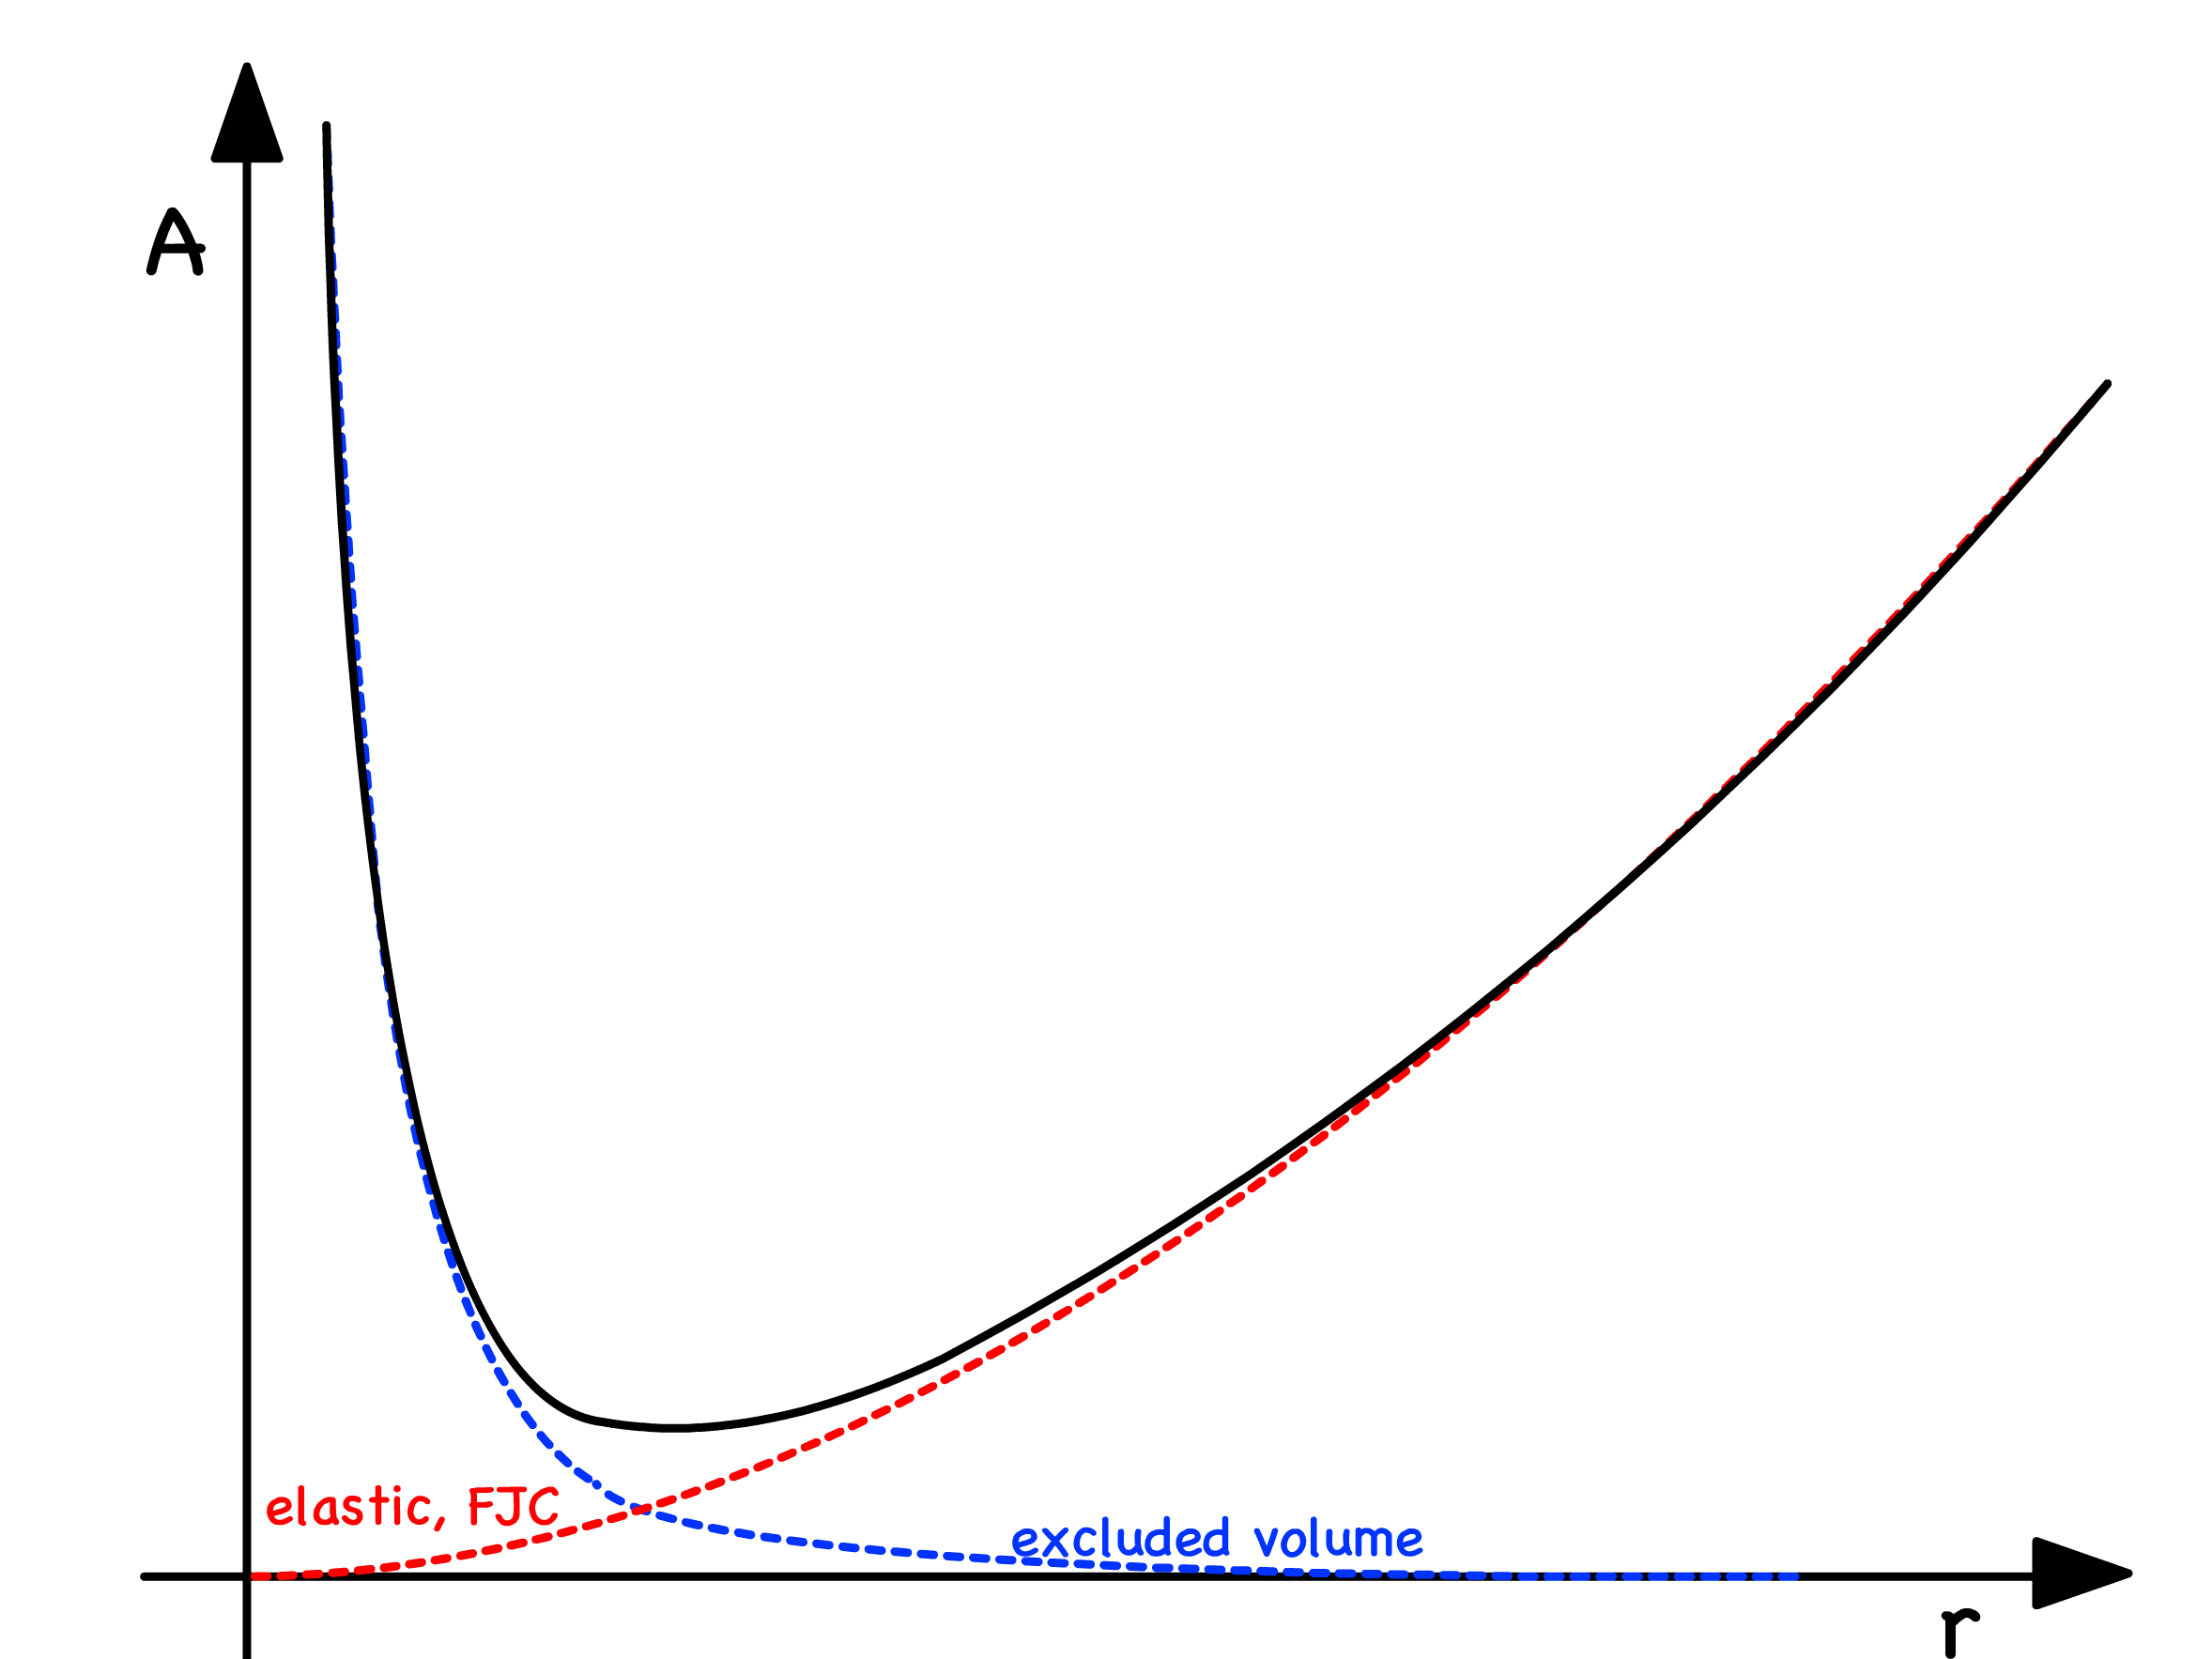
- The polymer size is also determined by a balance of excluded volume and elastic interactions which can be expressed in the Helmholtz free energy
- The excluded volume interaction causes stretching, and the polymer entropy opposes stretching ( preserves elasticity )
- The turning point value is the root-mean-squared length, , and it is now given by
¶ Polymer-Polymer and Polymer-Solvent Interactions
Finally, we shall address the energetic interaction between neighboring polymer segments or between polymer segments and neighboring solvent molecules
- We can use the lattice pairwise interaction assumption to define the Flory-Huggins parameter, and write the interaction energy as a function of chain length
- Combining the energetic interaction and the excluded volume effect will give us a Helmholtz free energy expression
Thus, according to the value of , three different kind of behaviours can arise
1.
- The polymer is expanded, with a radius ≈
- This is referred to as the good solvent behaviour
2.
- The repulsive effect from the excluded volume interaction is exactly cancelled out by the attractive polymer-solvent interaction
- The polymer chain is an ideal random walk, with a radius ≈
- This is referred to as the theta condition
3.
- The attractive polymer-solvent interaction dominates over the repulsive effect from the excluded volume interaction
- The chain collapses to form a compact globule, with a radius ≈
- This is referred to as a bad solvent behaviour
