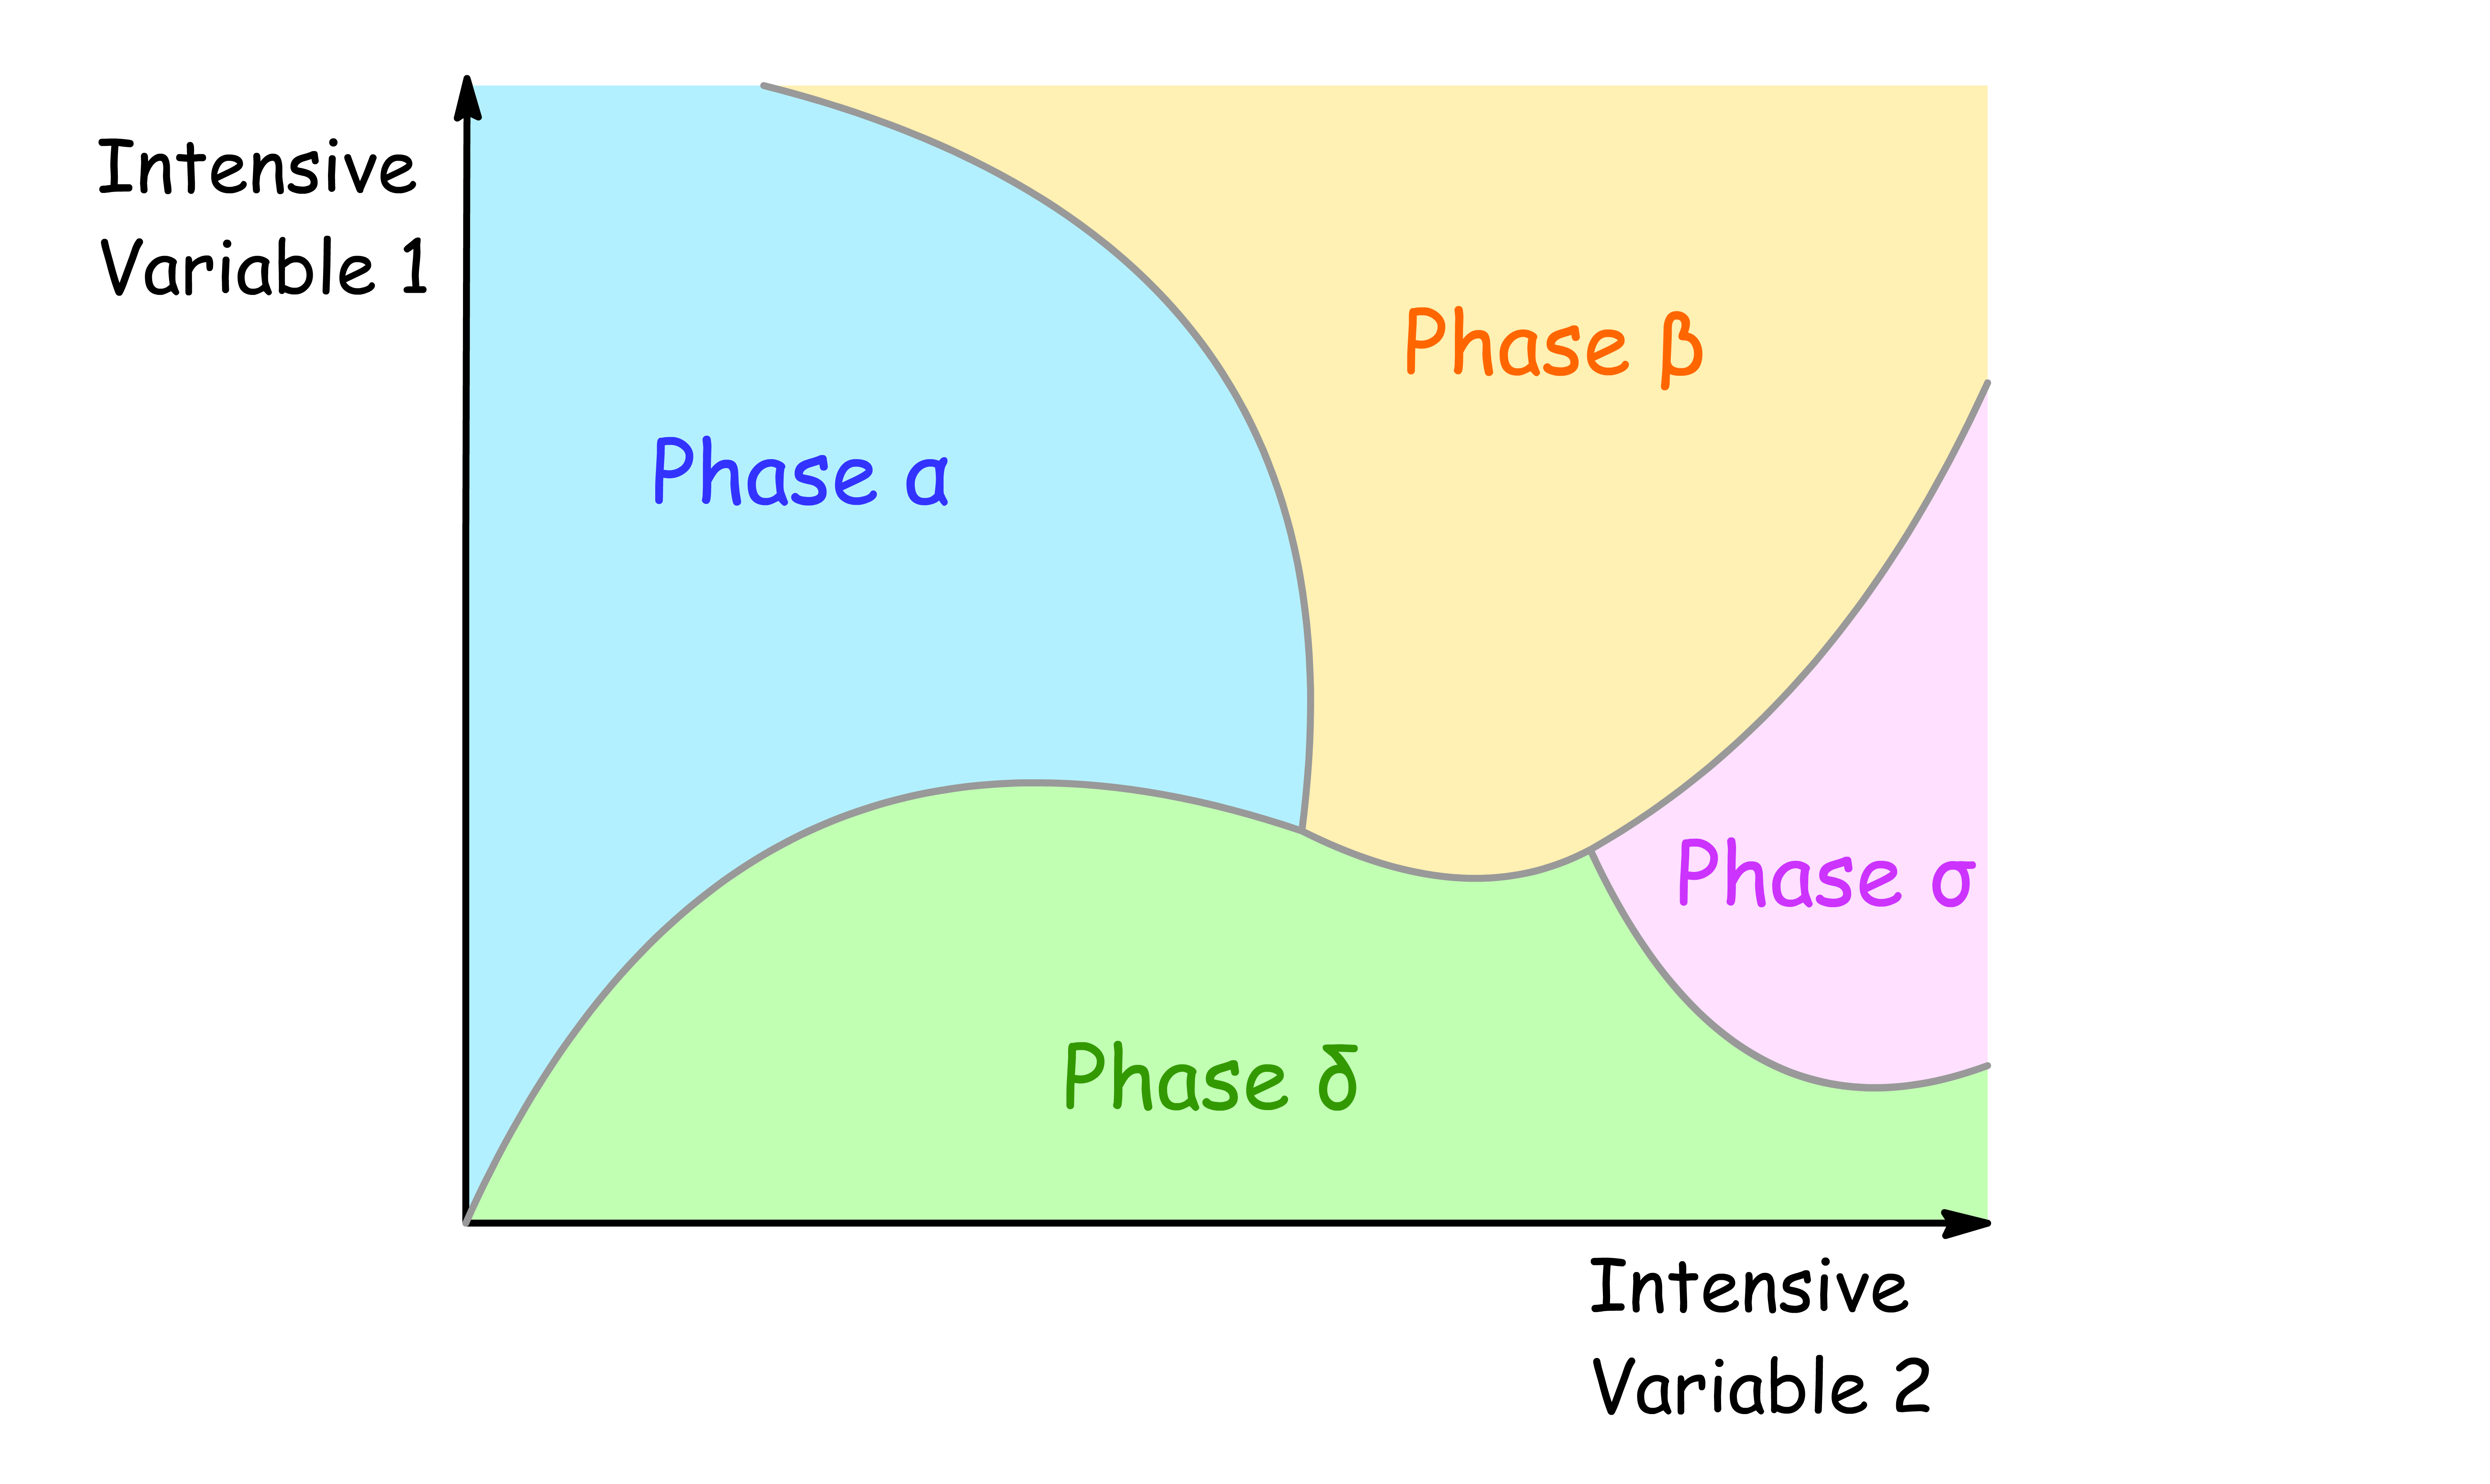
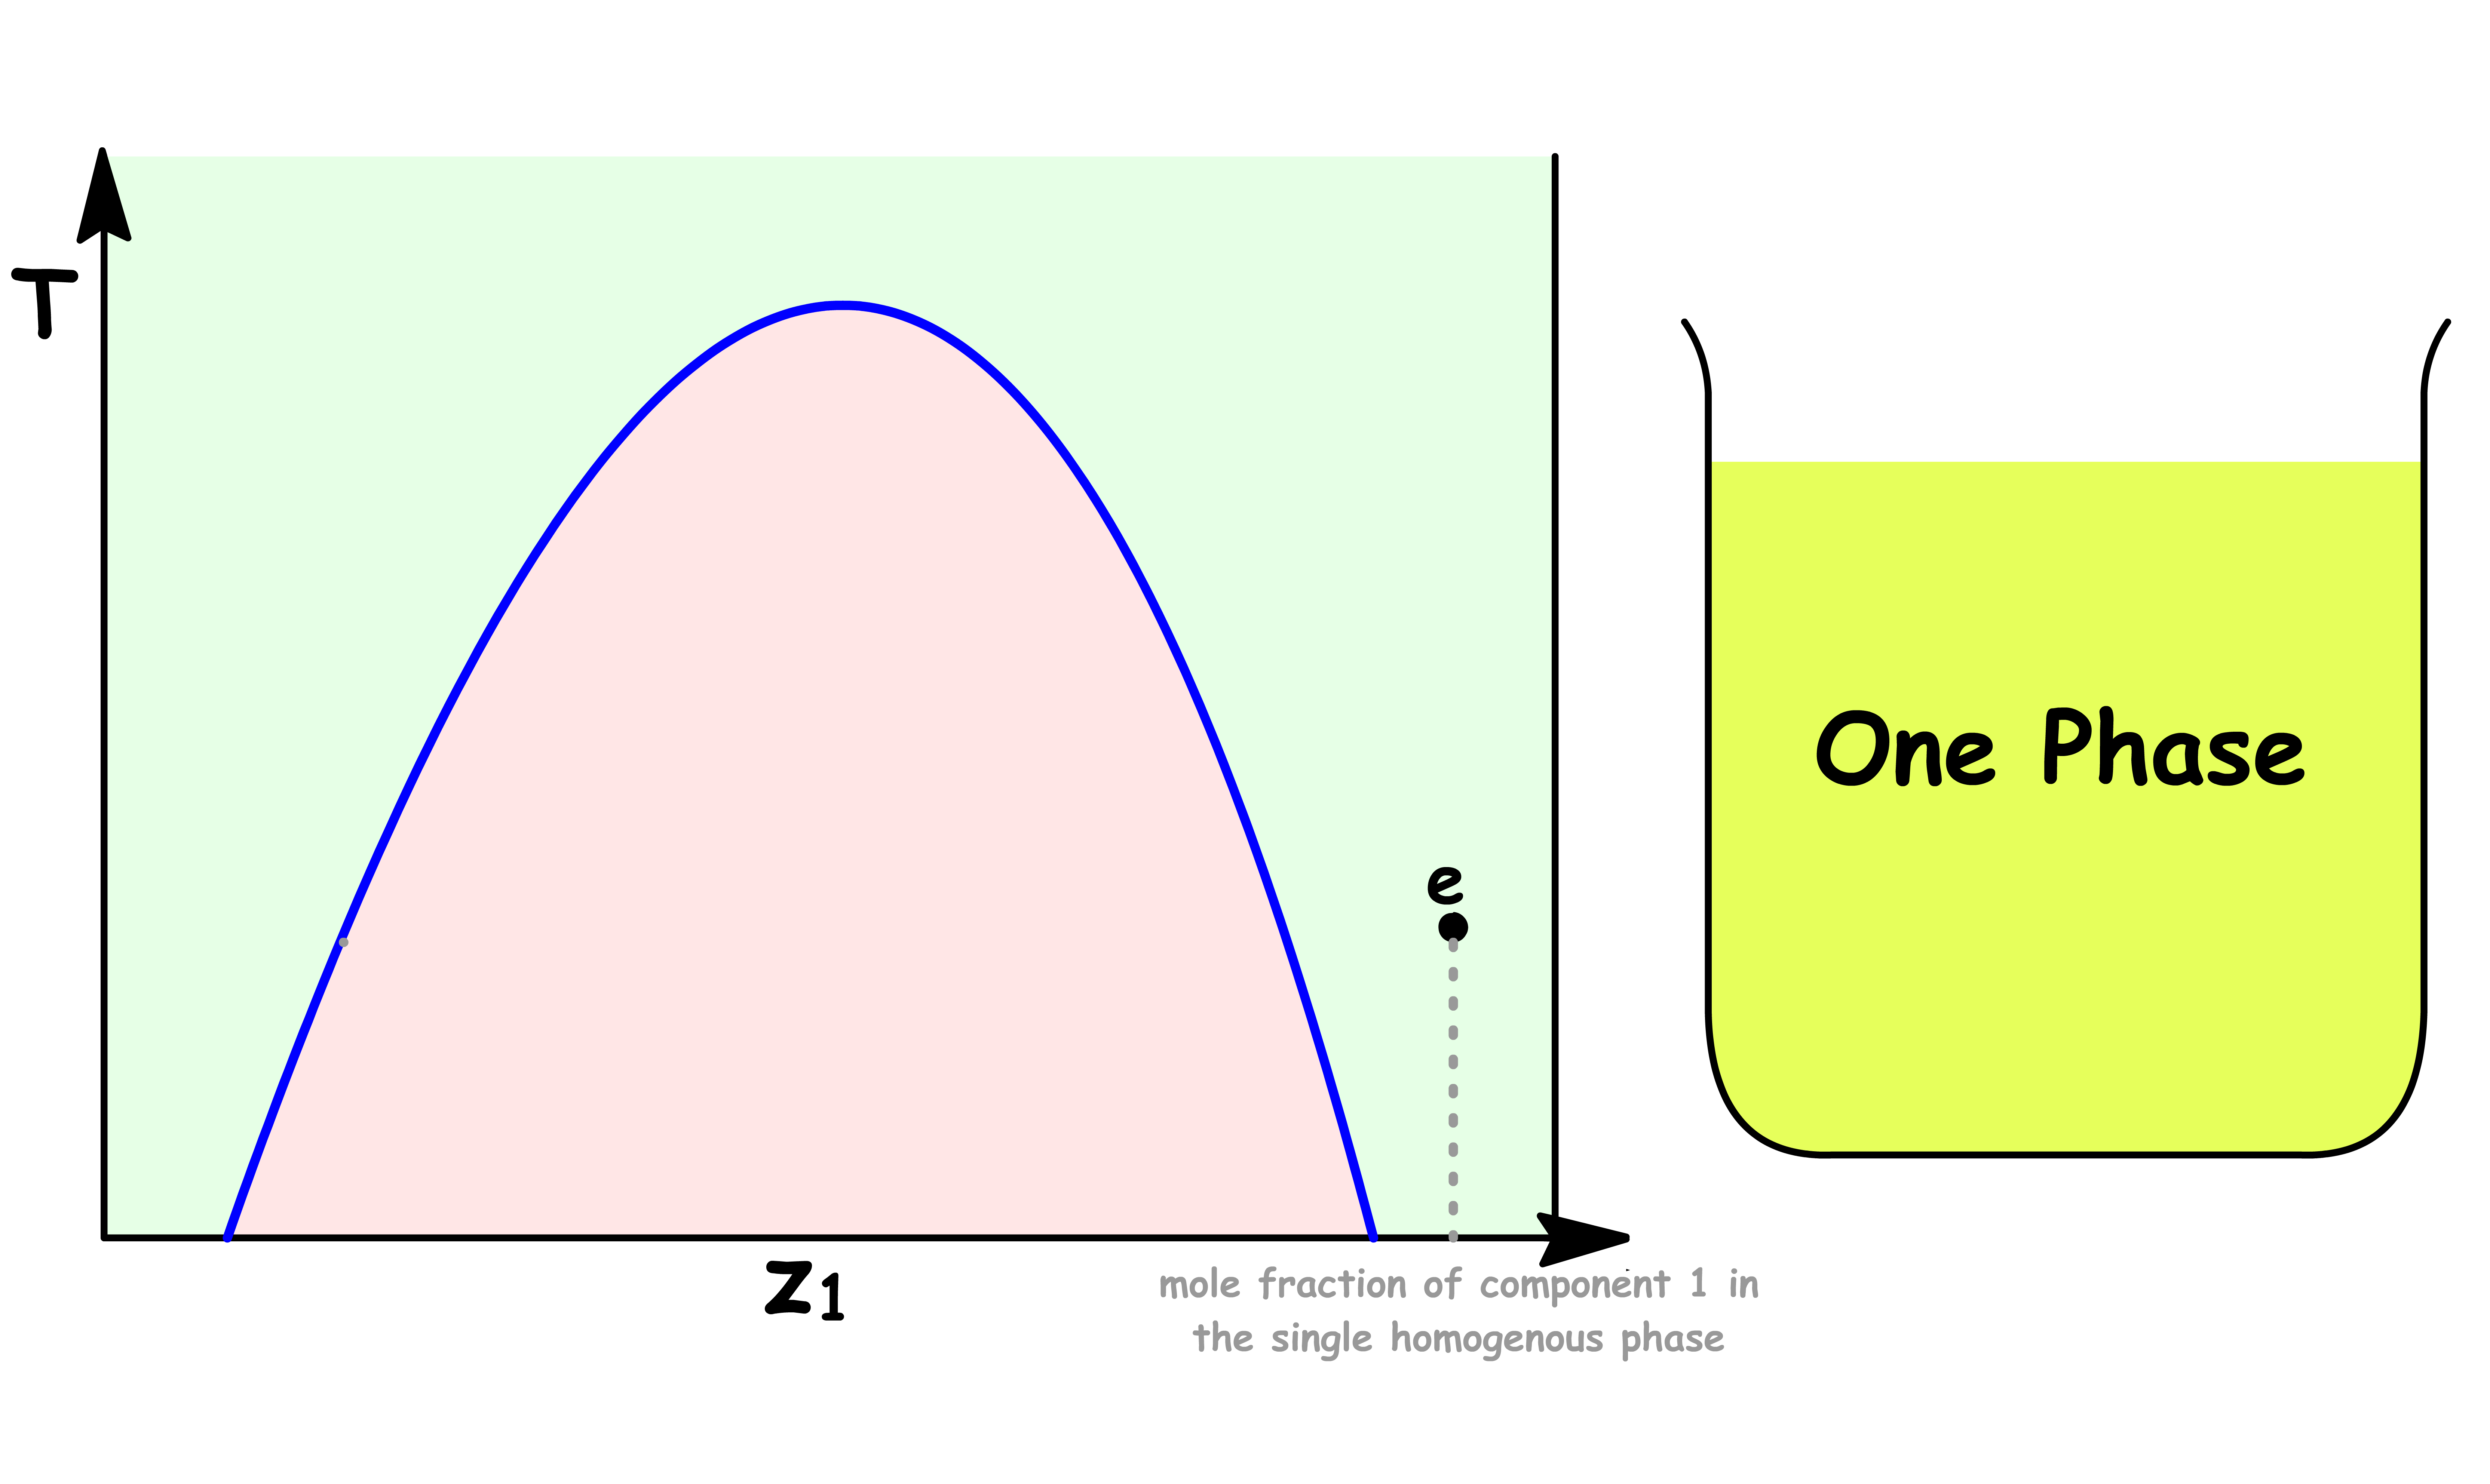
Phase diagrams show regions of two chosen intensive variables at which the various phases of the system is stable
- Any two intensive variables can be chosen ( e.g. pressure, temperature, the mole fraction of any component, magnetic field ... )
- The lines separating the regions are called phase boundaries or coexistence curves, they show the values of the two corresponding intensive variables
¶ The Phase Rule
The Phase Rule describes the conditions of equilibrium for multiphase, multicomponent systems
¶ Degree of Freedom
The degree of freedom is the number of intensive variables that can be altered freely without the appearance or disappearance of a phase
- The concept of degree of freedom is best explained with examples
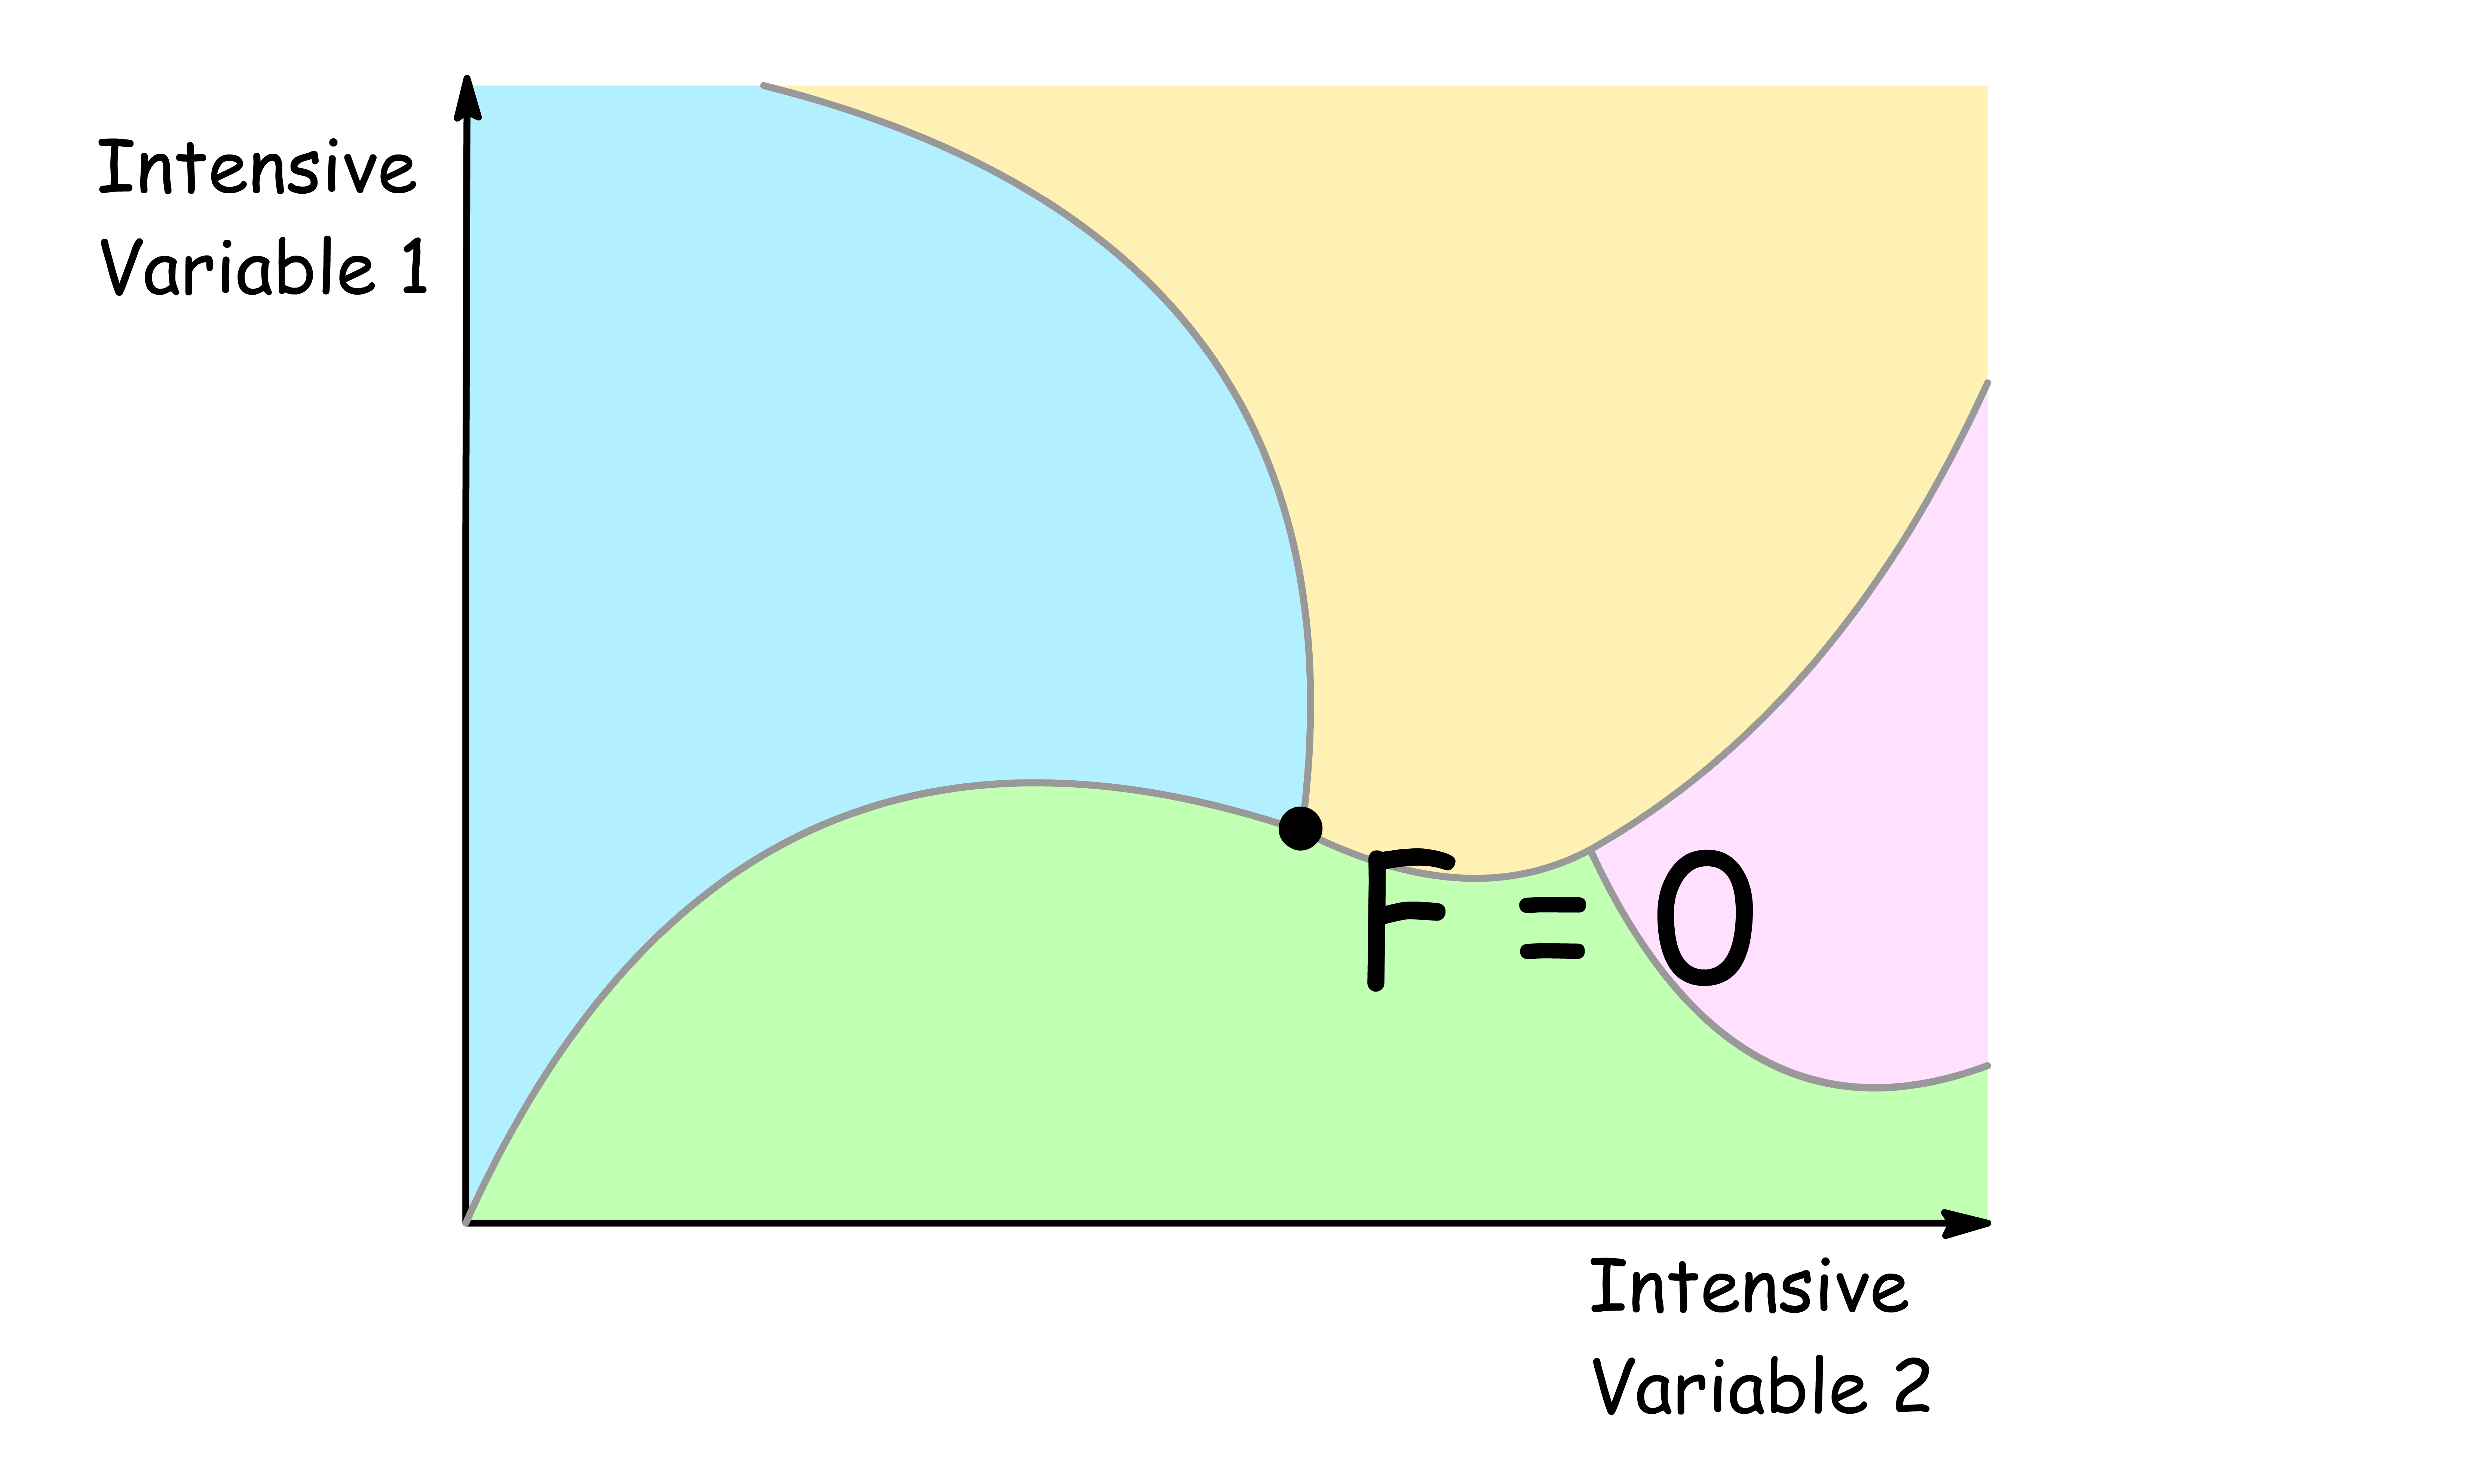
F = 0
- When there is no degree of freedom, changing the value of any intensive variable will result in the appearance or disappearance of a phase
- An example of a region with no degree of freedom is the triple point
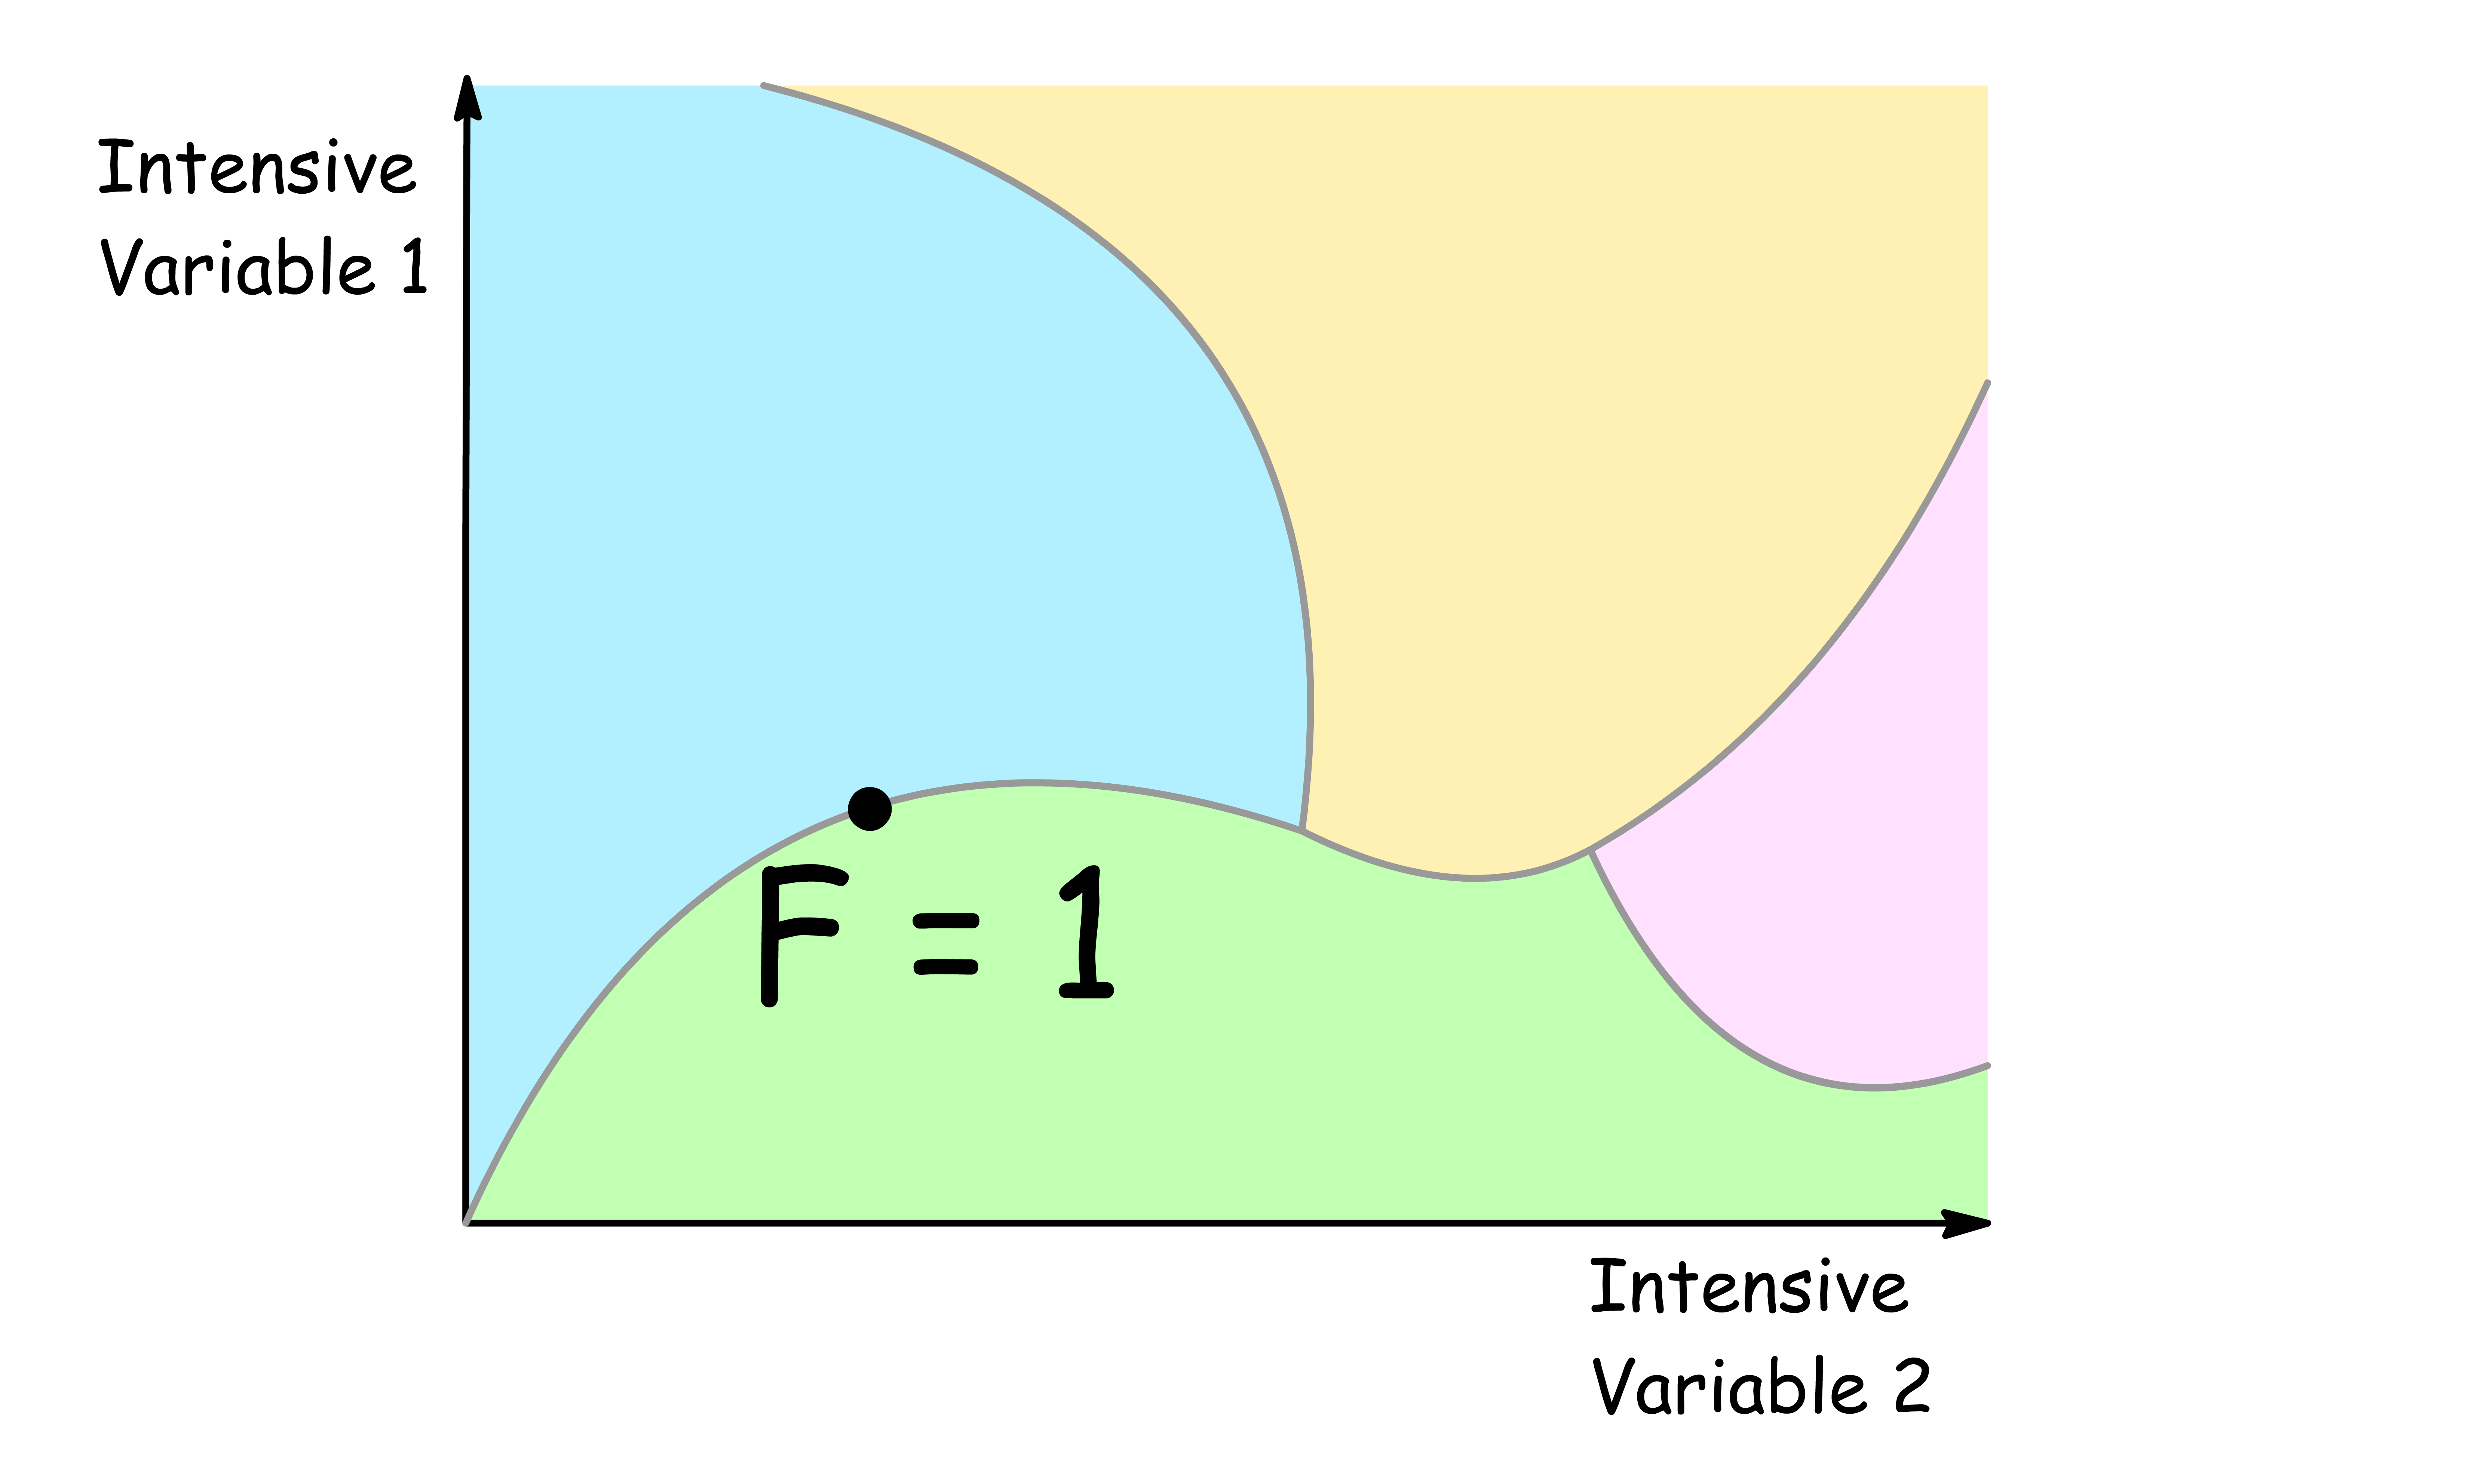
F = 1
- When the degree of freedom is one, we can freely alter one intensive variable
- When one of the intensive variables is specified, all other intensive variables are determined
- An example of a region with a degree of freedom of one is the coexistence curve
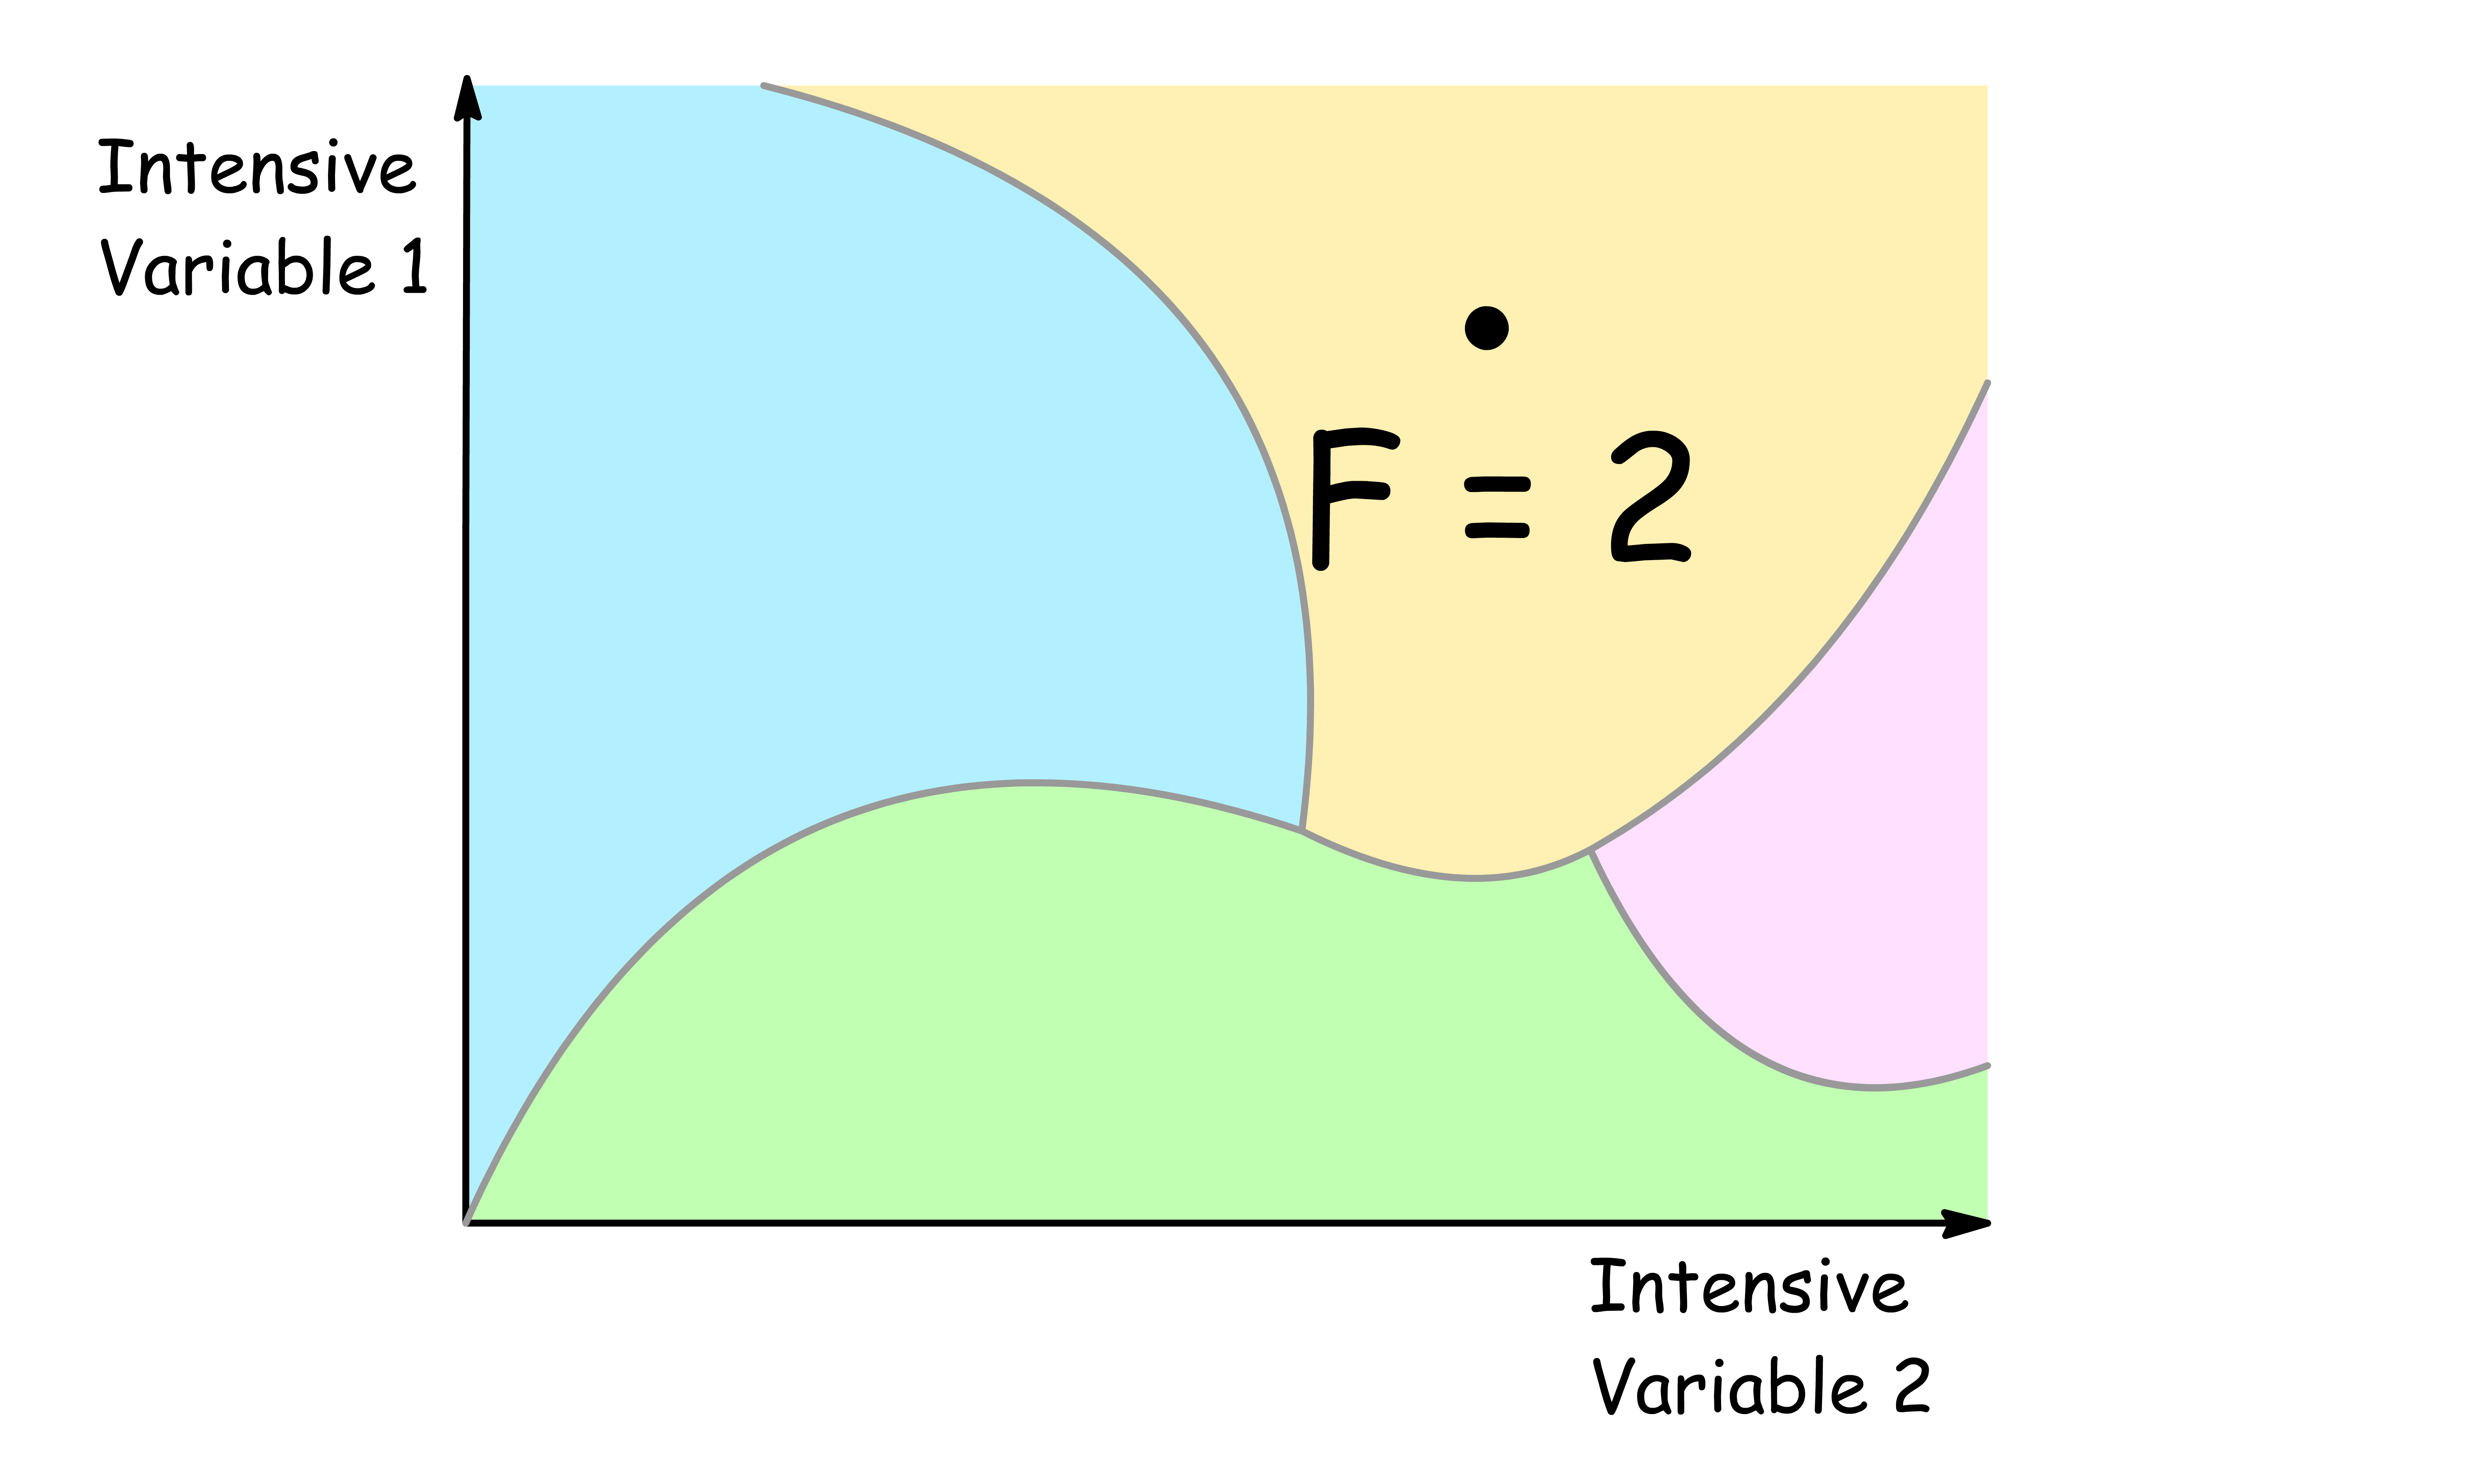
F = 2
- When the degree of freedom is two, we can freely alter two intensive variable
- When two of the intensive variables is specified, all other intensive variables are determined
- An example of a region with a degree of freedom of two is the region where there is only one phase in a single component system
¶ Composition Phase Diagram for Ideal Solutions
For a one component system, we need temperature and pressure to describe the composition
For a binary system, we need temperature, pressure and one of the mole fraction
¶ Pressure-Composition Phase Diagram
At any given temperature, the phase of the system depends on the external pressure and mole fractions
¶ Constructing the Pressure-Composition Phase Diagram for Ideal Solutions
- We shall focus on the phase diagram of binary systems
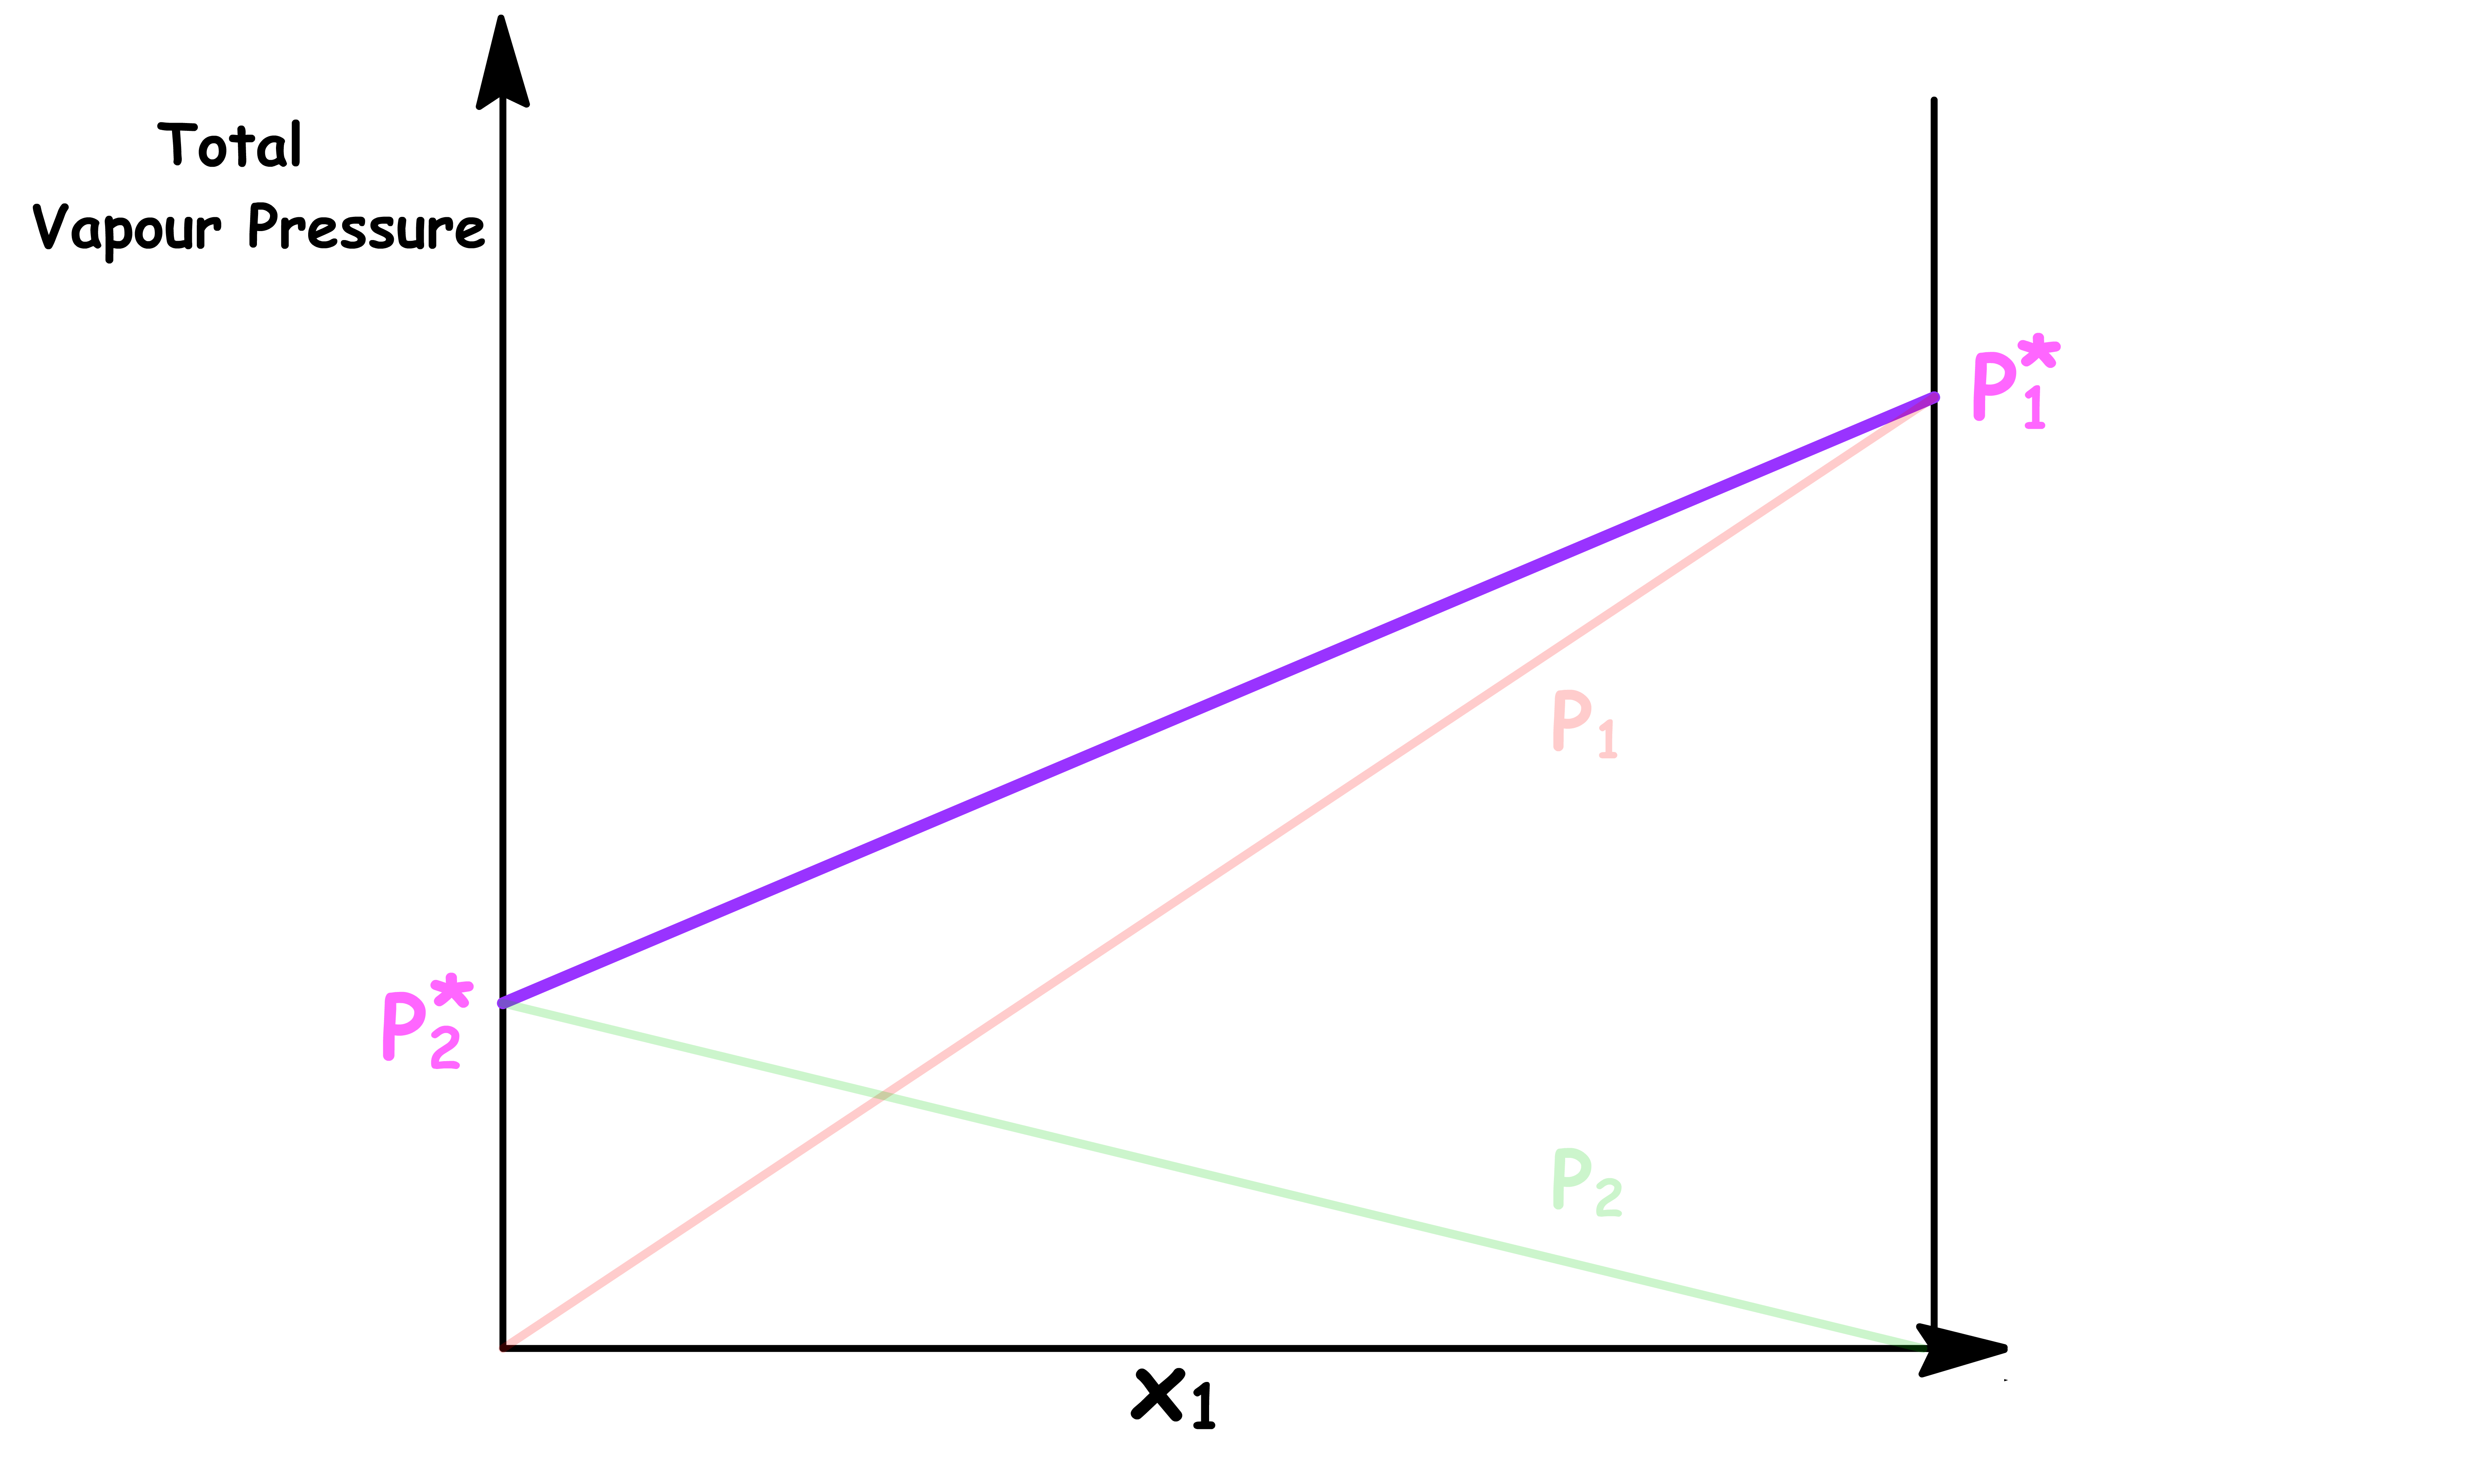
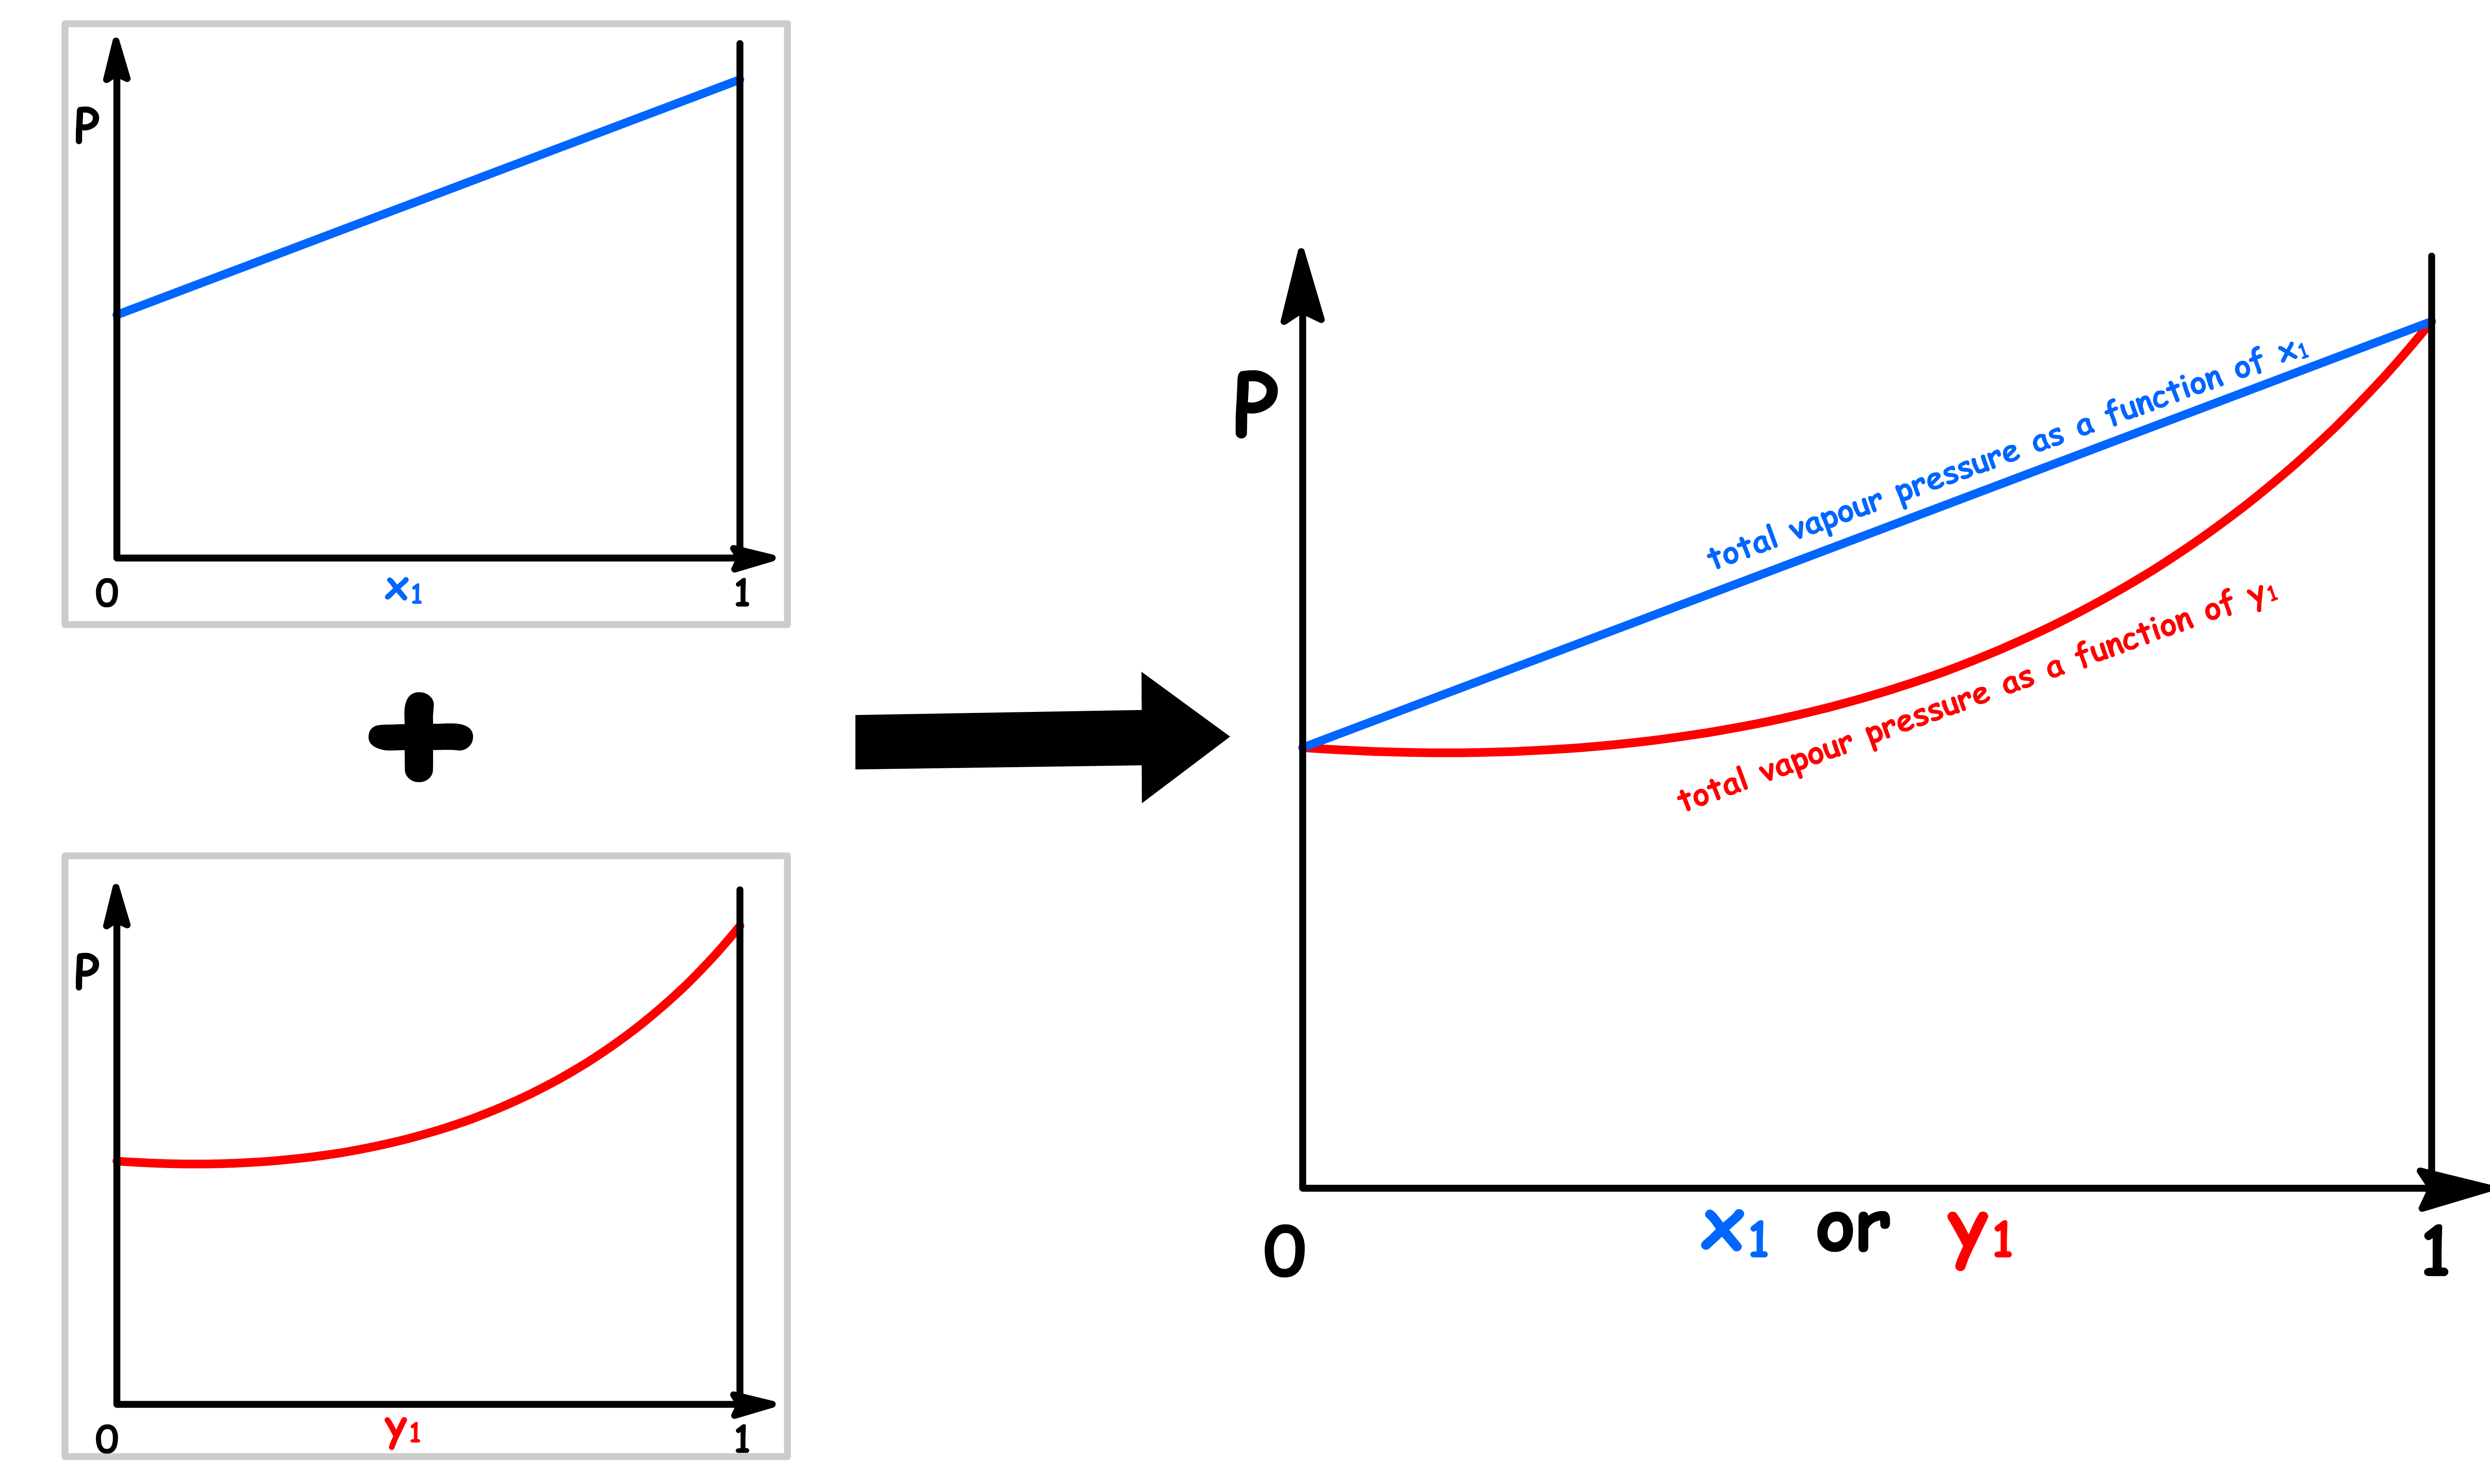
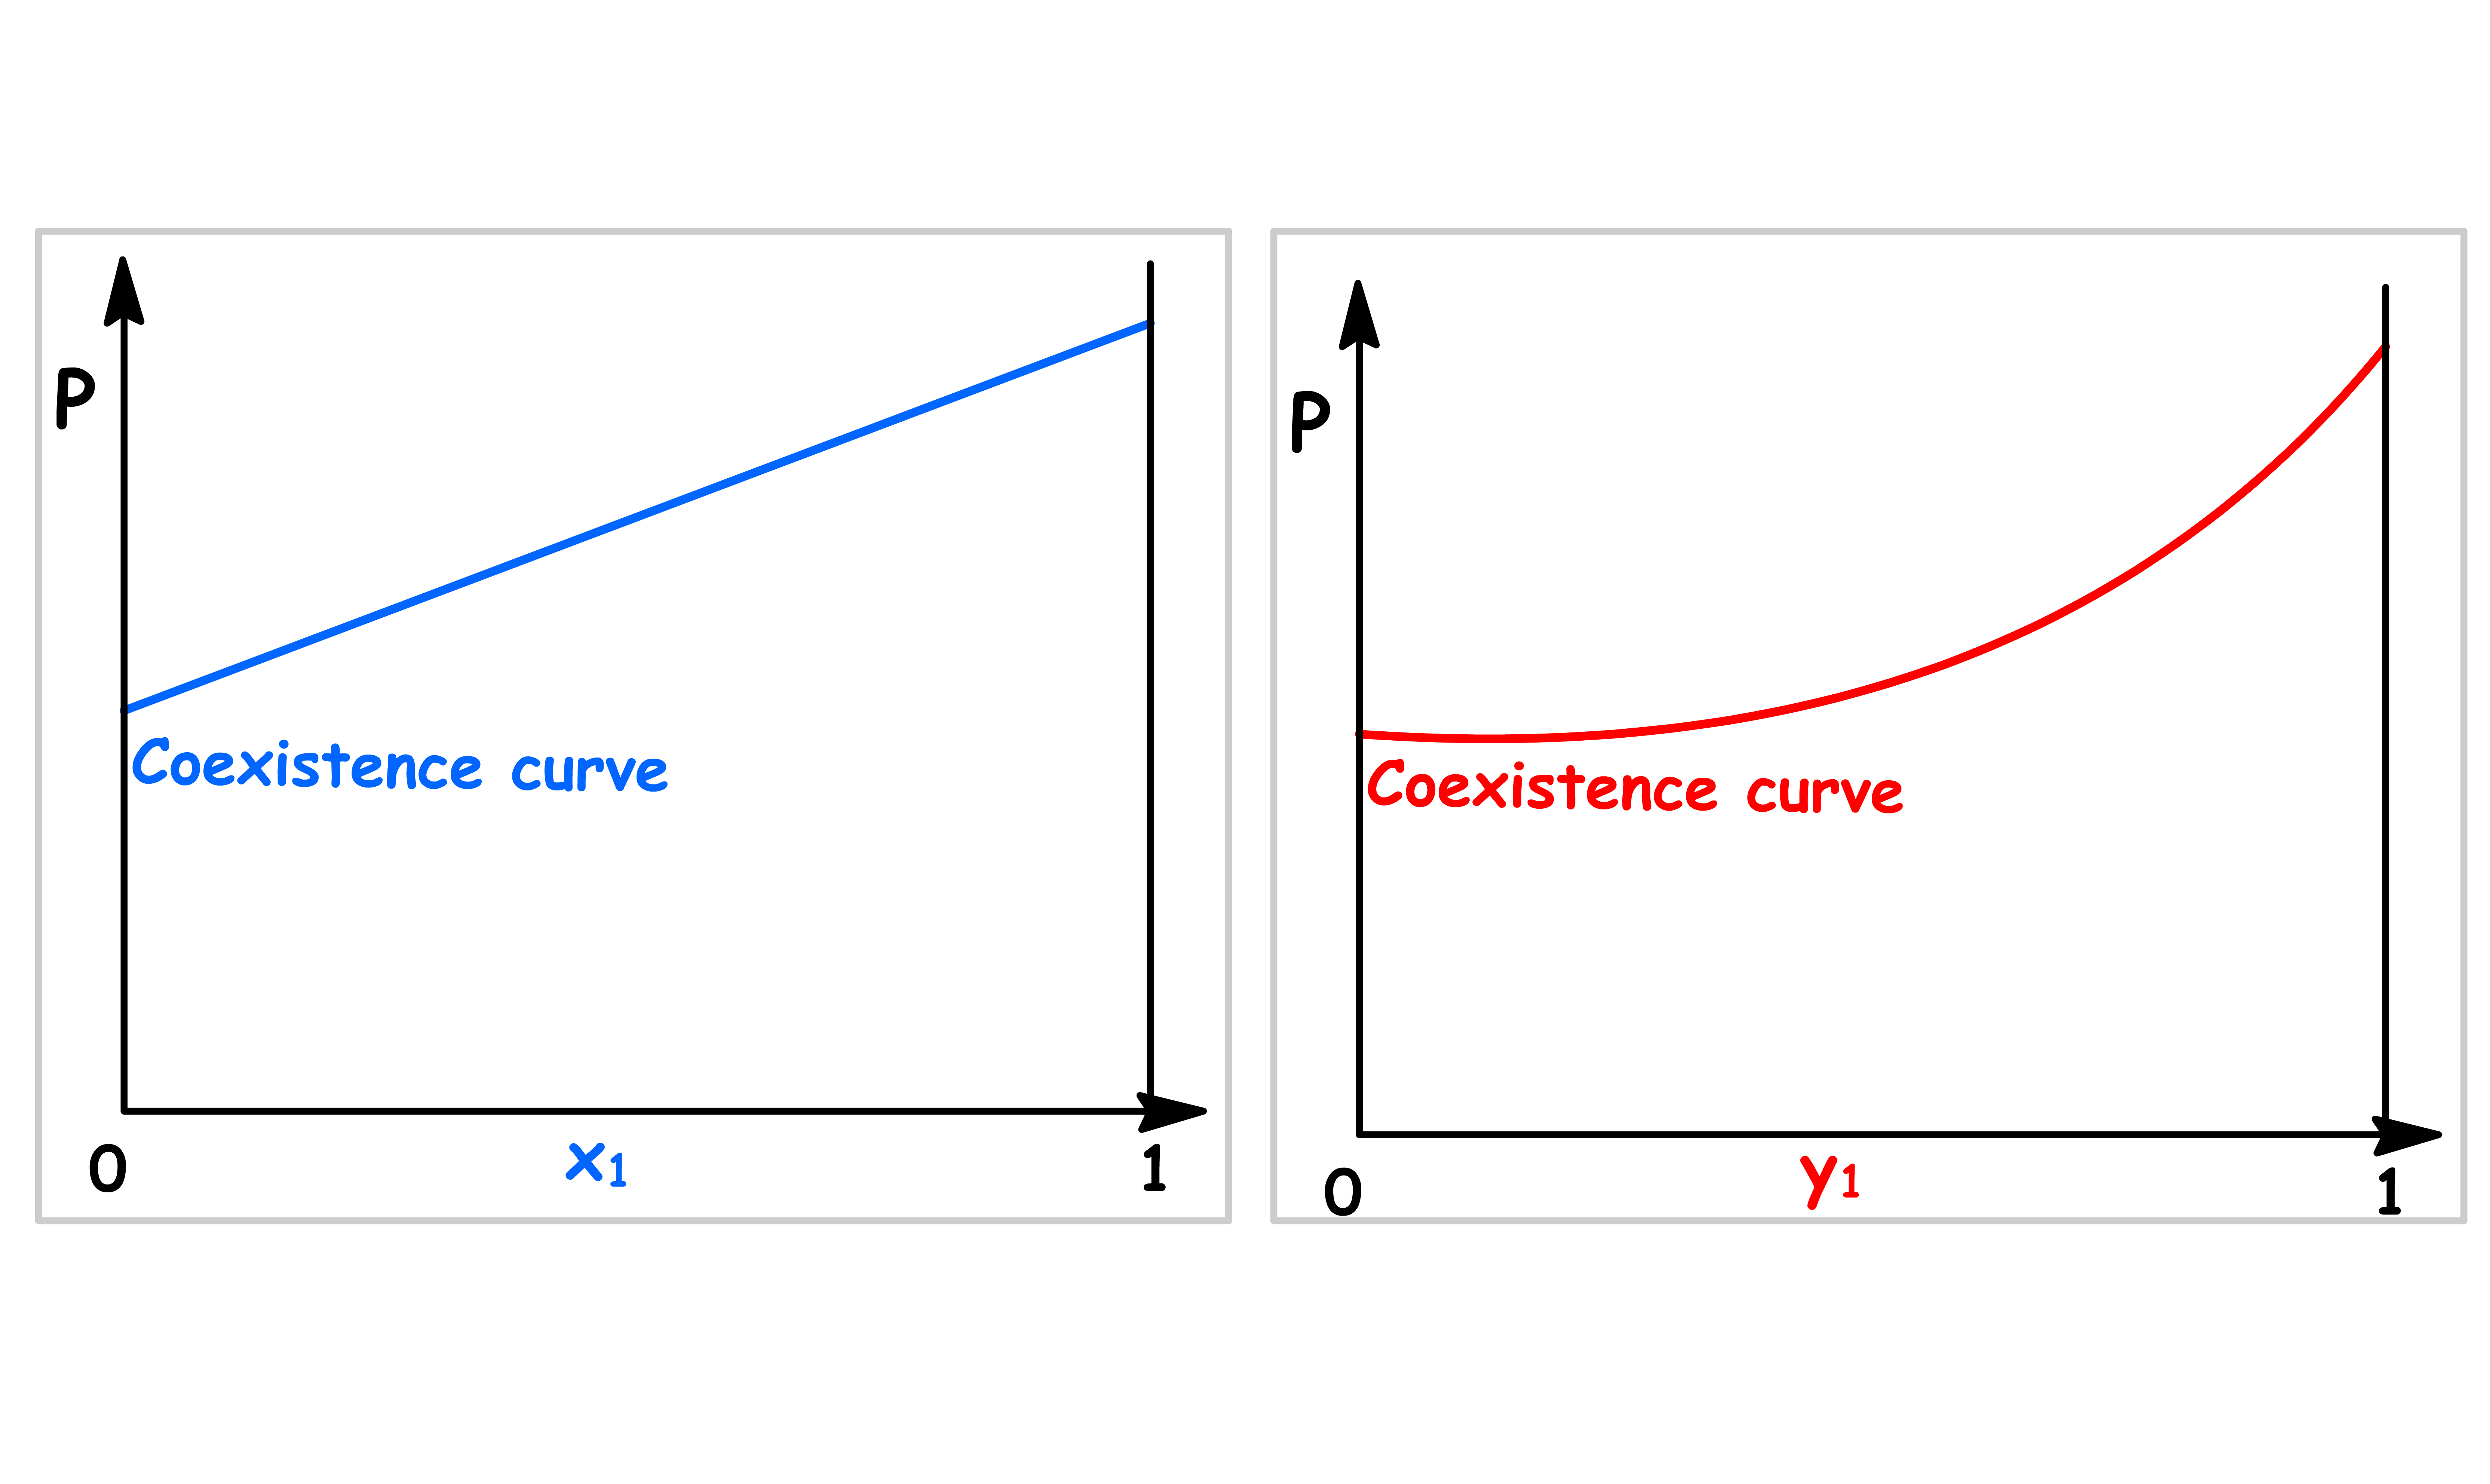
Pressure vs Mole Fraction in Solution ( x1 )
The relation between the total vapour pressure and mole fraction in a binary ideal solution is given by Raoult's Law and Dalton's Law
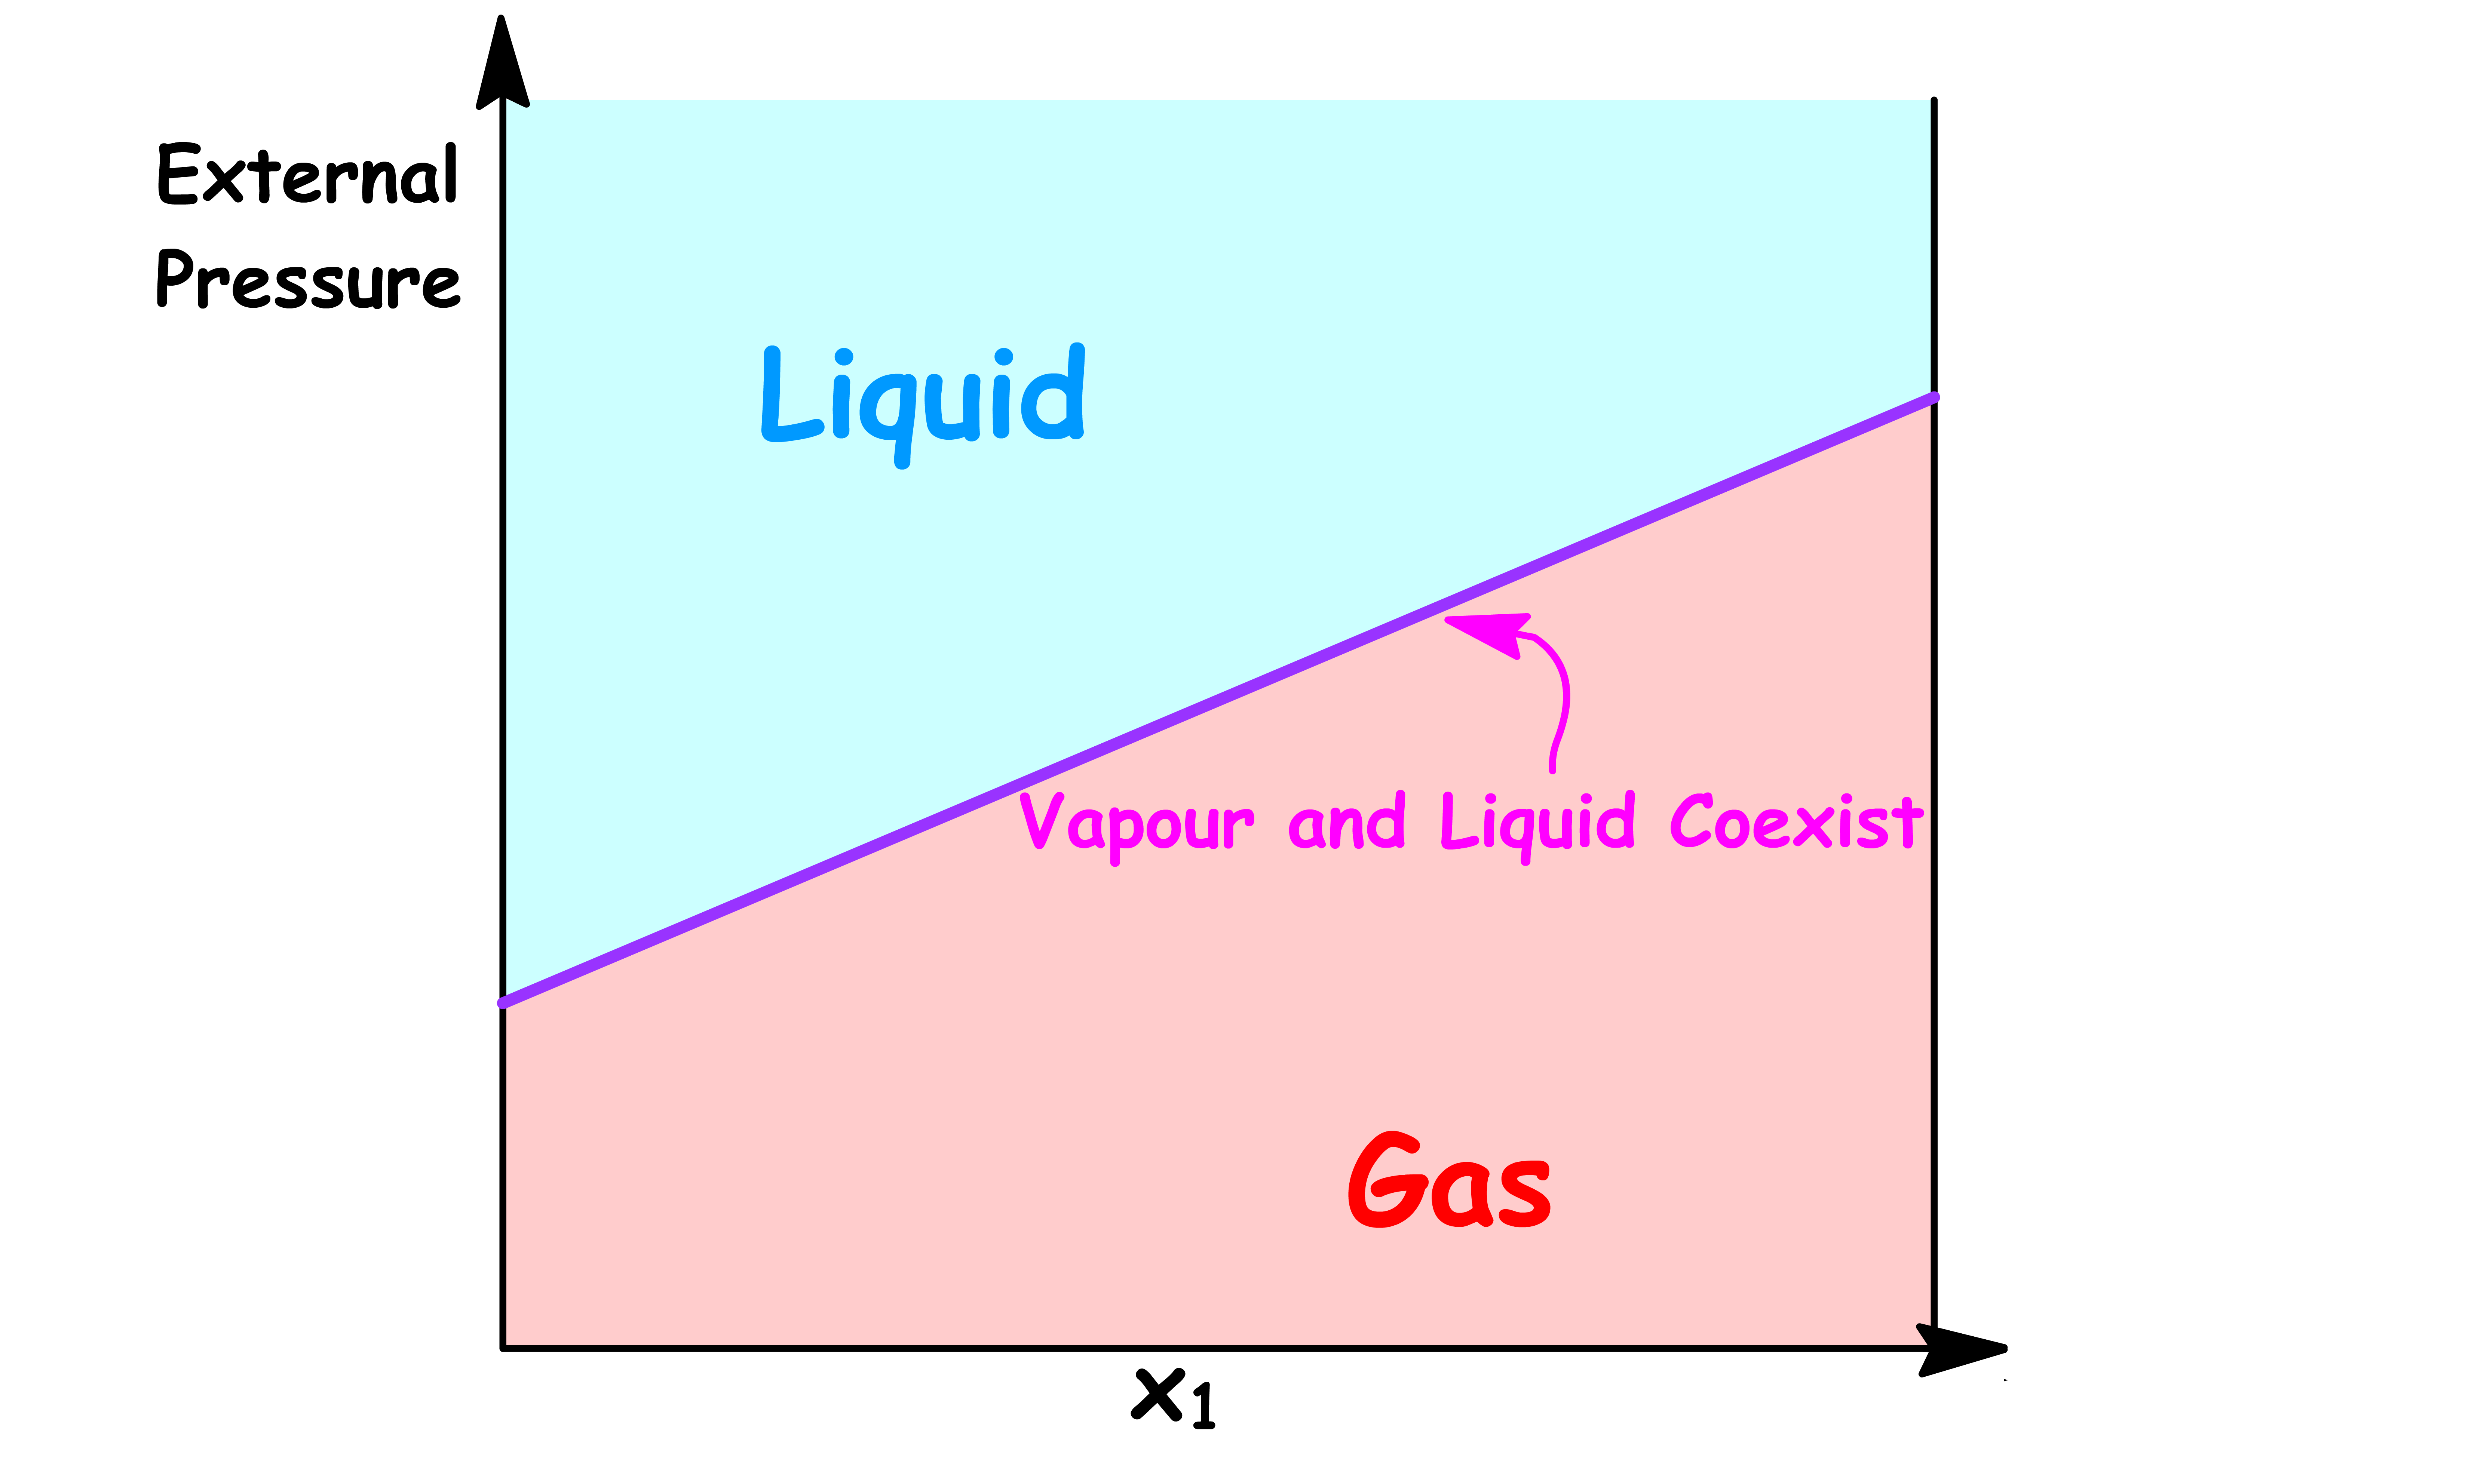
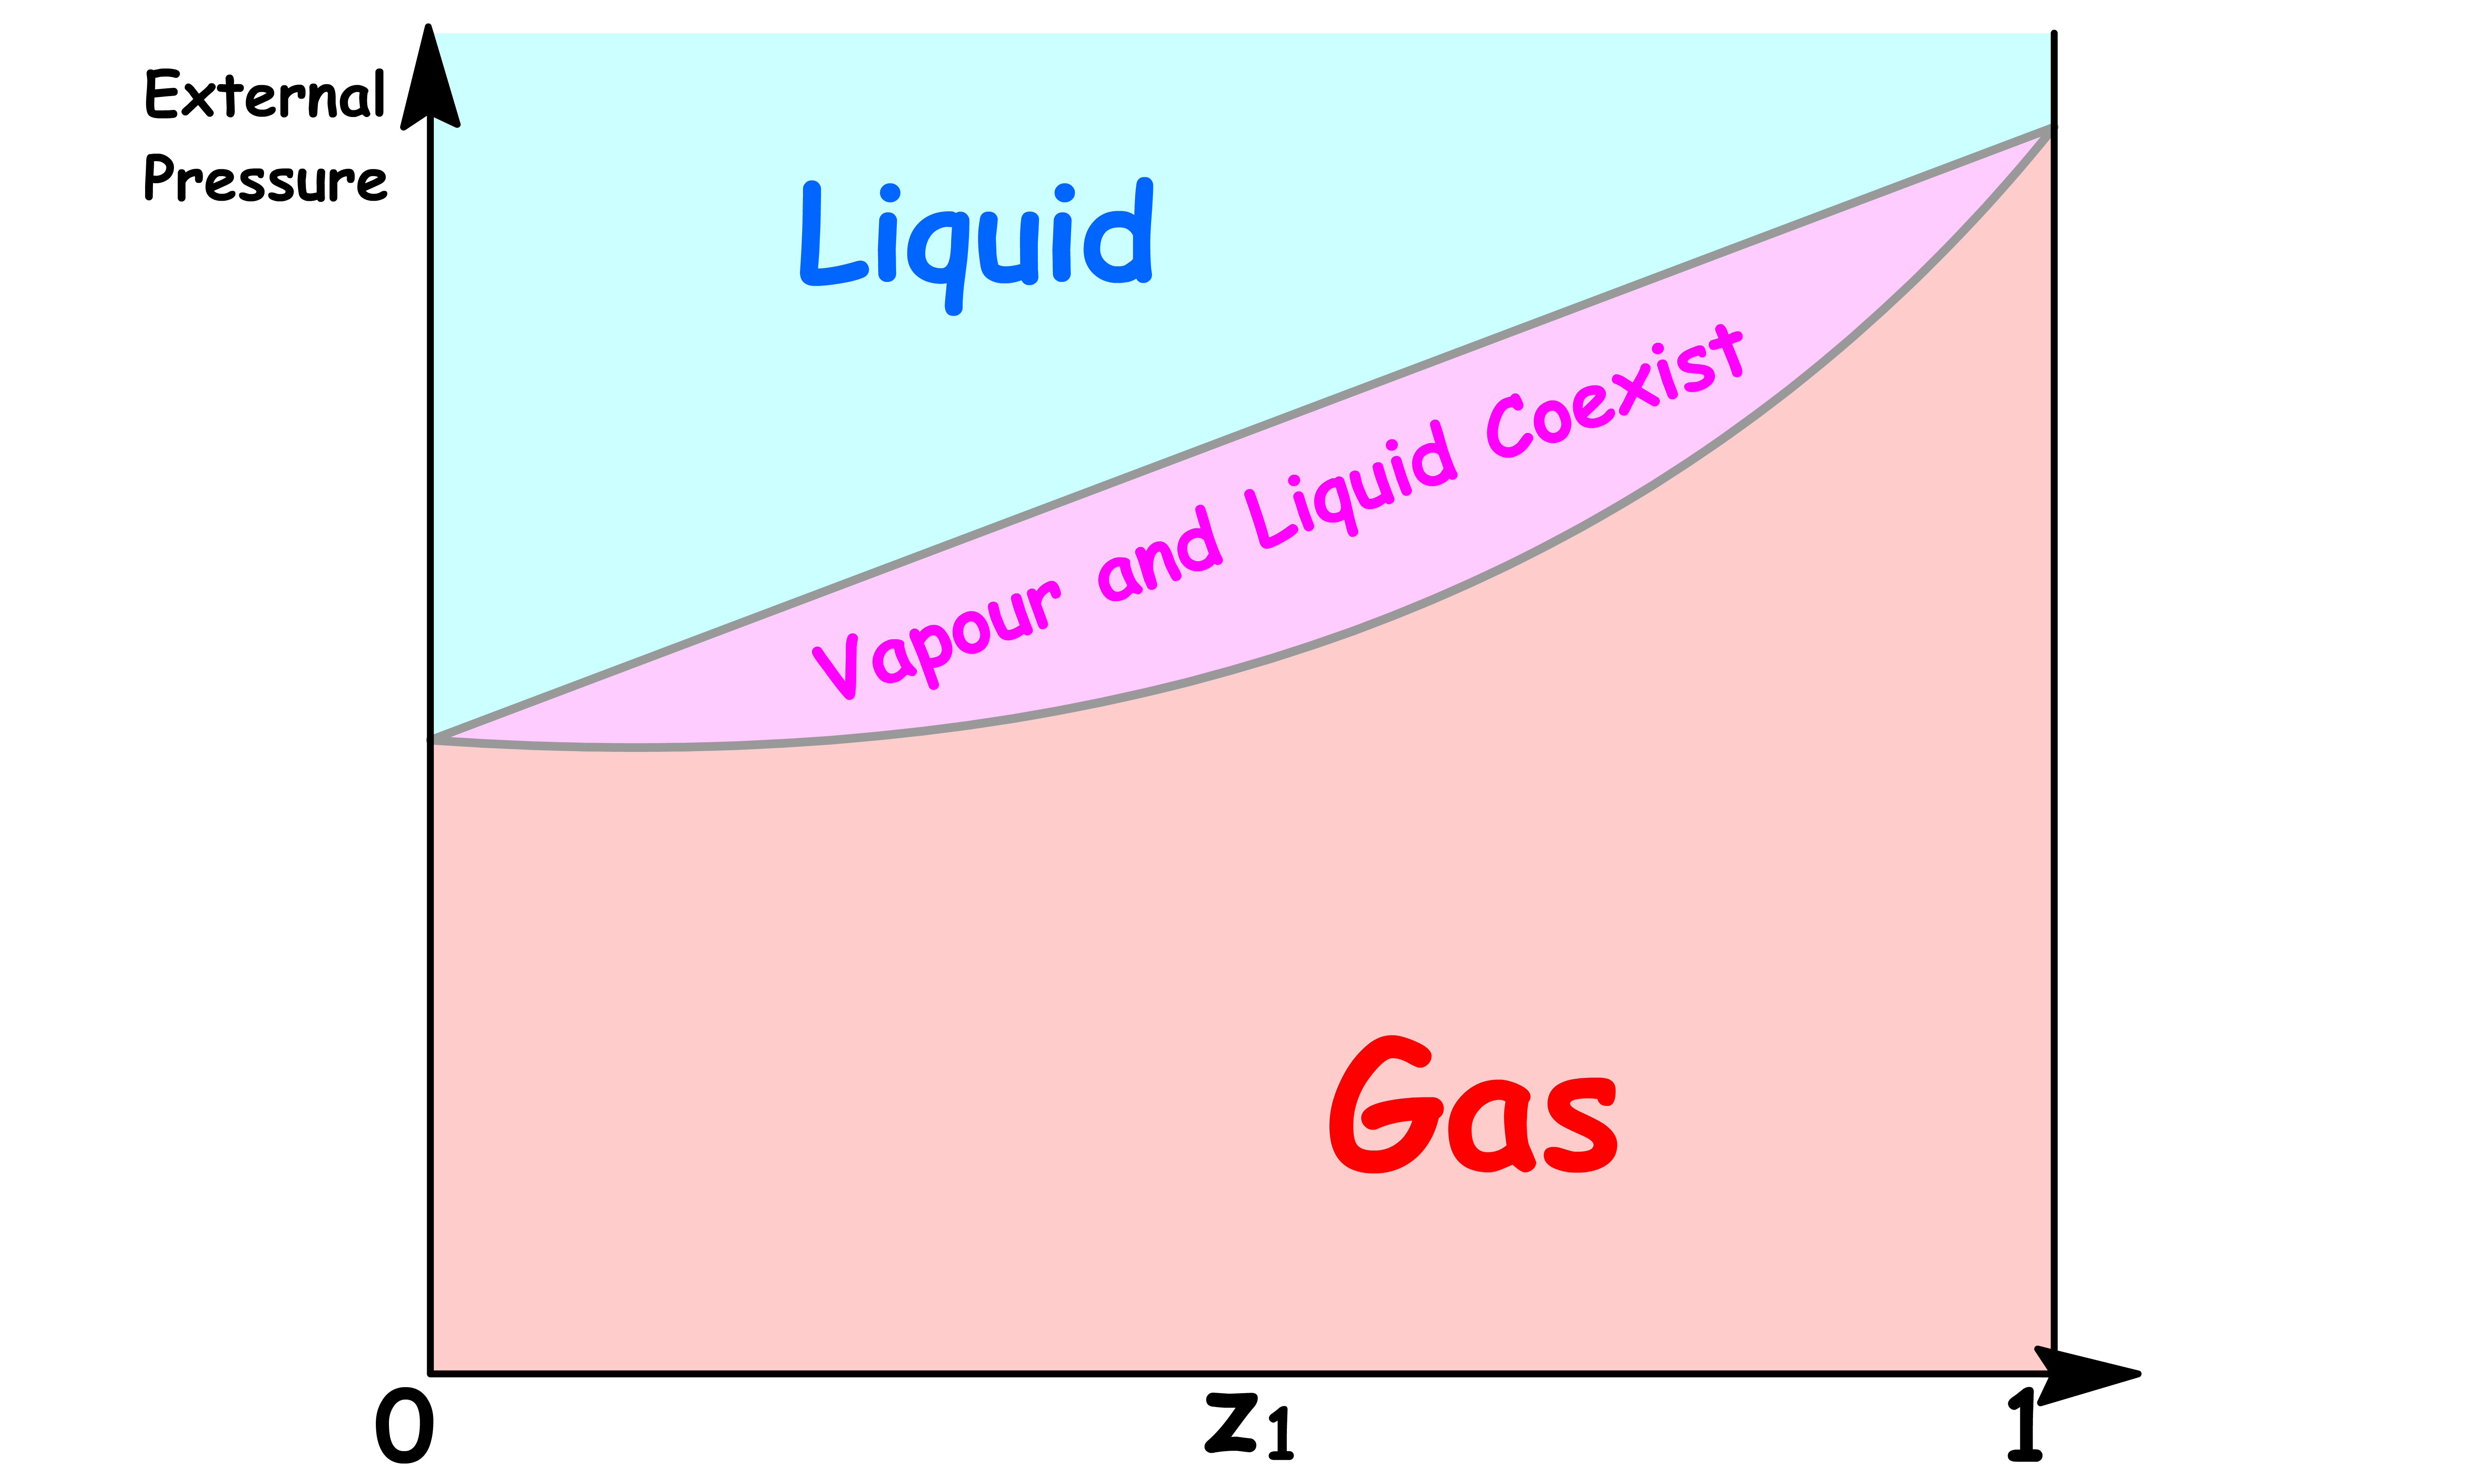
By changing the y-axis from total vapour pressure to the external pressure exerted to the system, we have constructed a simple phase diagram
- When the external pressure is higher than the total vapour pressure, the system is consist of a single liquid phase
- When the external pressure is lower than the total vapour pressure, the system is consist of a single vapour phase
- When the external pressure of the system is equal to the total vapour pressure, liquid and vapour can coexist
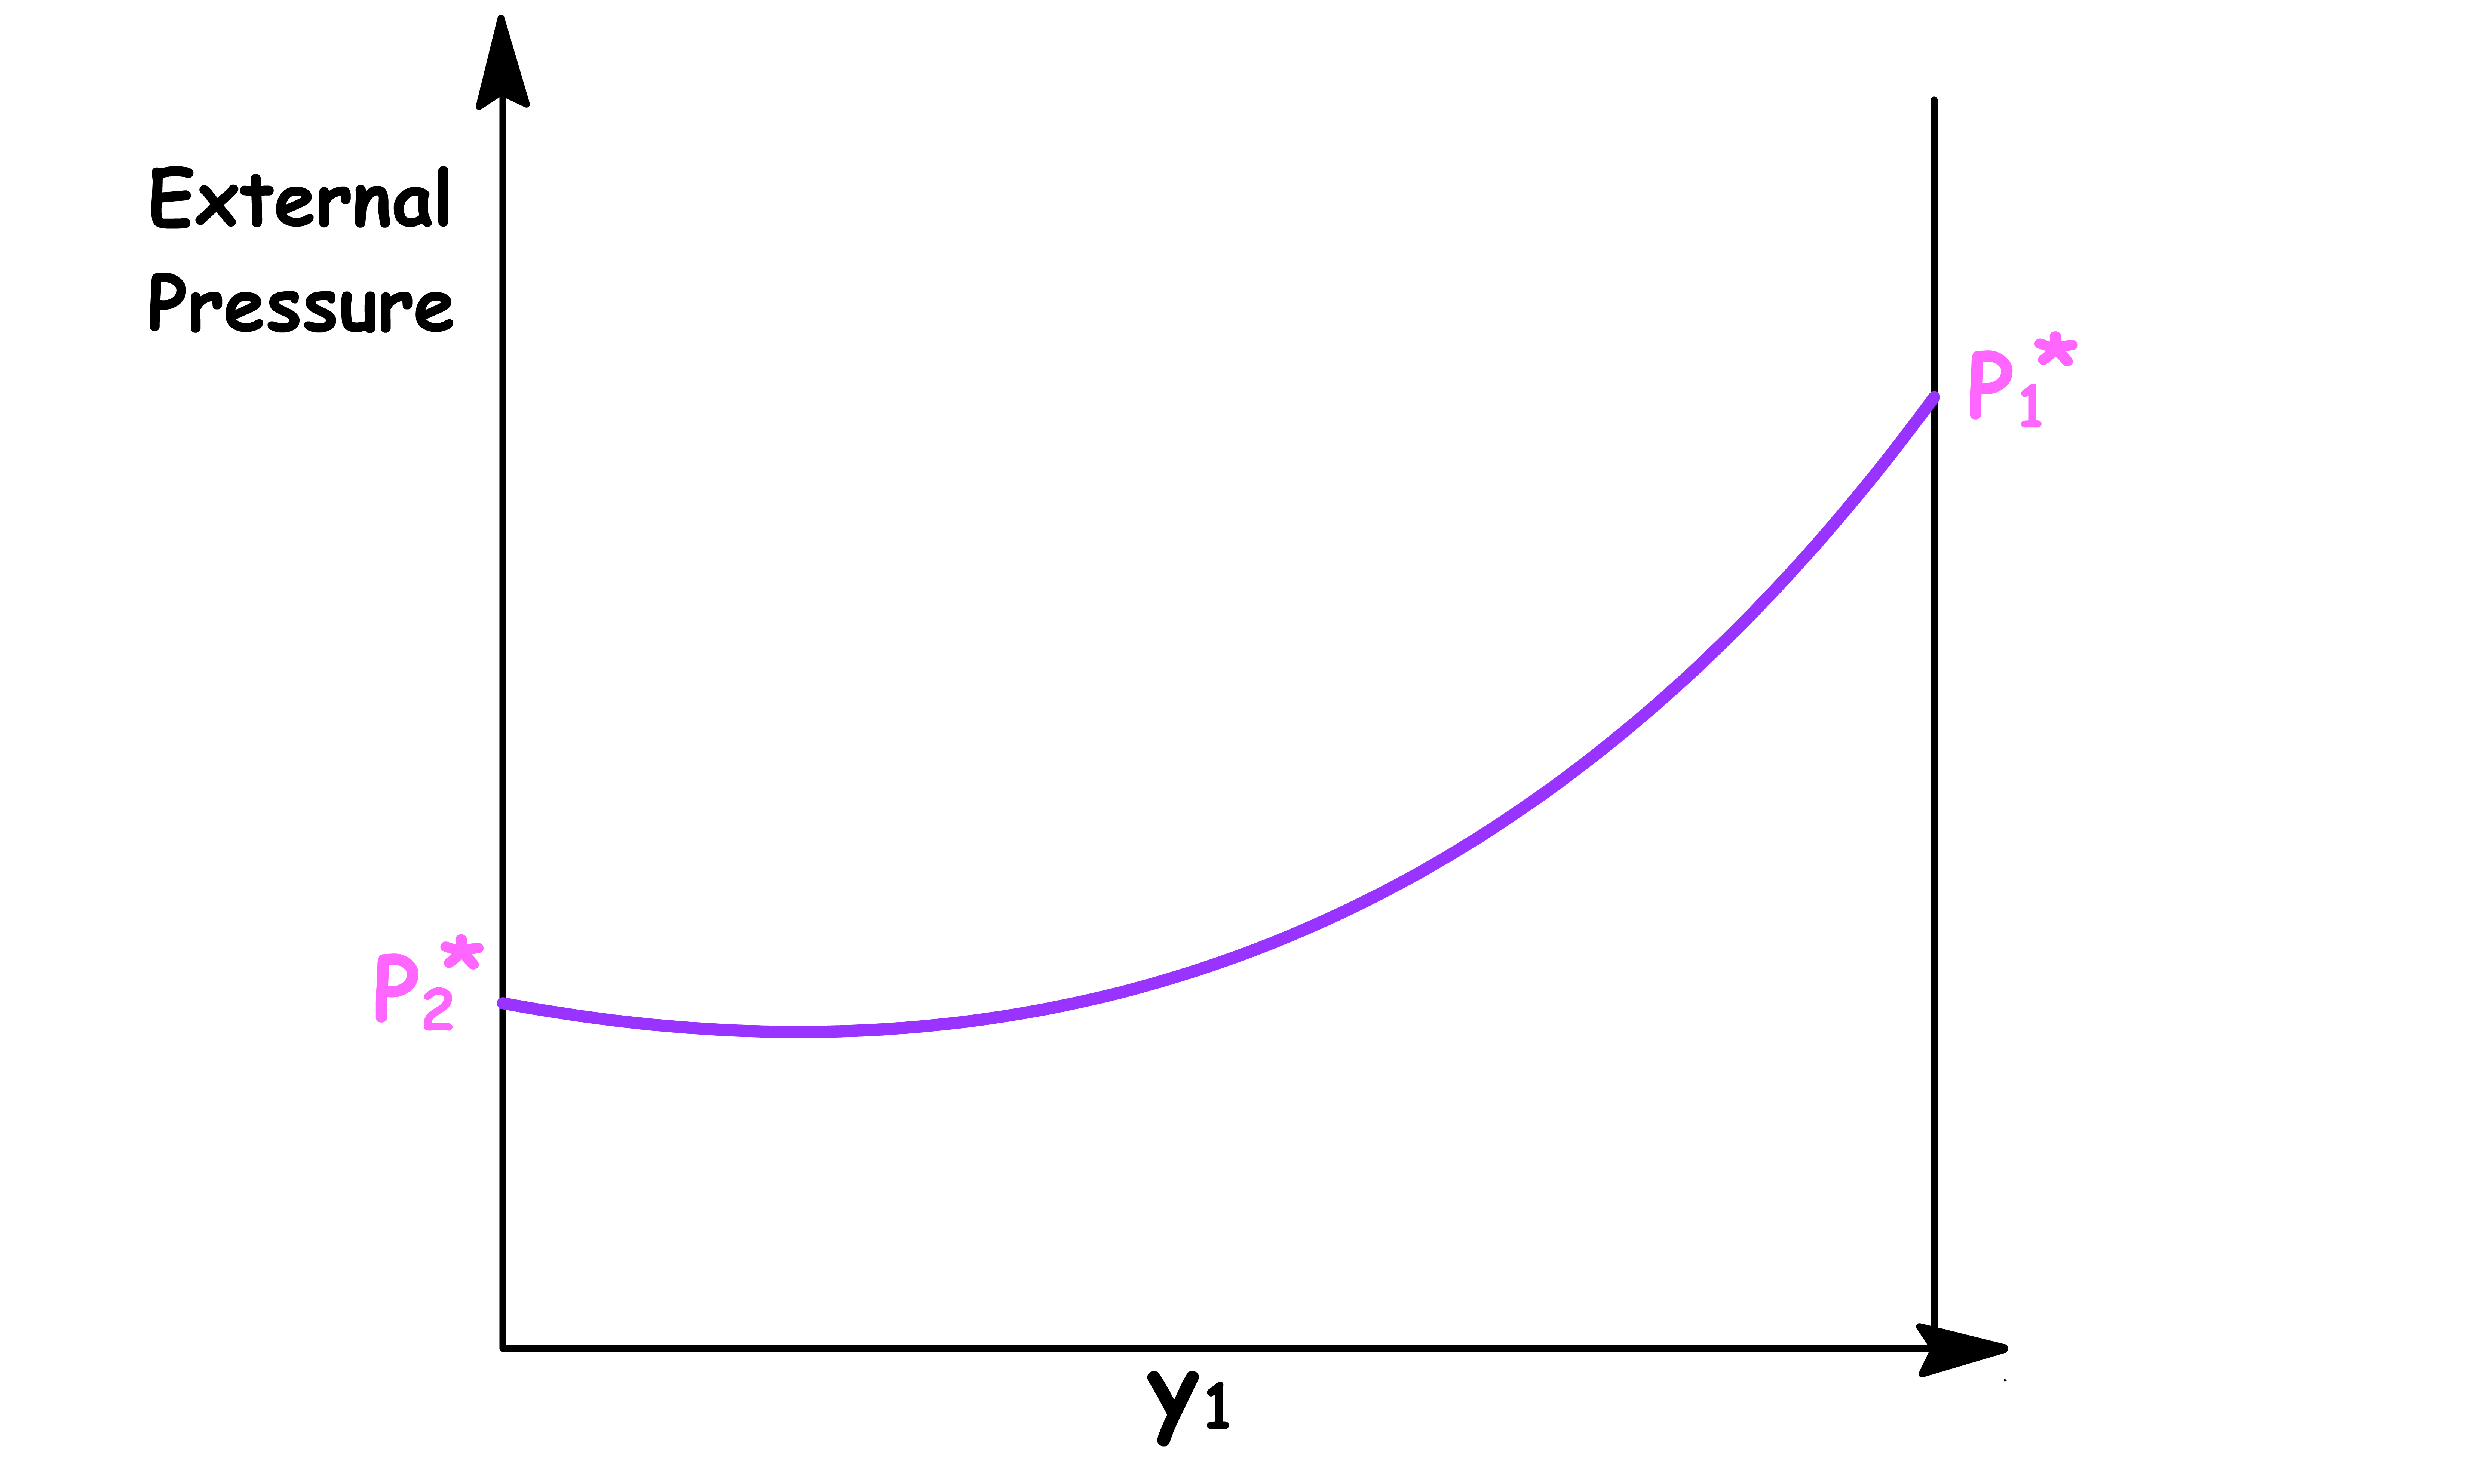
Pressure vs Mole Fraction in Vapour Phase ( y1 )
The relation between the total vapour pressure and mole fraction in a binary ideal solution can be derived from Raoult's Law
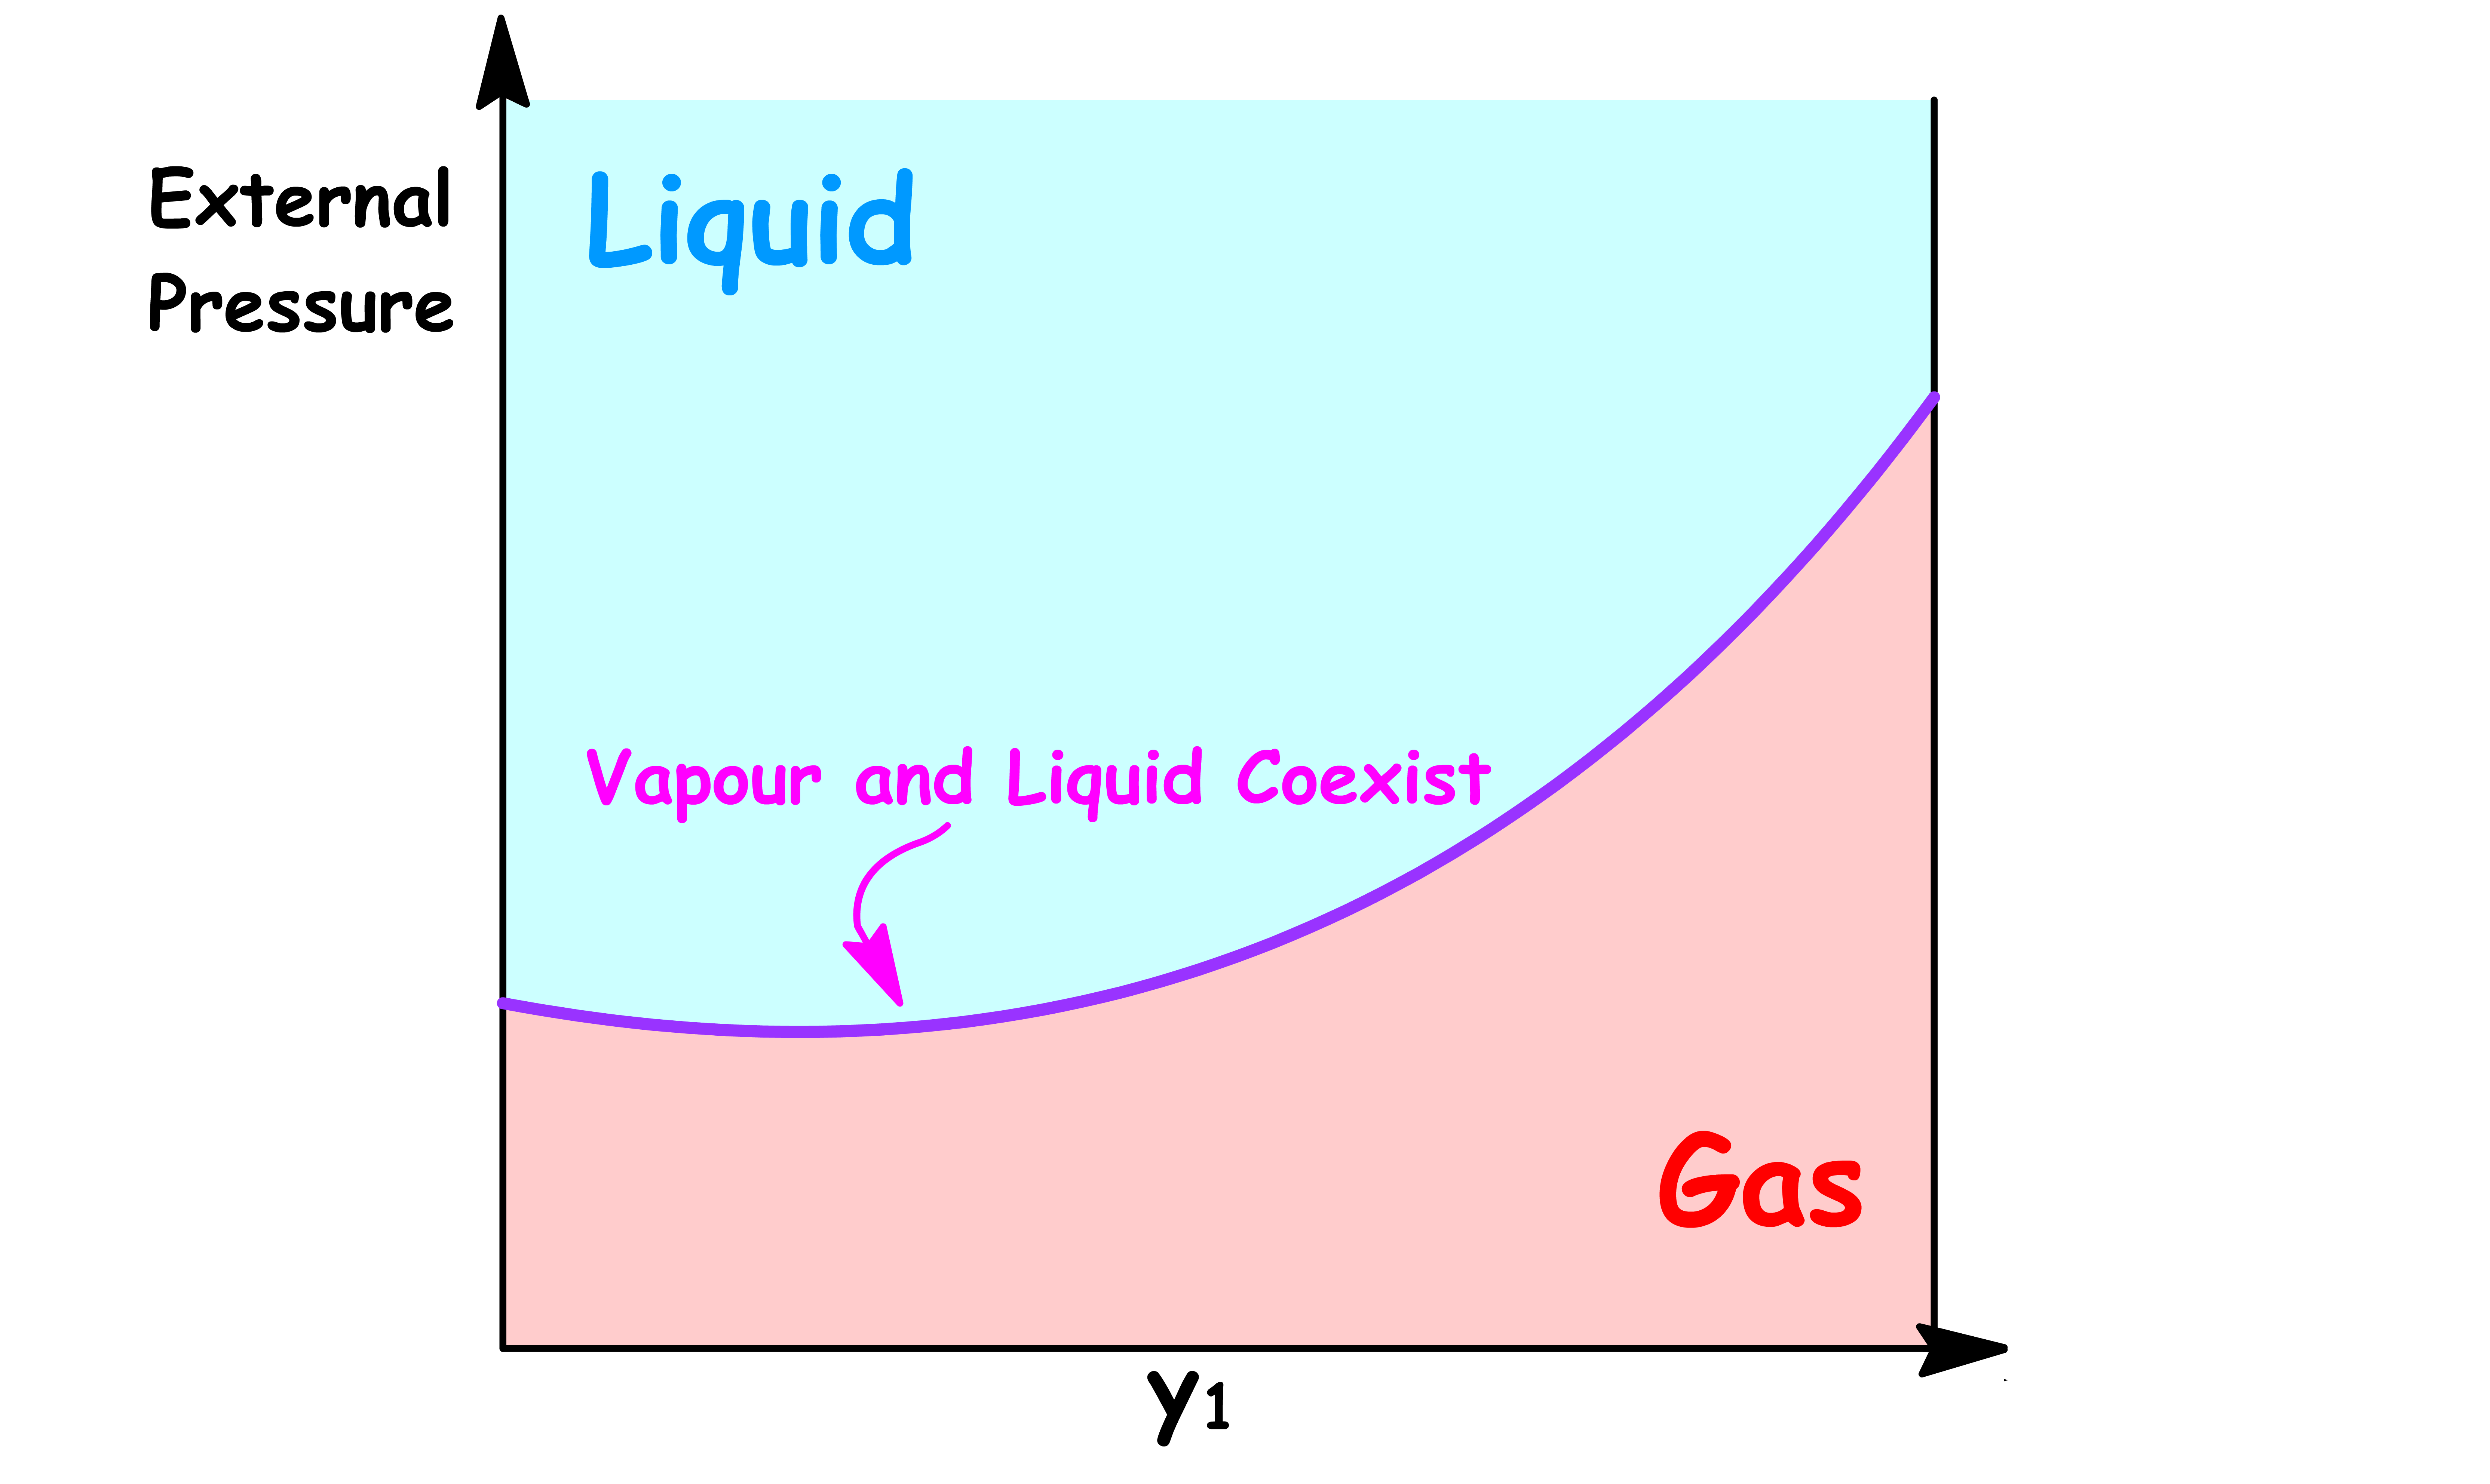
By changing the y-axis from total vapour pressure to the external pressure exerted to the system, we have constructed a simple phase diagram
- When the external pressure is higher than the total vapour pressure, the system is consist of a single liquid phase
- When the external pressure is lower than the total vapour pressure, the system is consist of a single vapour phase
- When the external pressure of the system is equal to the total vapour pressure, liquid and vapour can coexist
Pressure vs Overall Mole Fractione ( z1 )
If we are interested in distillation, both the vapour and the liquid compositions are of equal interest
- It is therefore sensible to combine the two graphs into one
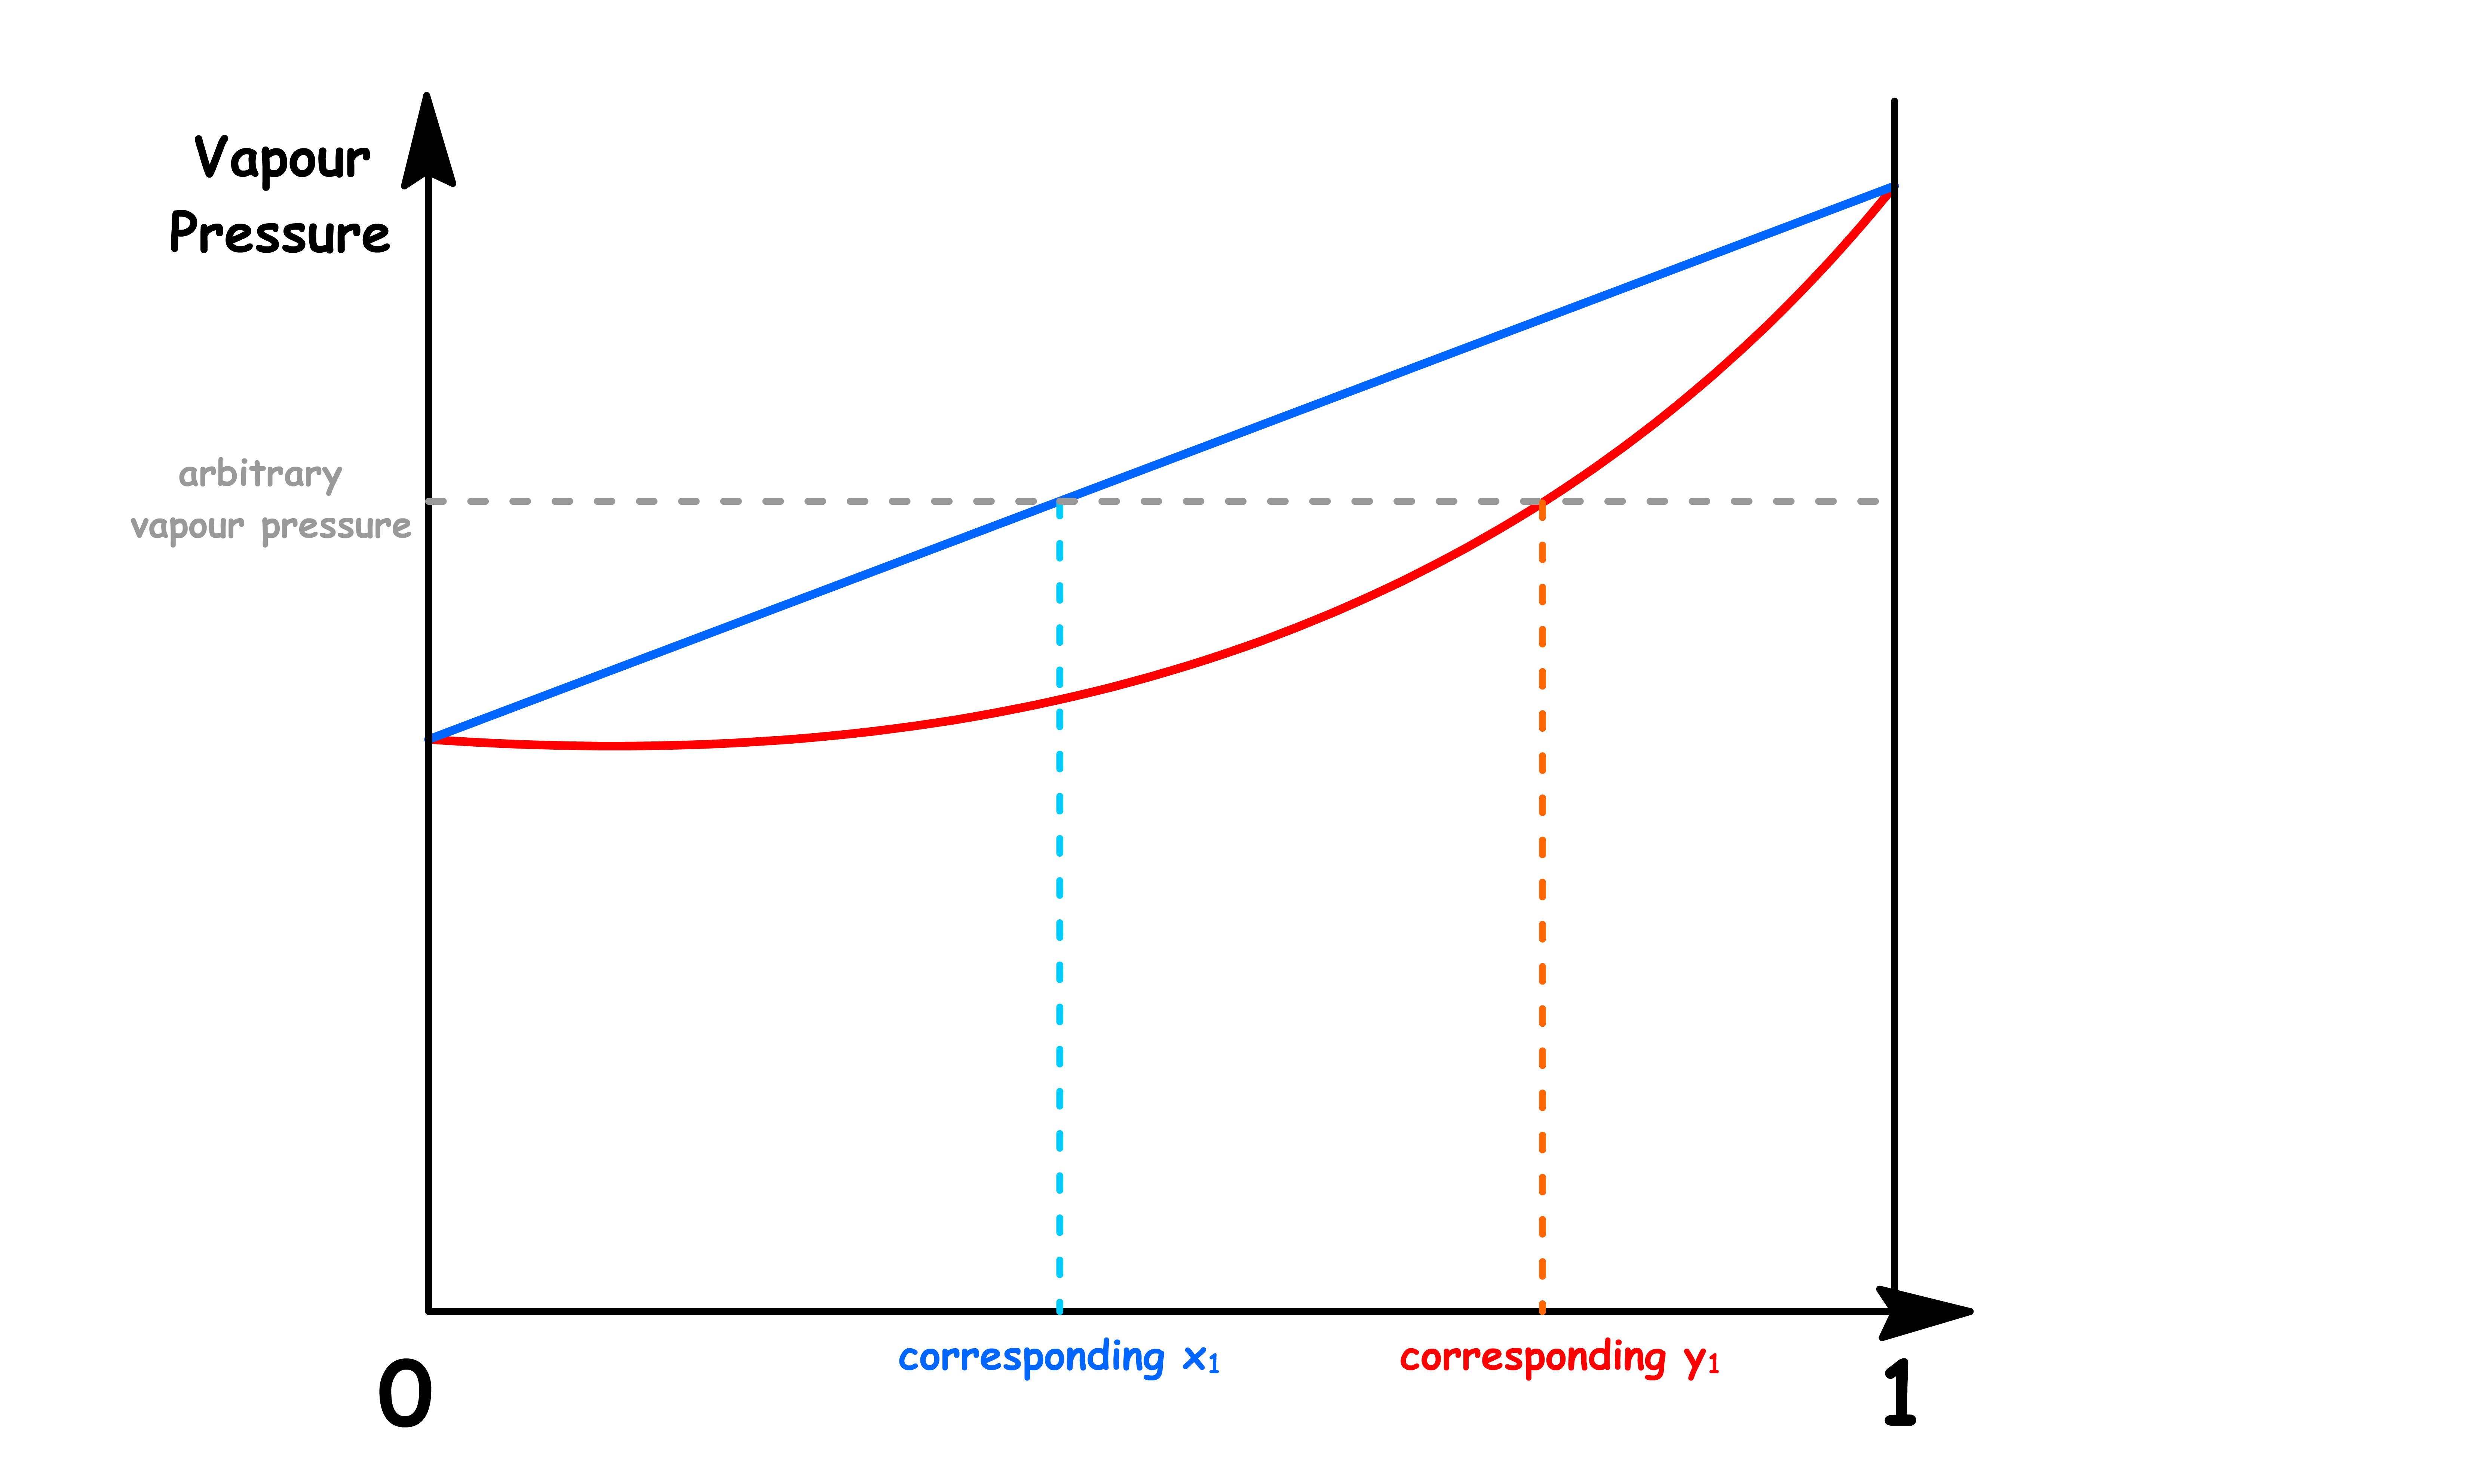
xi and yi do not vary independently
- The mole fractions in both the solution and the vapour phase are related to the total vapour pressure
- Hence, if we are given the total vapour pressure of the system, we can easily work out both kinds of mole fraction
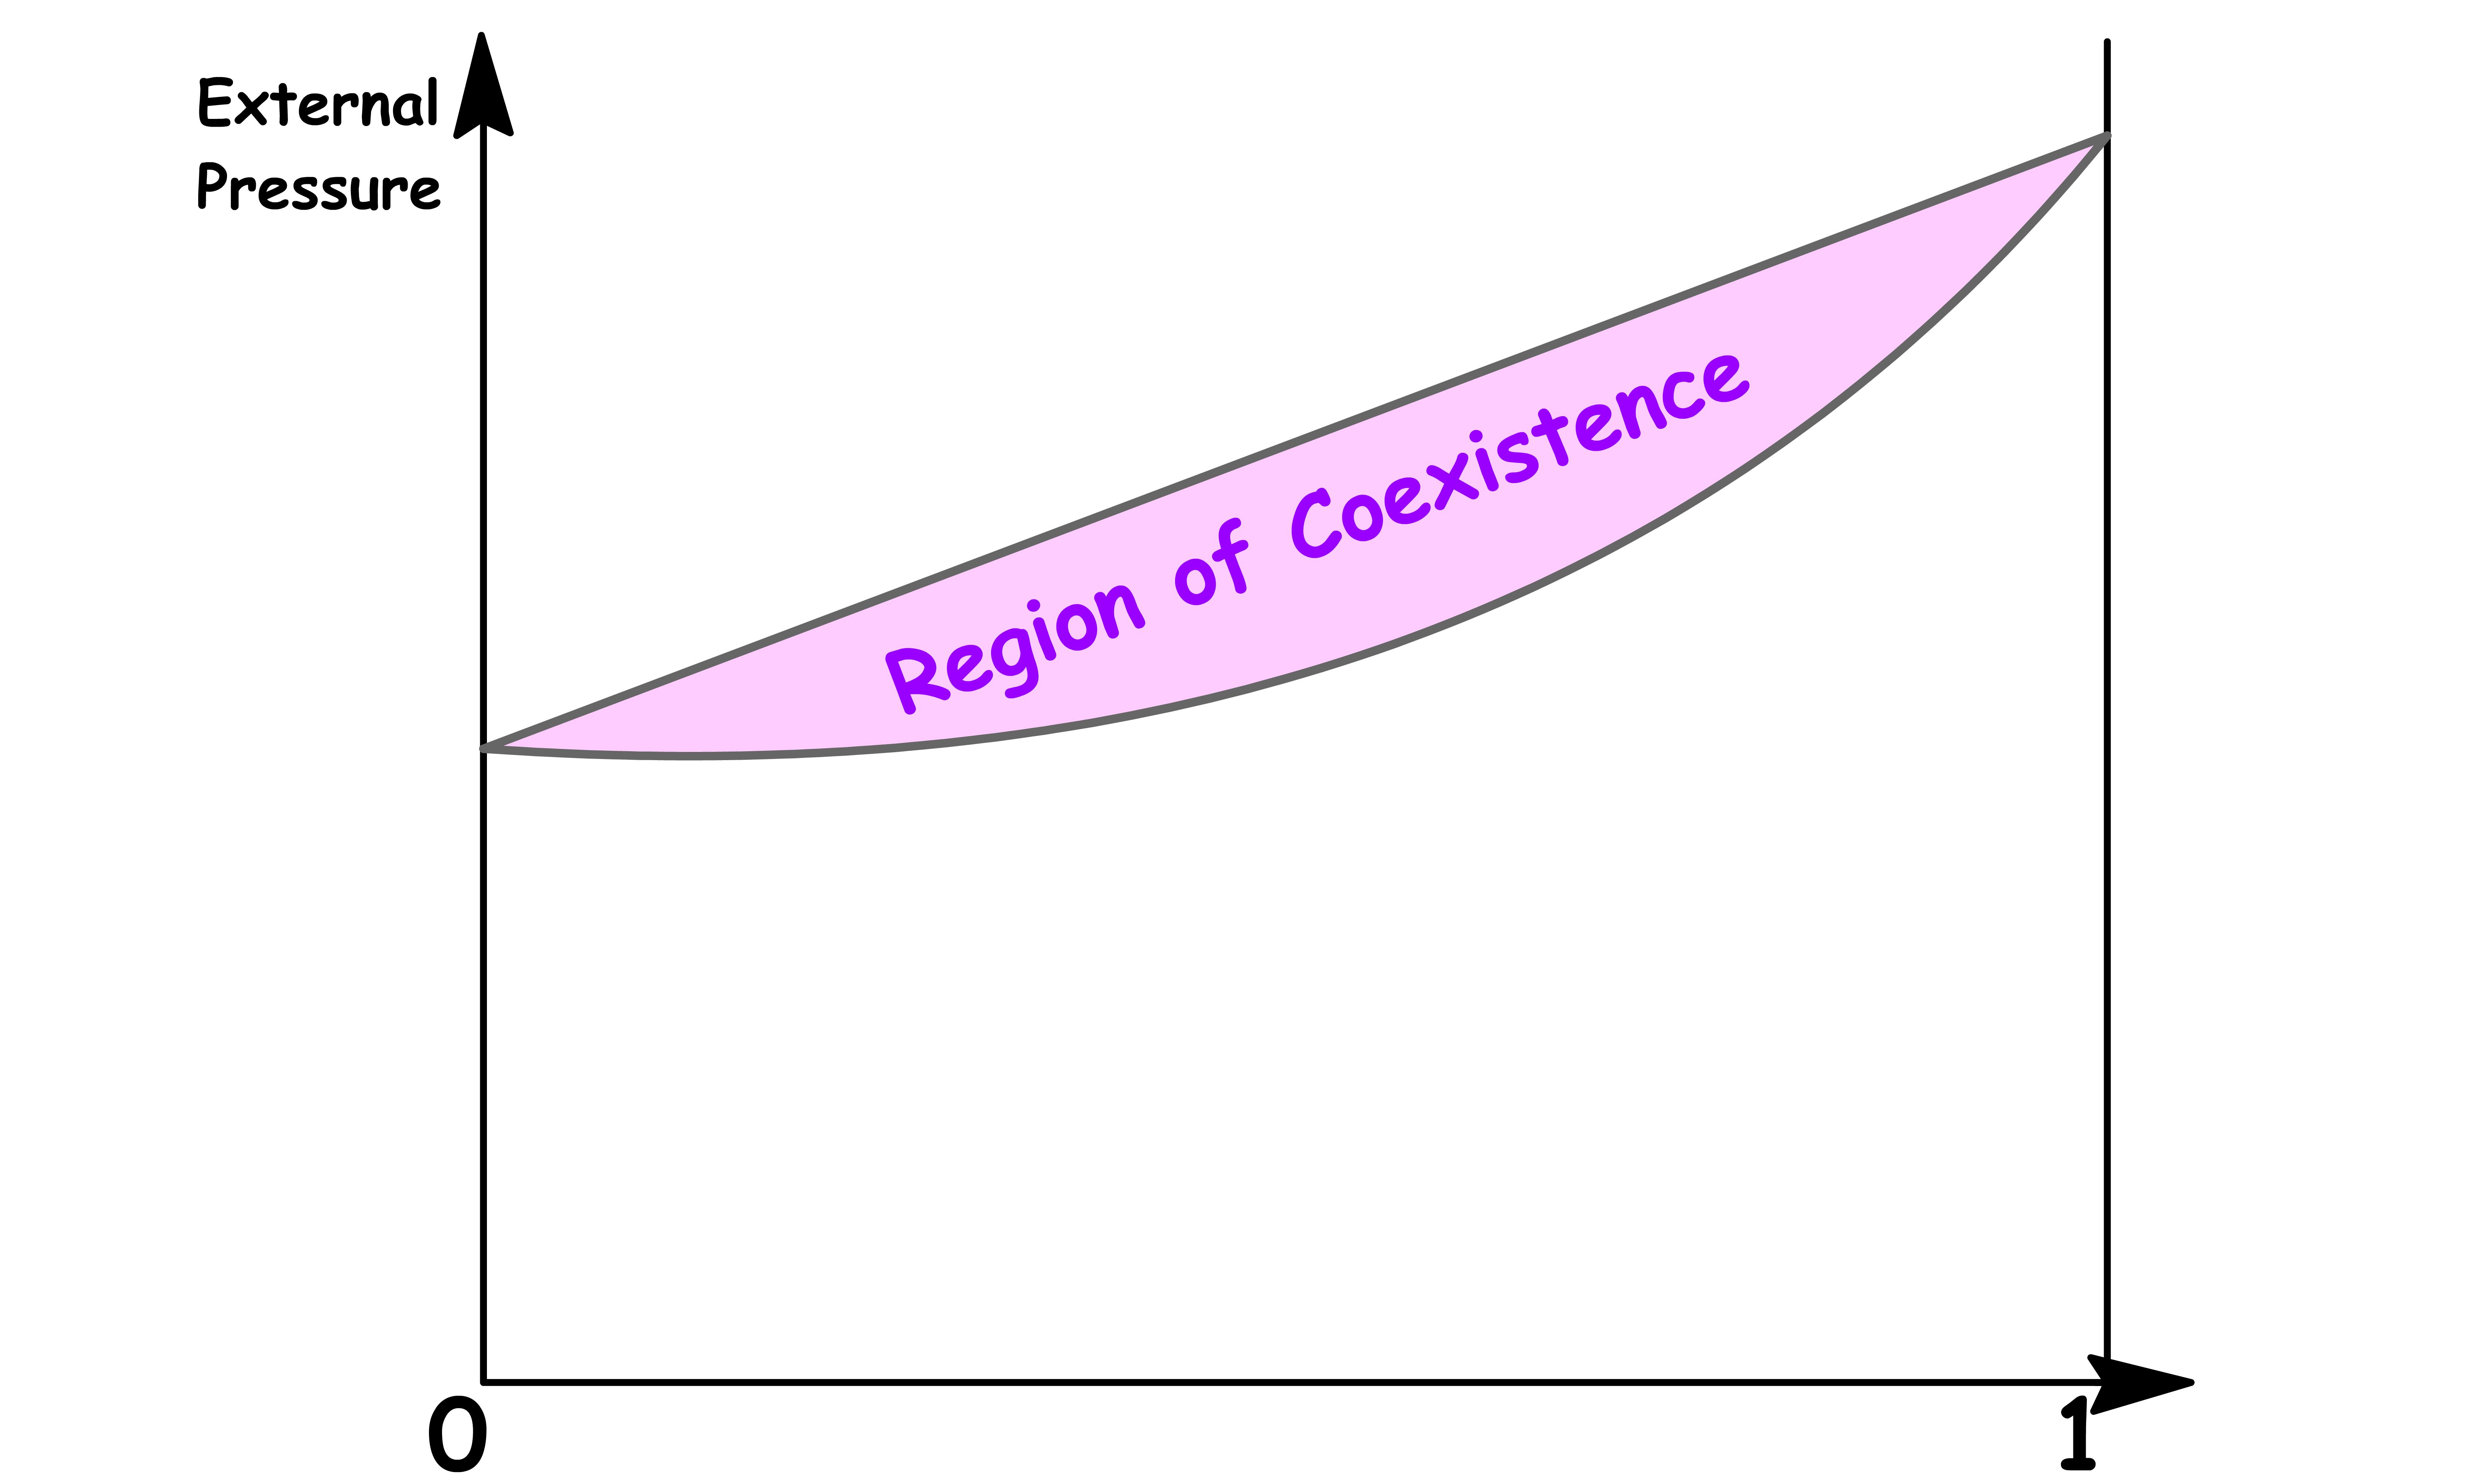
A richer interpretation of the phase diagram can be obtained if we interpret the horizontal axis as showing the overall composition of the system
JustificationConsider the relation between the total vapour pressure and the overall mole fraction
- We shall first derive a relation between the overall mole fraction and the mole fraction in solution and mole fraction in vapour phase respectively
- After a lot of algebaric manipulation, we arrive at the relation
- We can see that is a function of , and the ratio between the total mole number in the two phases. However, since , do not vary independently, is actually just a function of either one of the mole fraction and the ratio of total mole numbers
- We also know that and can be expressed in terms of the total vapour pressure, so can be expressed as a function of total vapour pressure and ratio of total mole numbers
- In other words, the total vapour pressure is a function of the overall mole fraction and ratio of total mole numbers
This is extremely important because
- In the previous case, the total vapour pressure is a function of either the mole fraction in solution or the mole fraction in vapour phase only
This means that each value of the total vapour pressure only corresponds to one value of and respectively
But now, the total vapour pressure is a function of both and the ratio of total mole number of phases
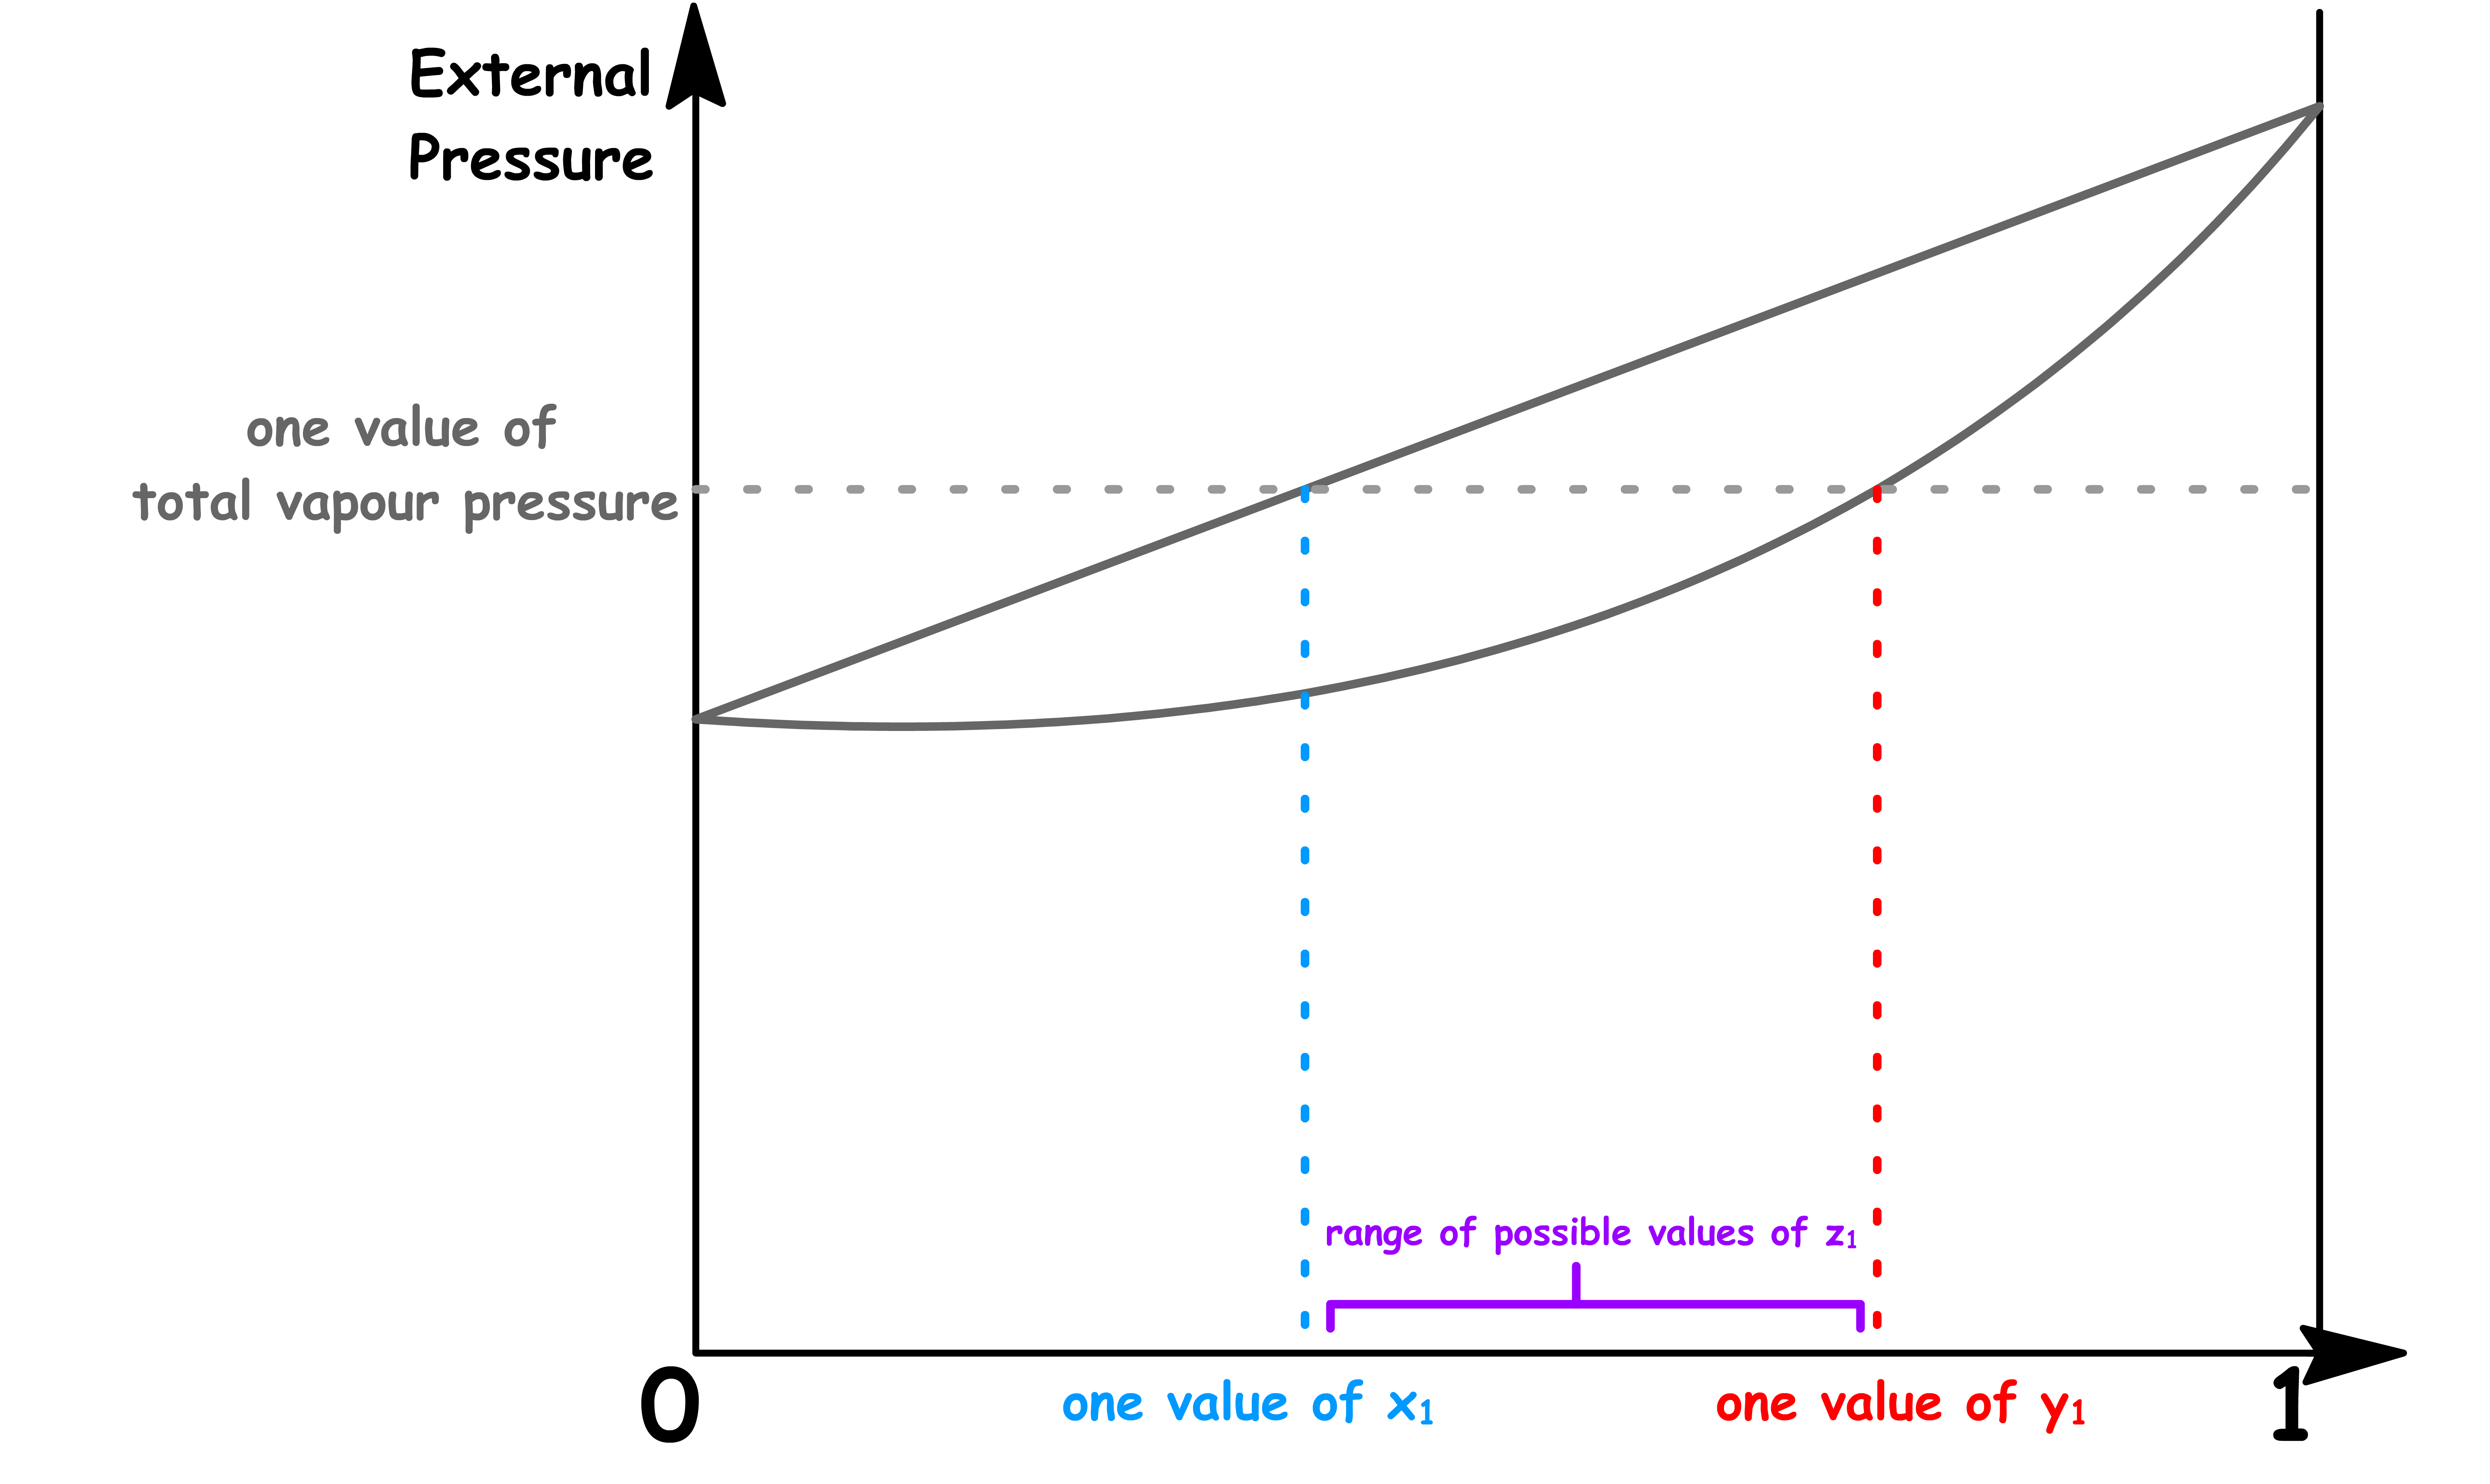
- This means that for any given total vapour pressure, it corresponds to multiple values of
The Coexistence Line Becomes the Coexistence Region
One of the most distinguishable feature of this new phase diagram is that there is a region where vapour and liquid can coexist
- The reason for that should be pretty obvious now that we understand how one value of total vapour pressure corresponds to a range of values of
- Two phases coexists when the total vapour pressure is equal to the external pressure
In the previous cases, since each total vapour pressure only corresponds to one value of and , there is only one possible value of and that allows for coexistence for each external pressure. Hence, we obtained a coexistence curve
- But now, since each total vapour pressure corresponds to a range of values of , there is a range possible value of allows for coexistence for each external pressure. Hence, we obtained a coexistence region
¶ Using the Phase Diagram
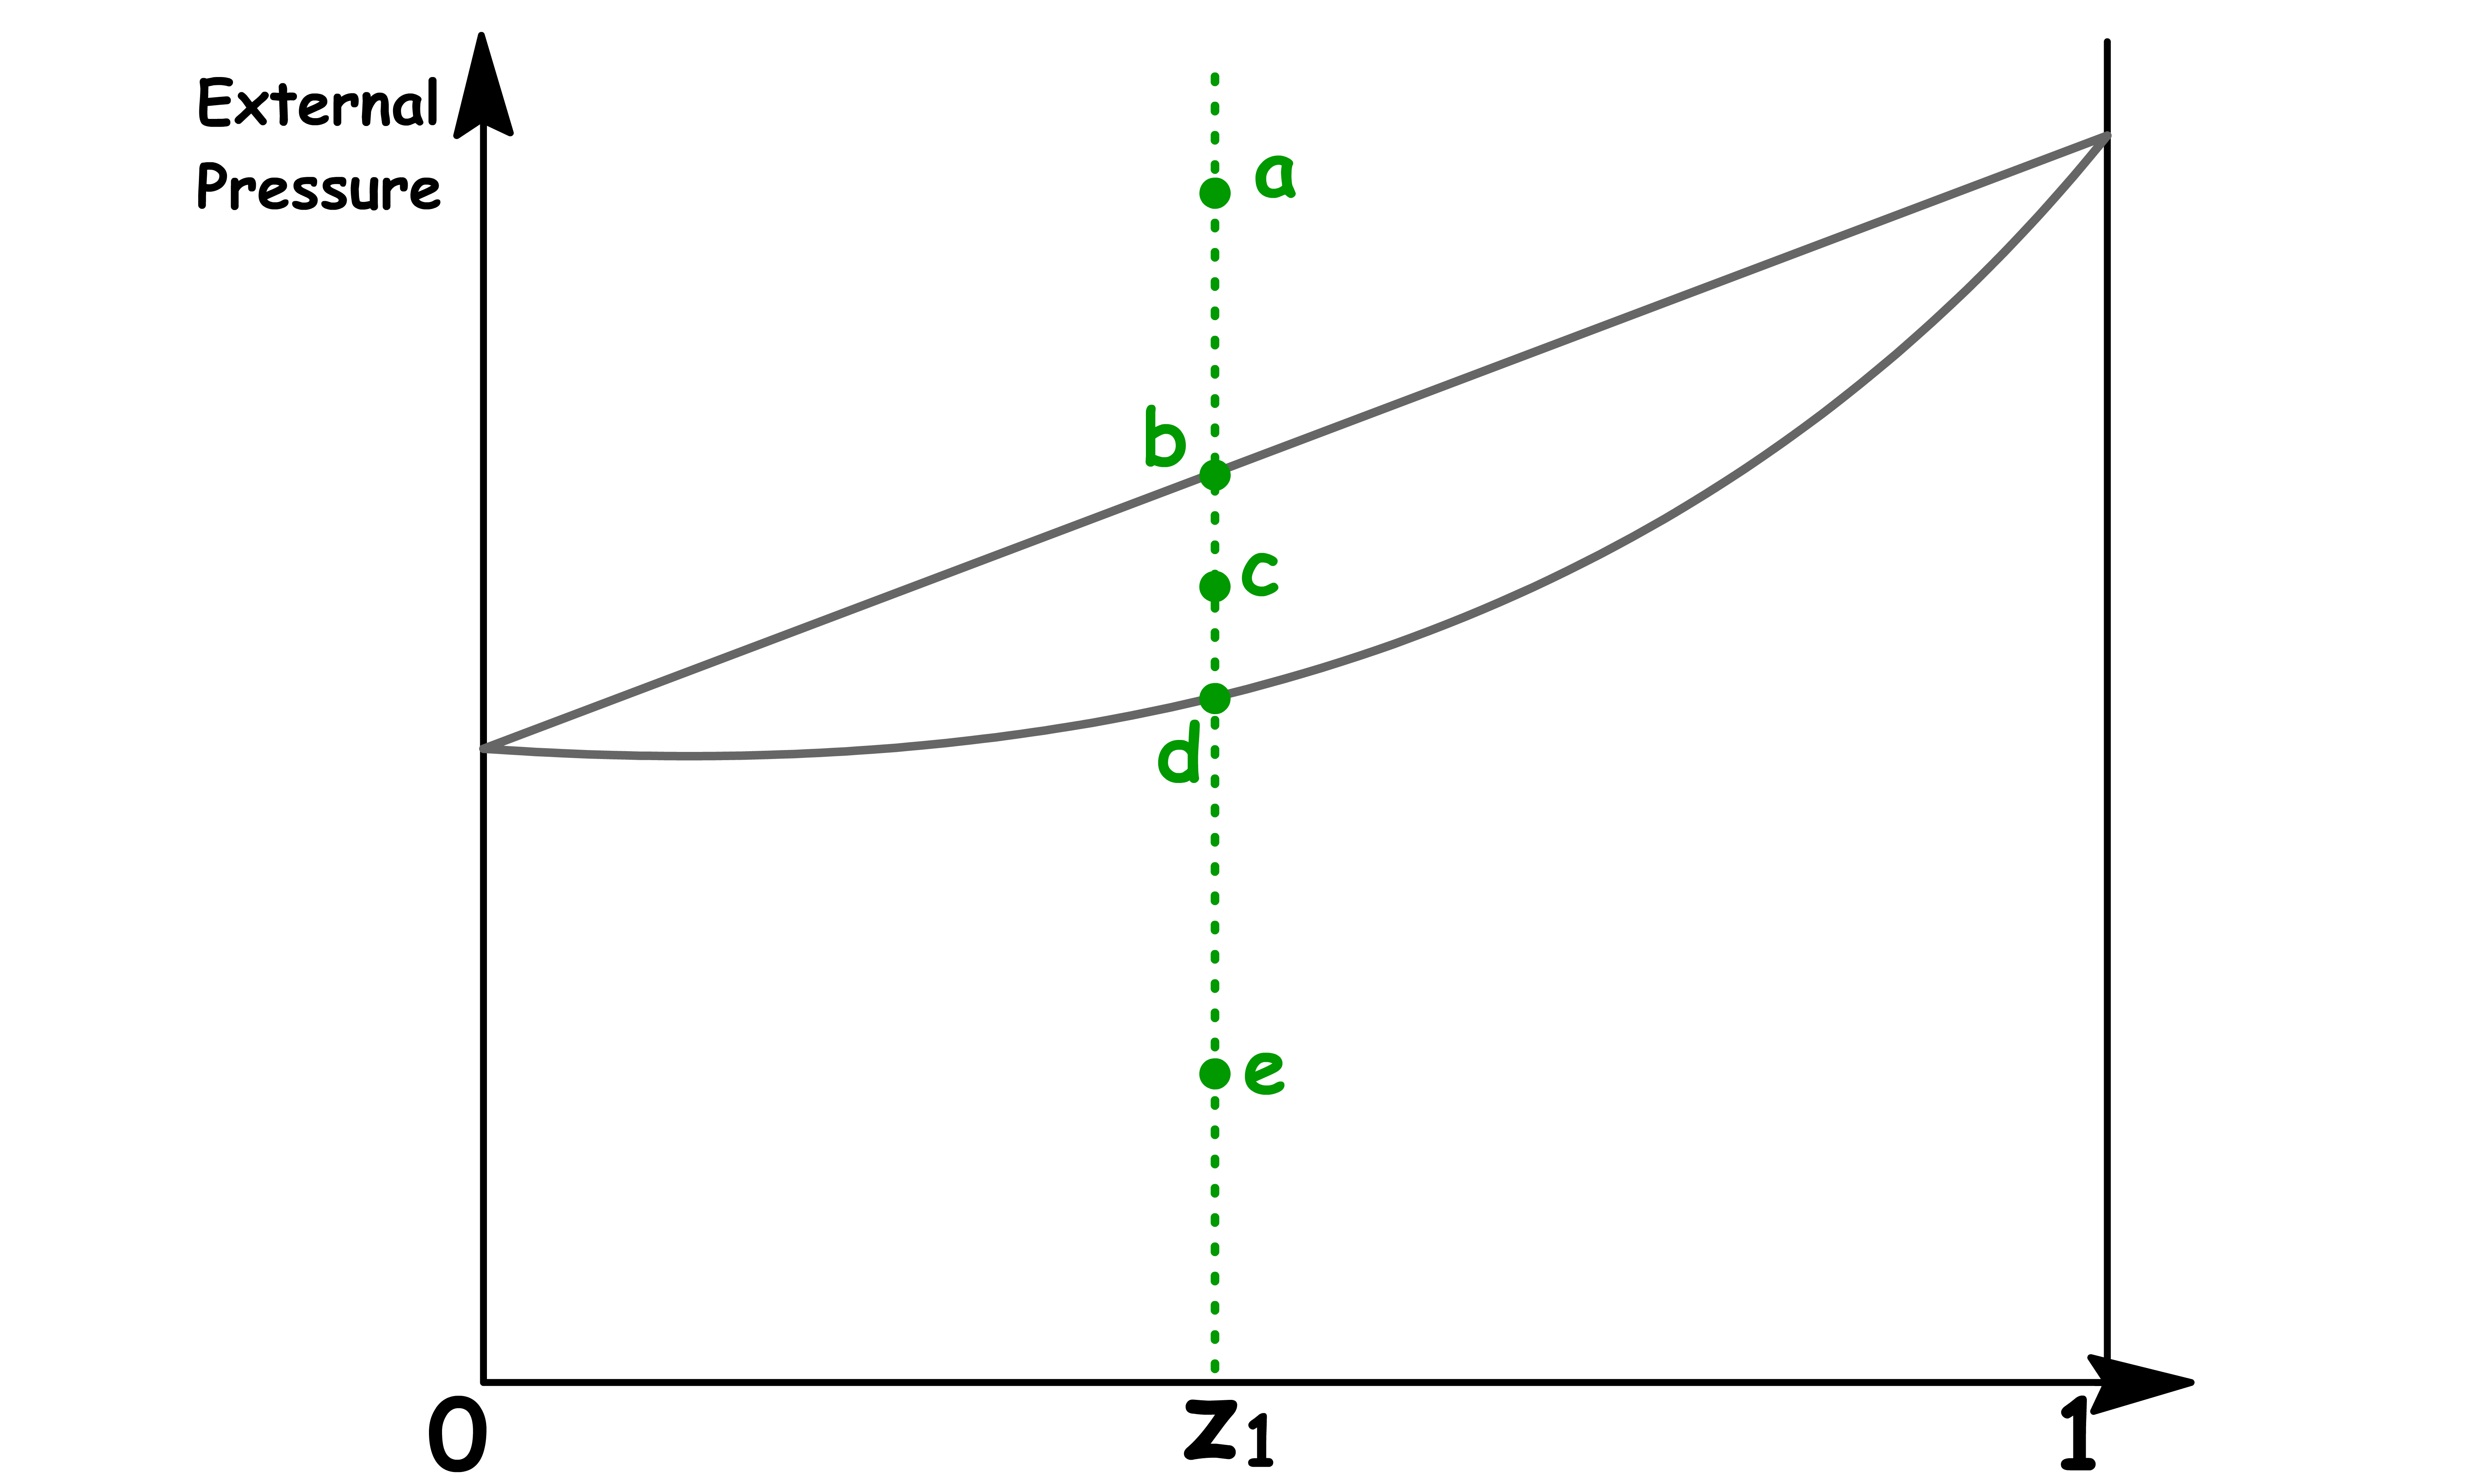
To understand how we can use the phase diagram, consider the effect of lowering the external pressure exerted to a system of binary mixture
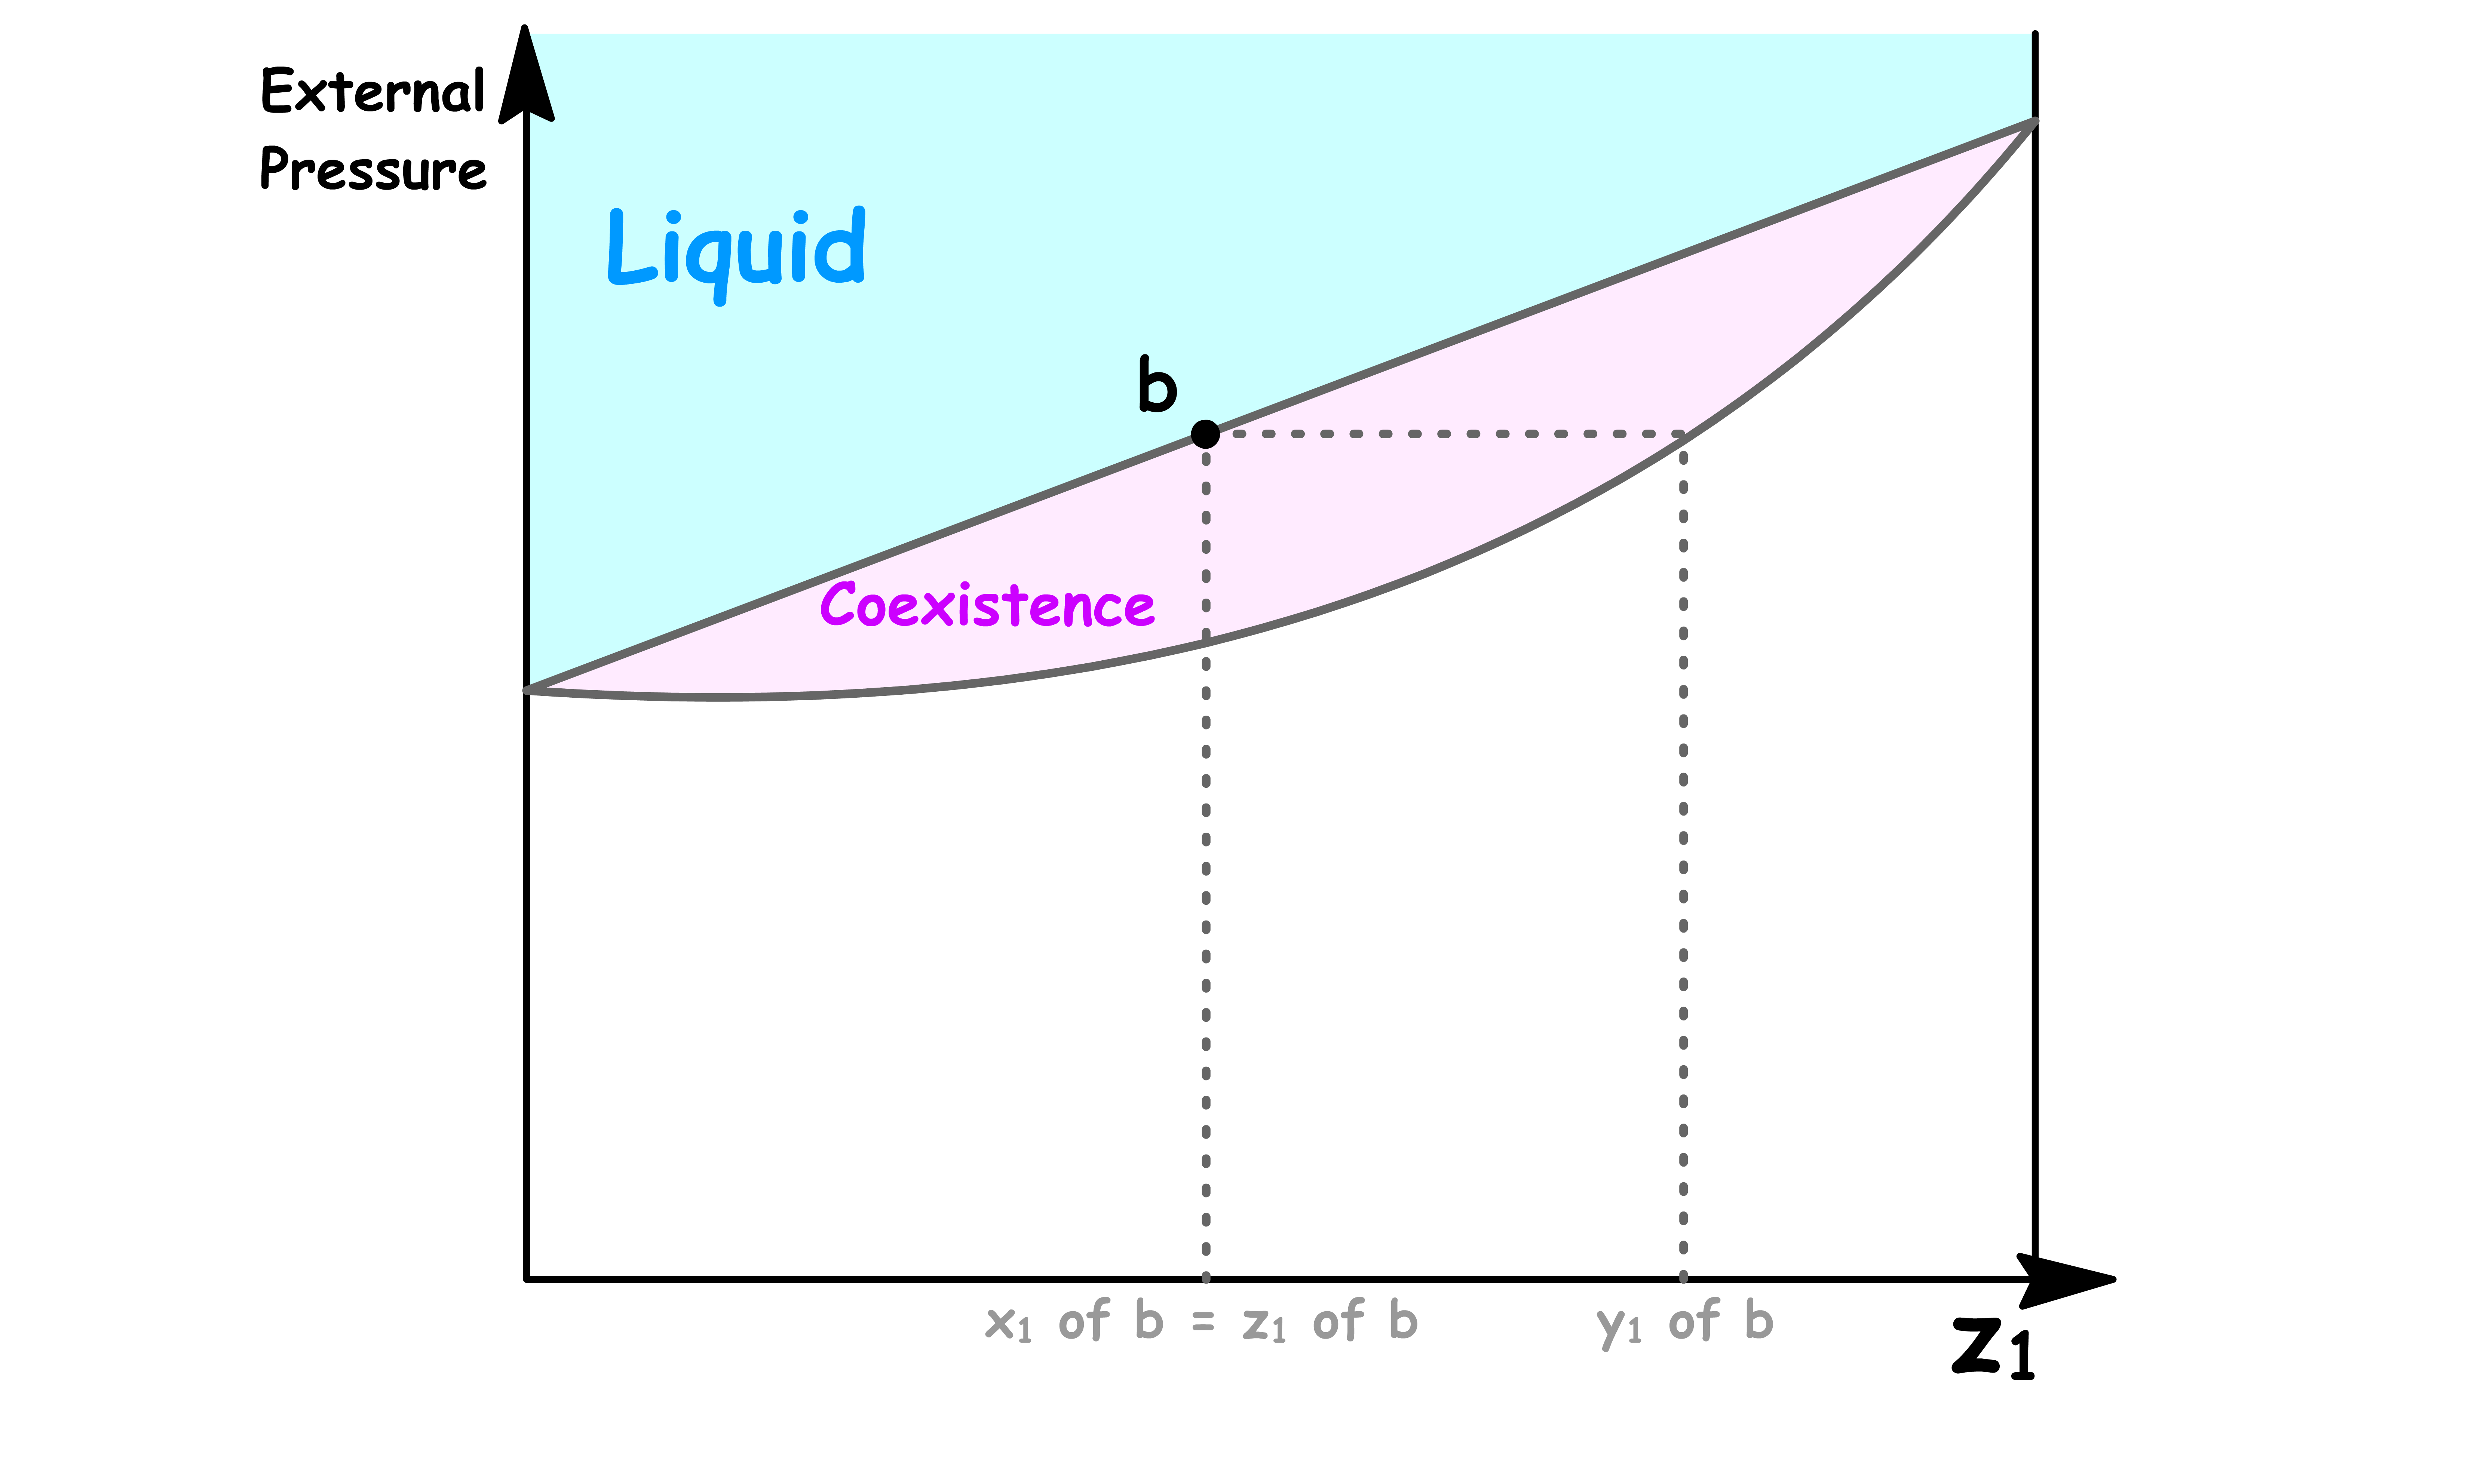
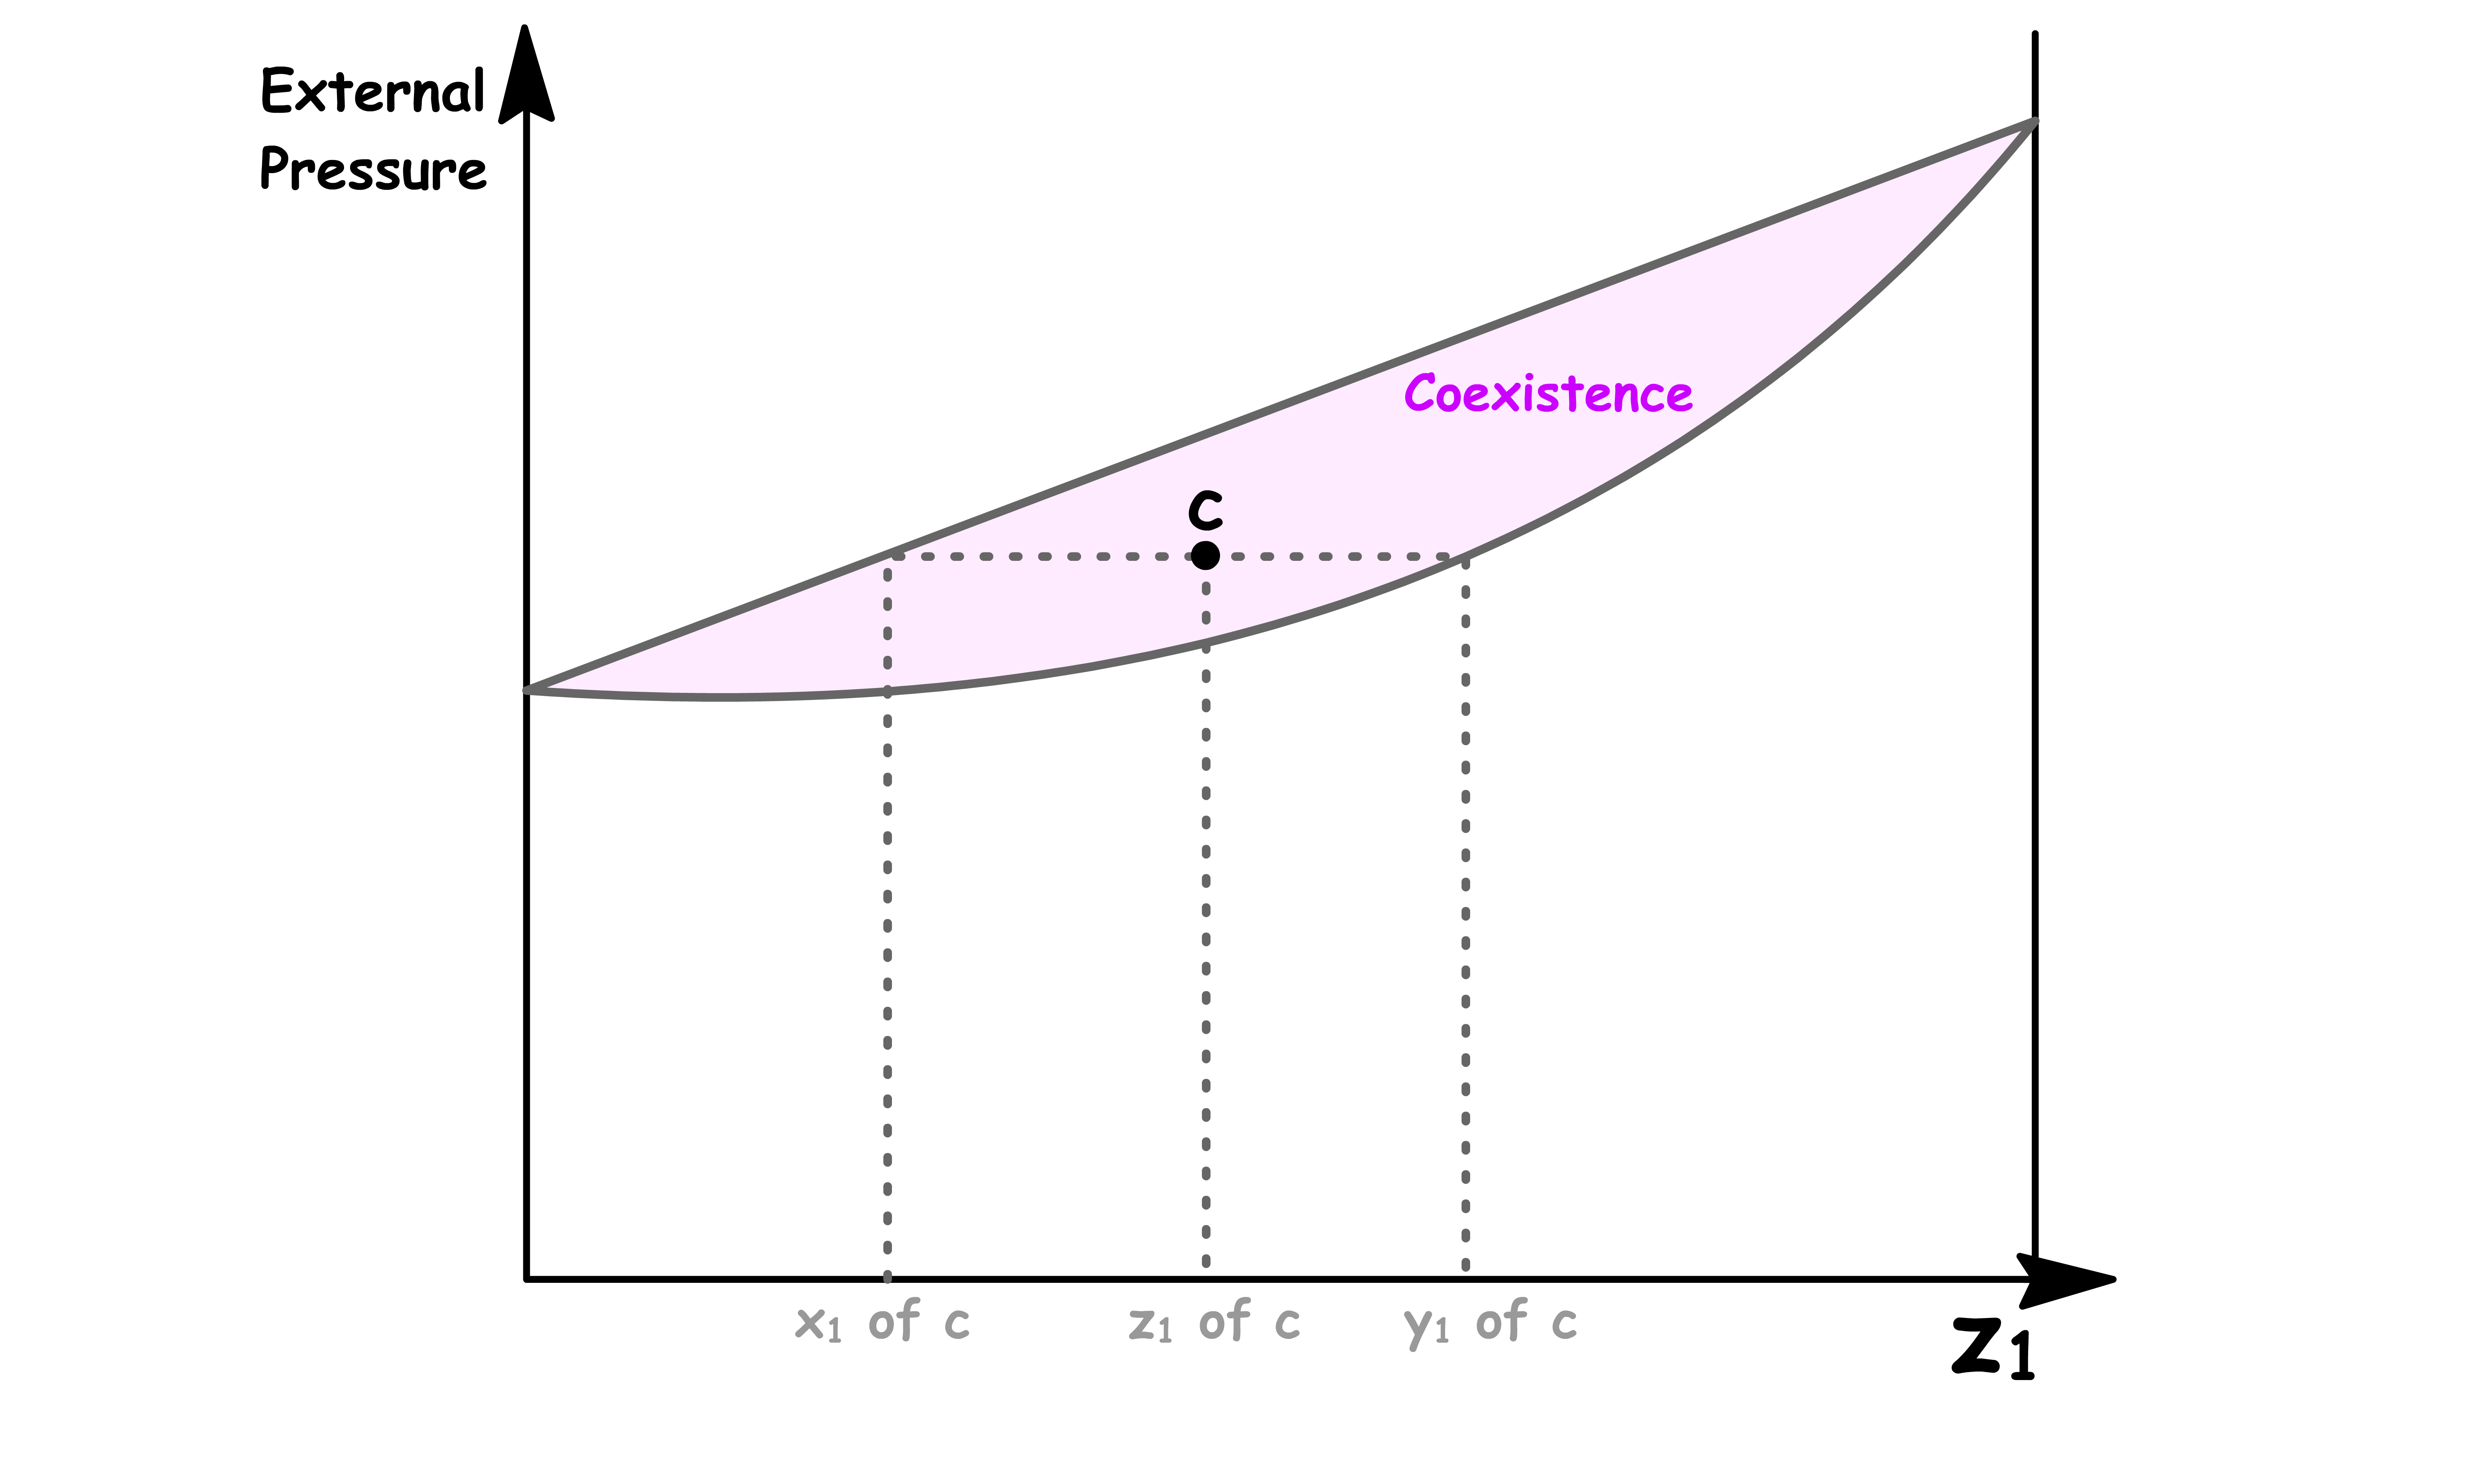
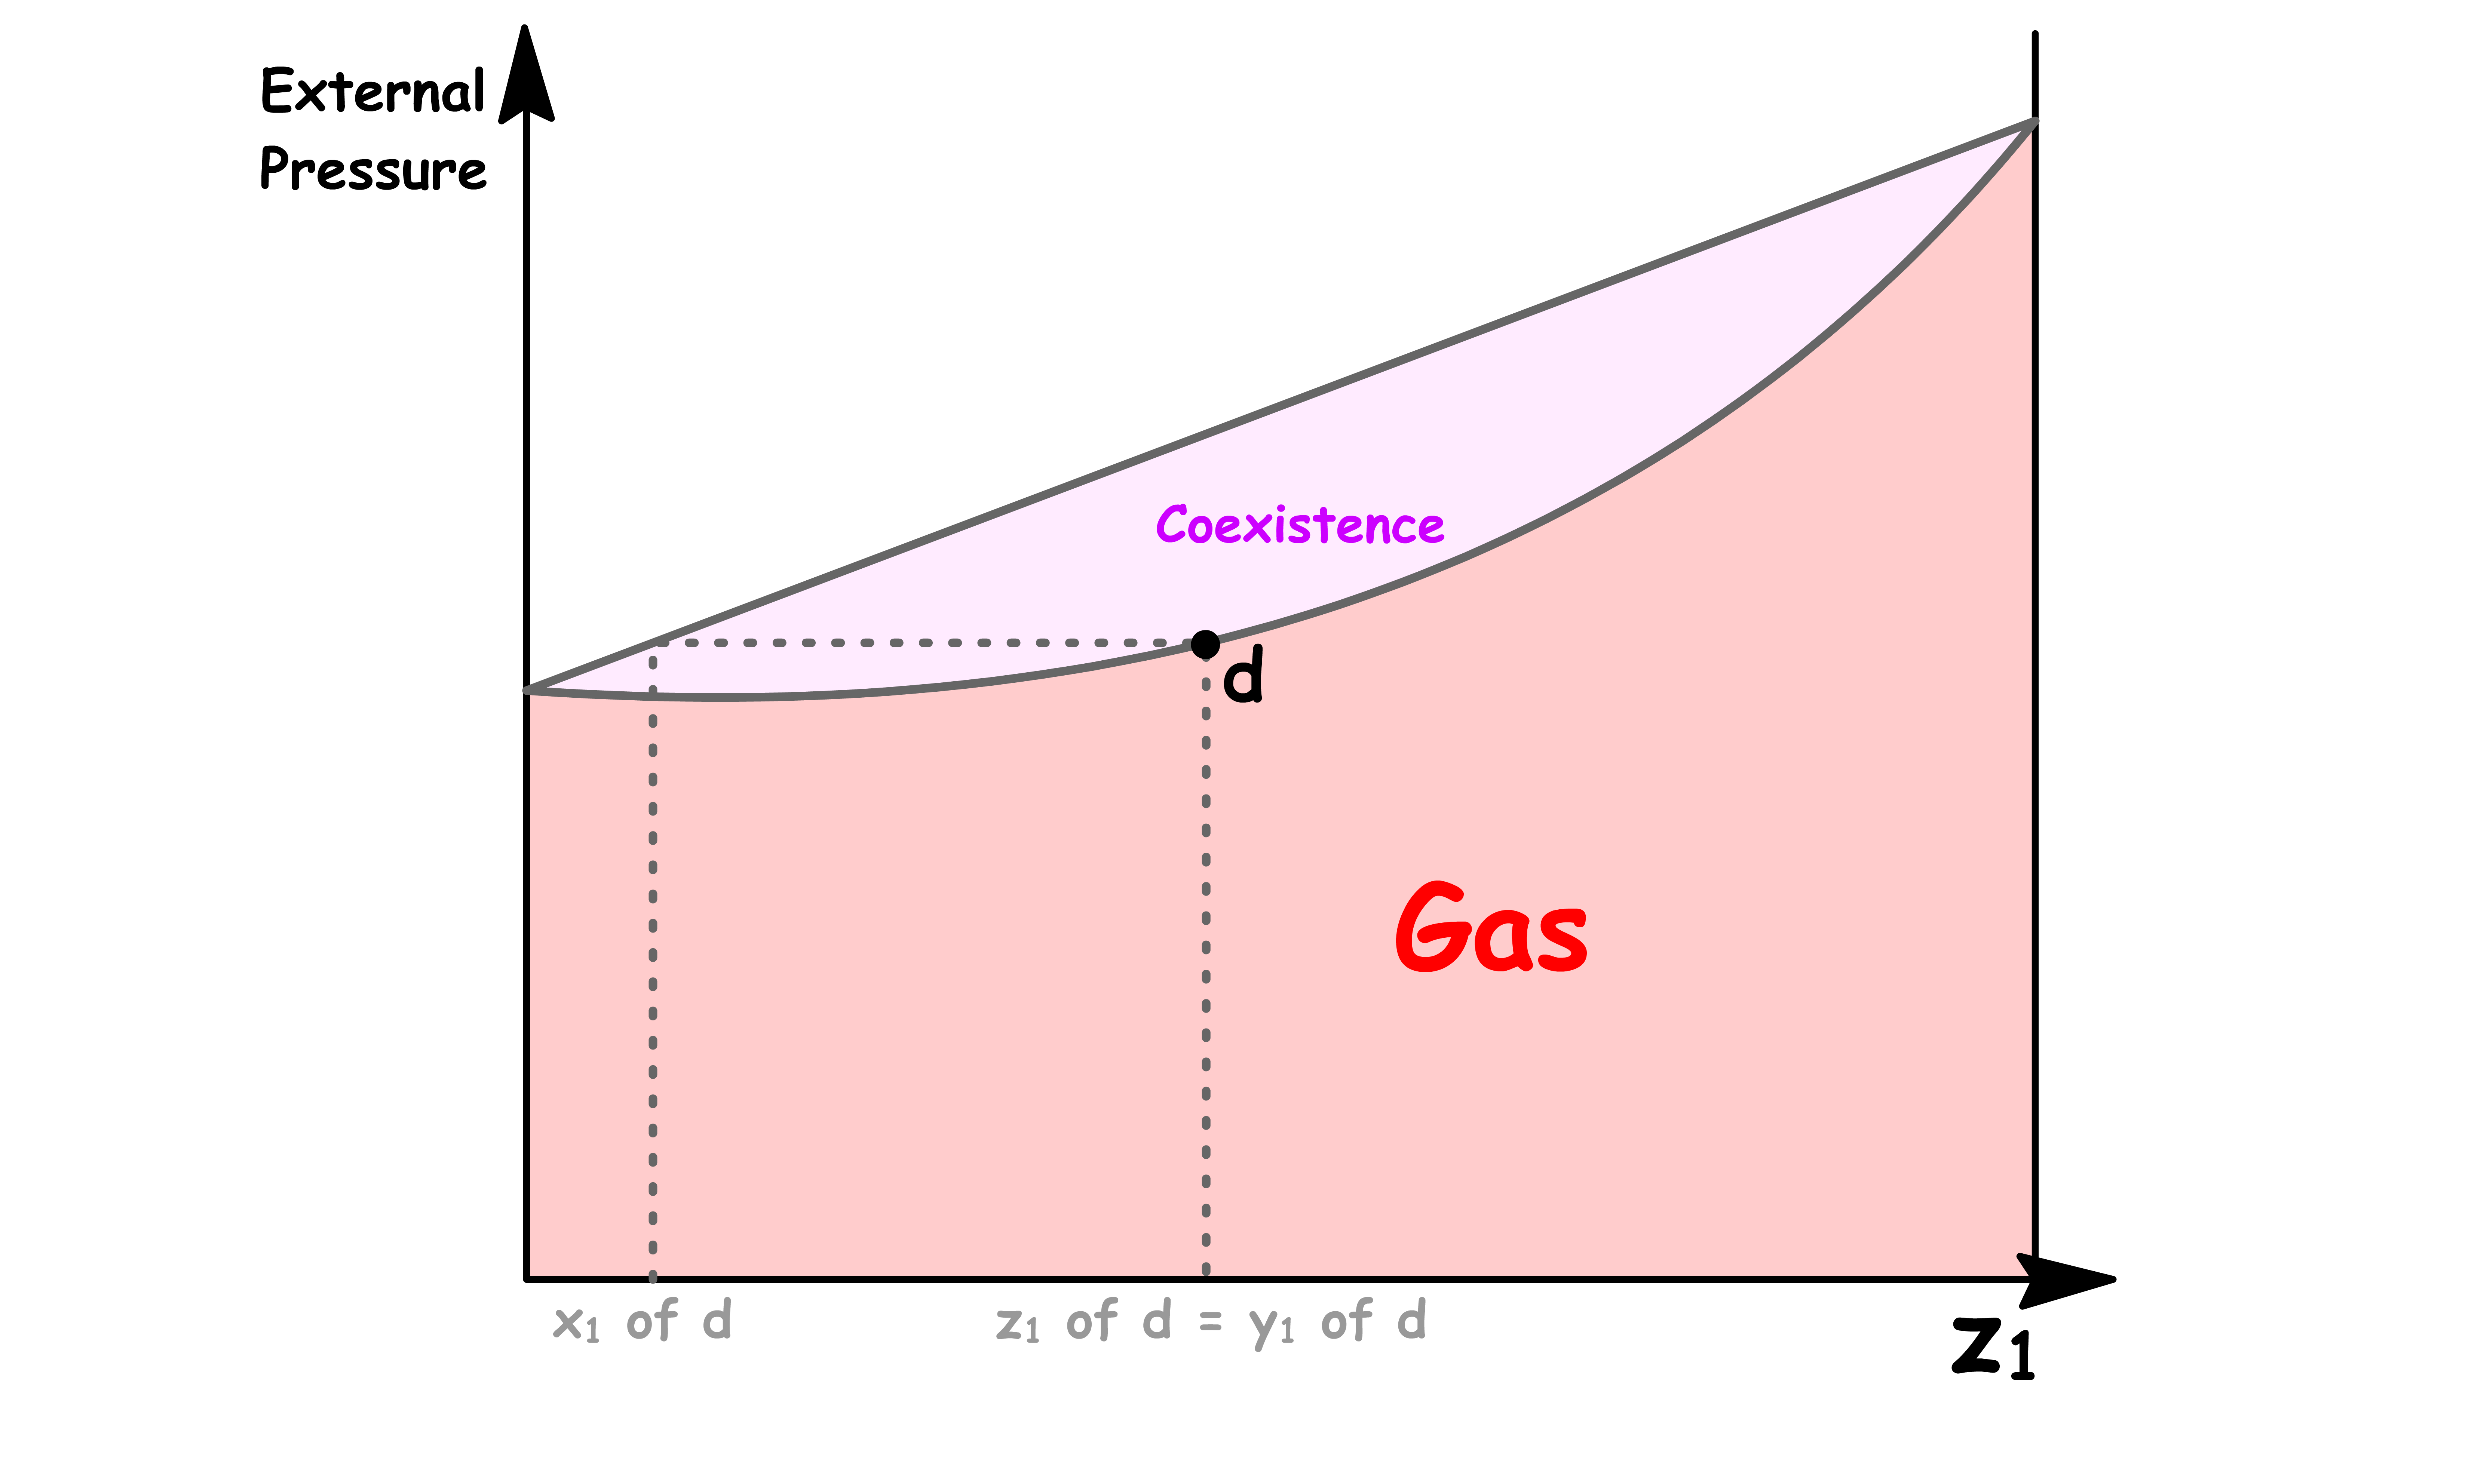
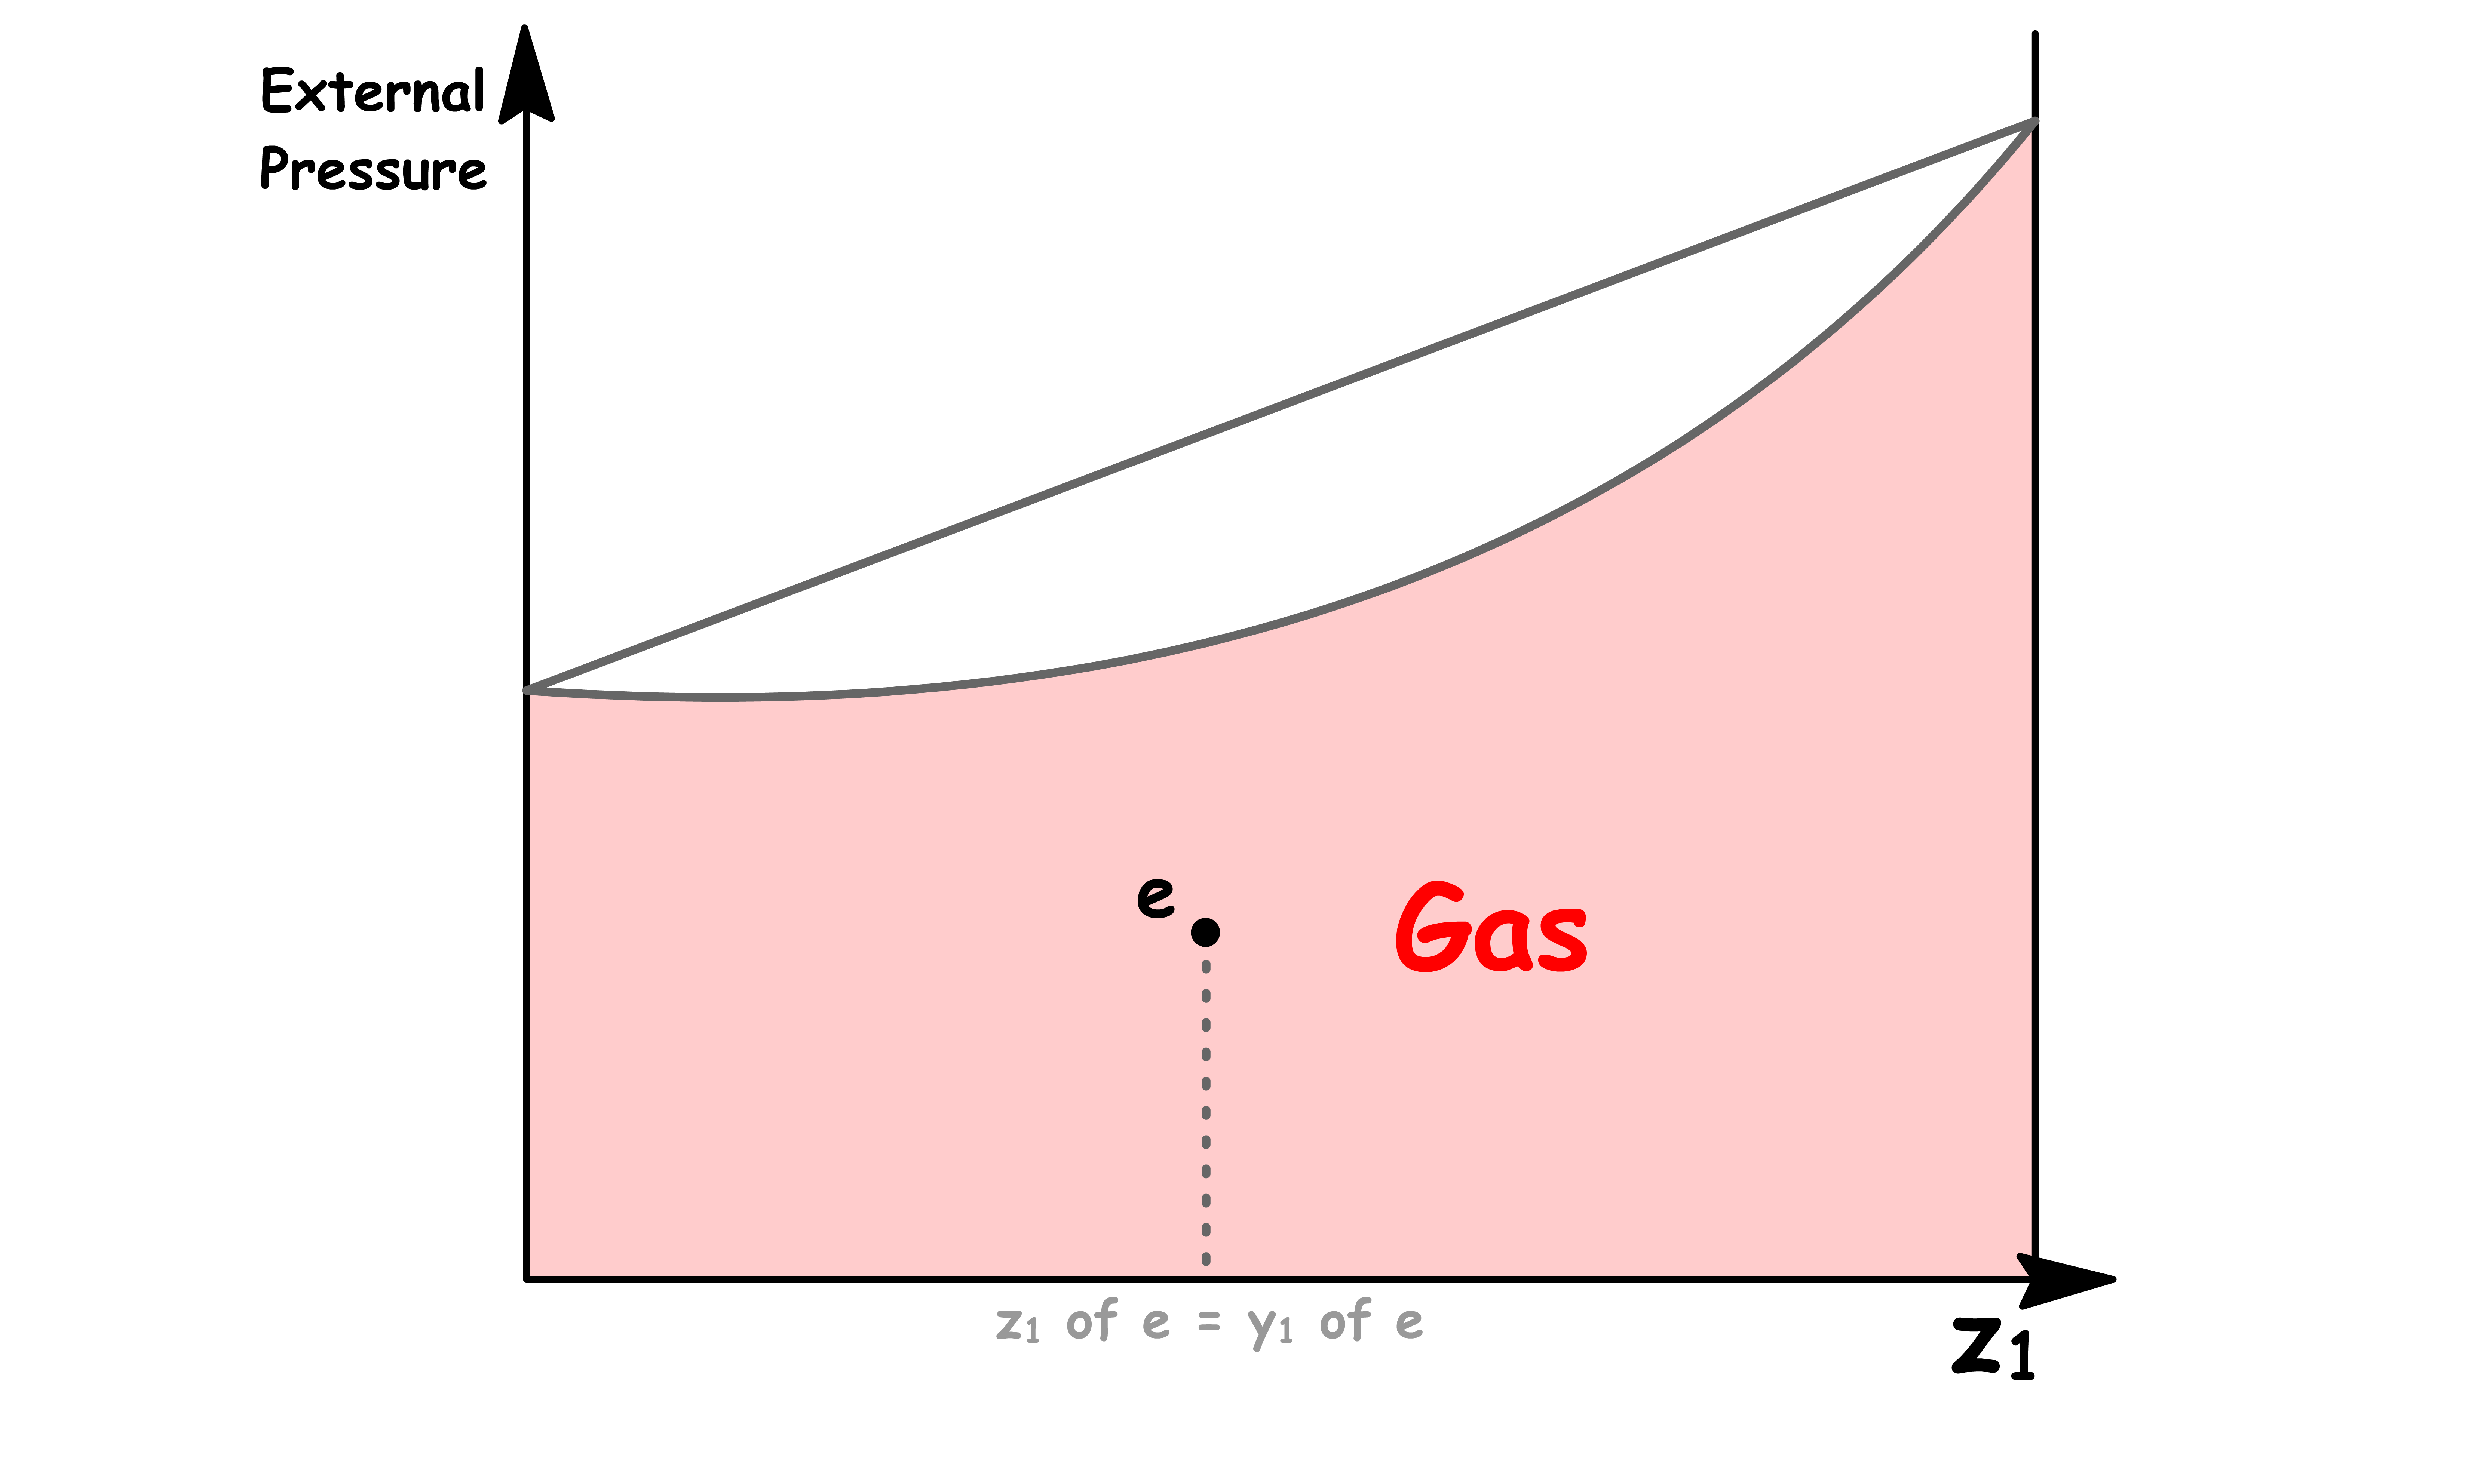
- Lowering the pressure whilst keeping the overall composition the same allows us the go from point a to b to c to d to e
- This vertical line is called an isopleth
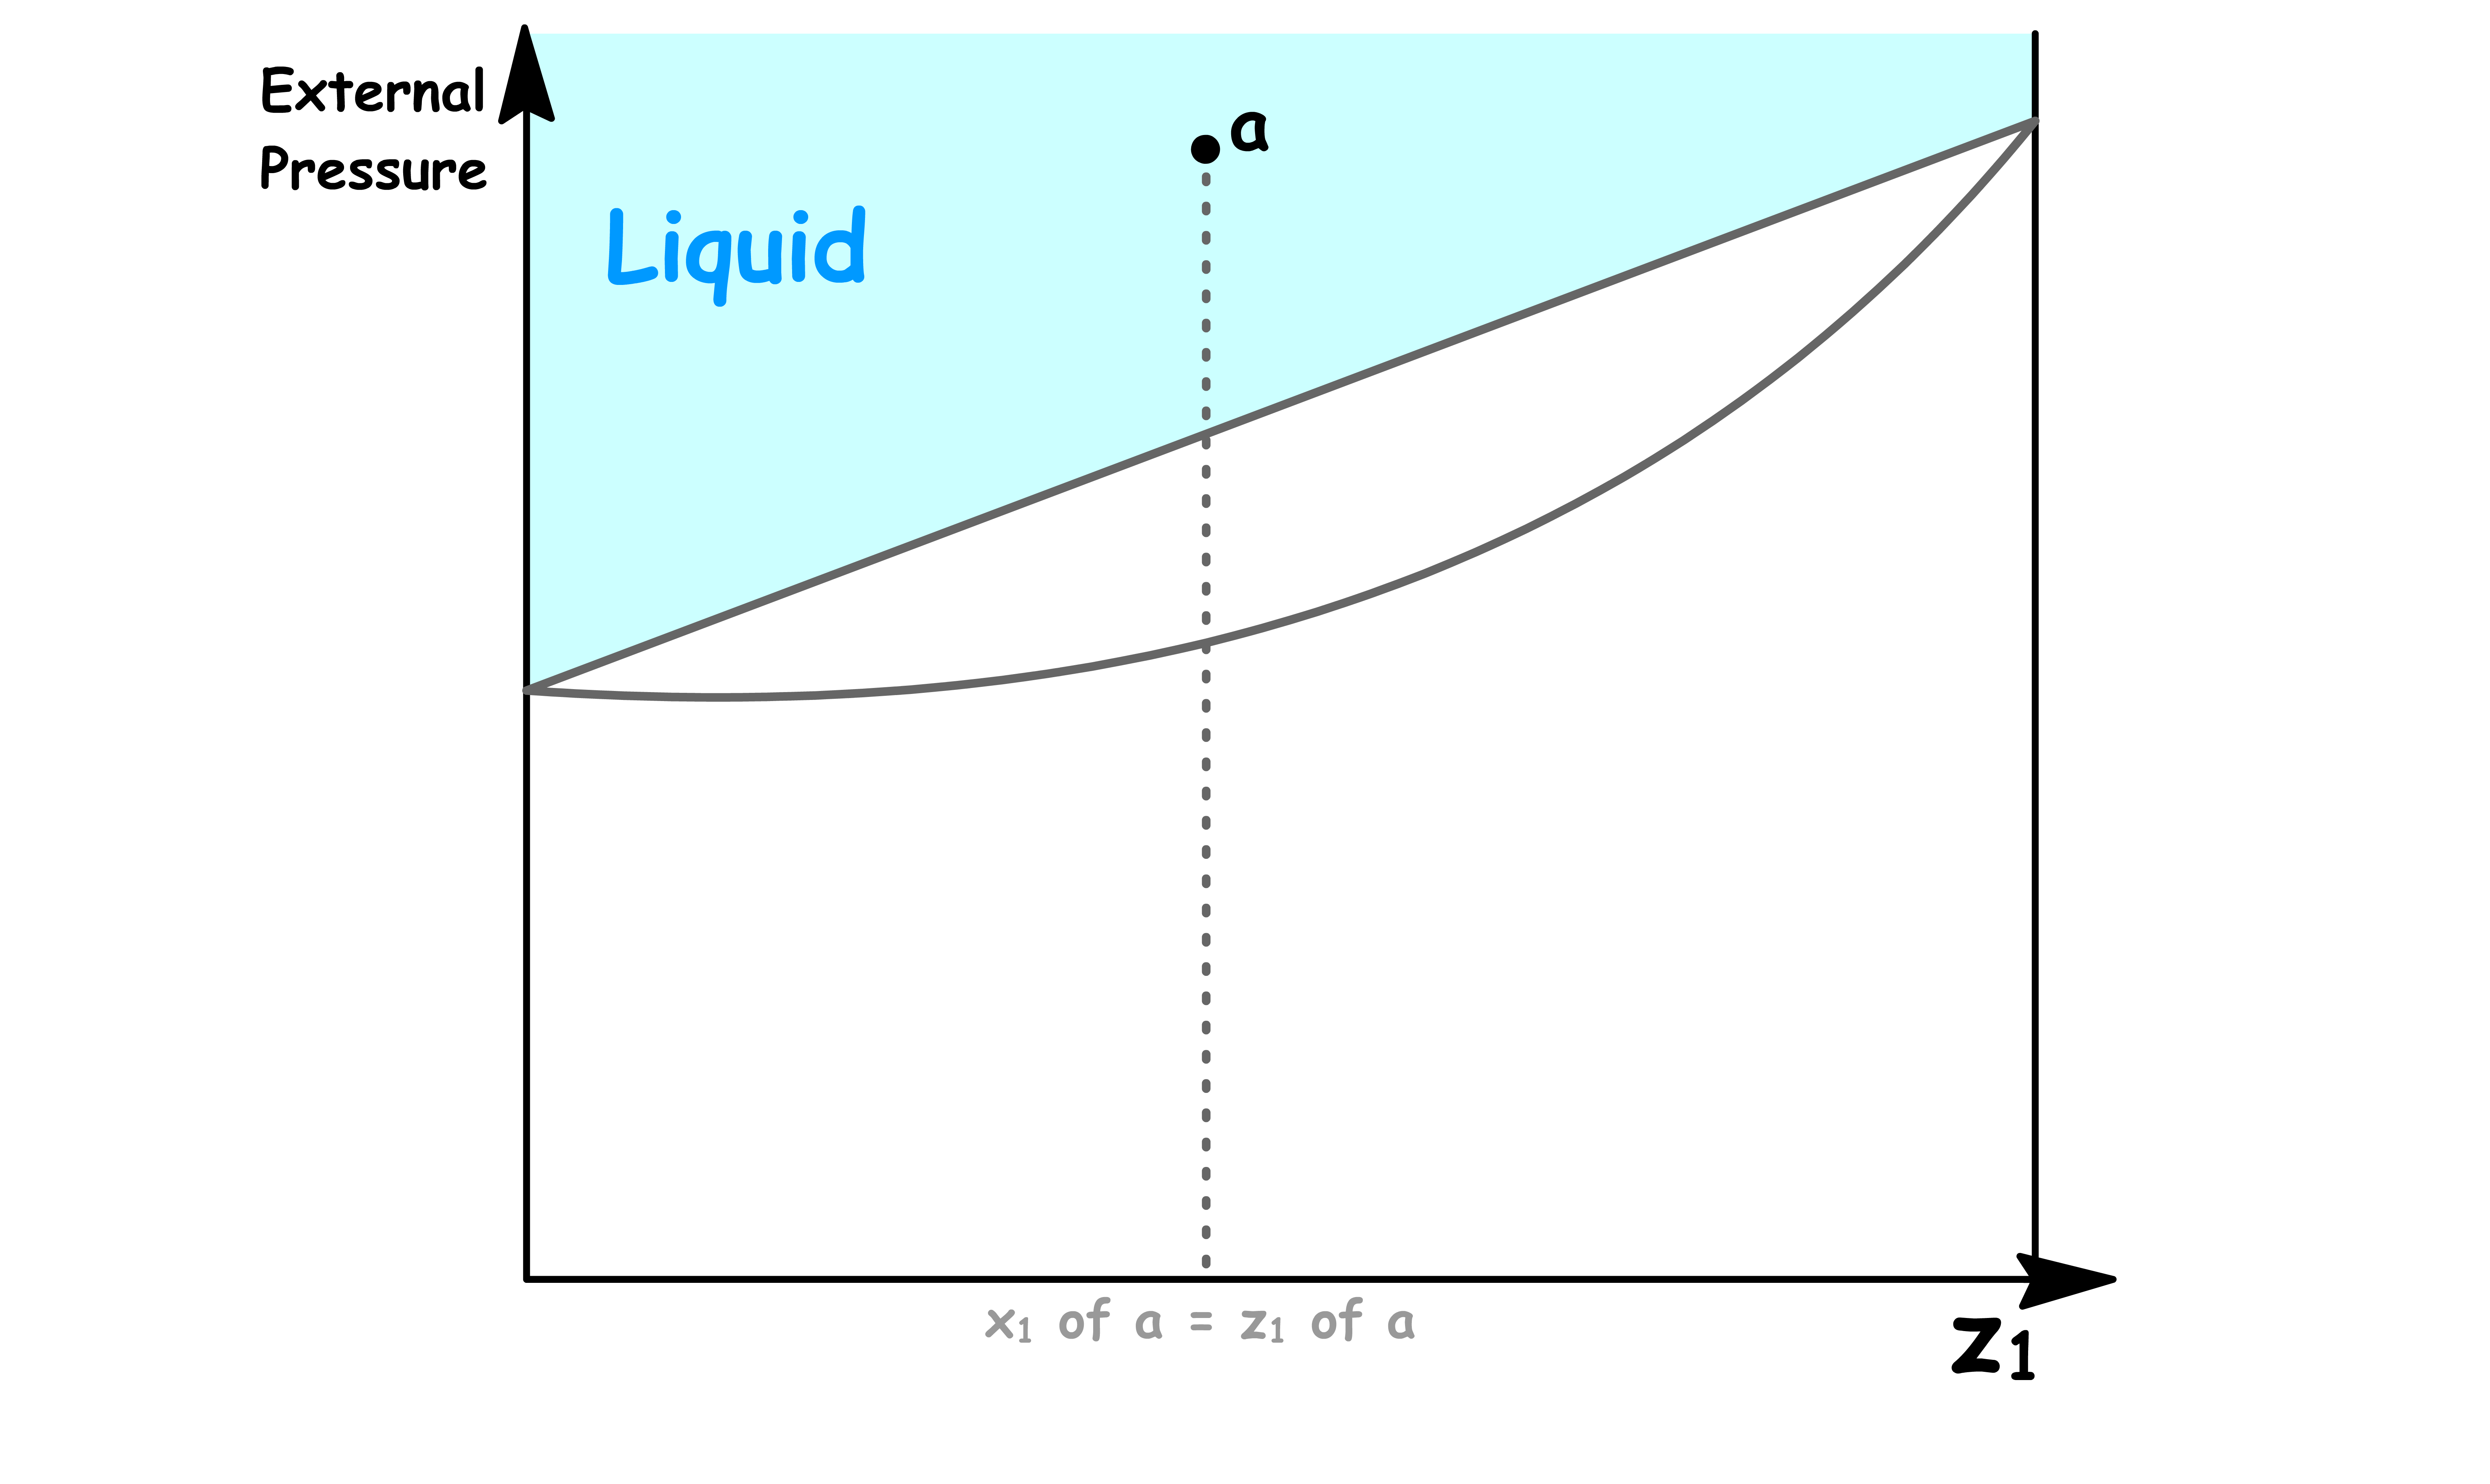
Point a
- At point a, the sample consists of a single liquid phase
- Since there is no vapour present, the overall mole fraction is equal to the mole fraction of solution
Point b
- At point b, the liquid can exist in equilibrium with the its vapour
- The composition of the solution is equal to the overall composition, so we have to conclude that at this pressure there is virtually no vapour present
- However, the composition of that tiny amount of vapour present can be determined by drawing a horizontal line called the tie line
Point c
- At point c, liquid and vapour coexists
- The composition of solution and the composition in the vapour phase can be determined by drawing the tie line
Point d
- At point d, the vapour can exist in equilibrium with the liquid
- The composition of the vapour is equal to the overall composition, so we have to conclude that at this pressure there is virtually no liquid present
- However, the composition of that tiny amount of liquid present can be determined by drawing a horizontal line called the tie line
Point e
- At point e, the sample consists of a single liquid phase
- Since there is no vapour present, the overall mole fraction is equal to the mole fraction of solution
¶ Temperature-Composition Phase Diagram for Ideal Solutions
At any given temperature, the phase of the system depends on the external pressure and mole fractions
¶ Constructing the Temperature-Composition Phase Diagram for Ideal Solutions
- The basic principle of constructing a Temperature-Composition Phase Diagram is quite similar to that of a Pressure-Composition Phase Diagram, so we can be brief here
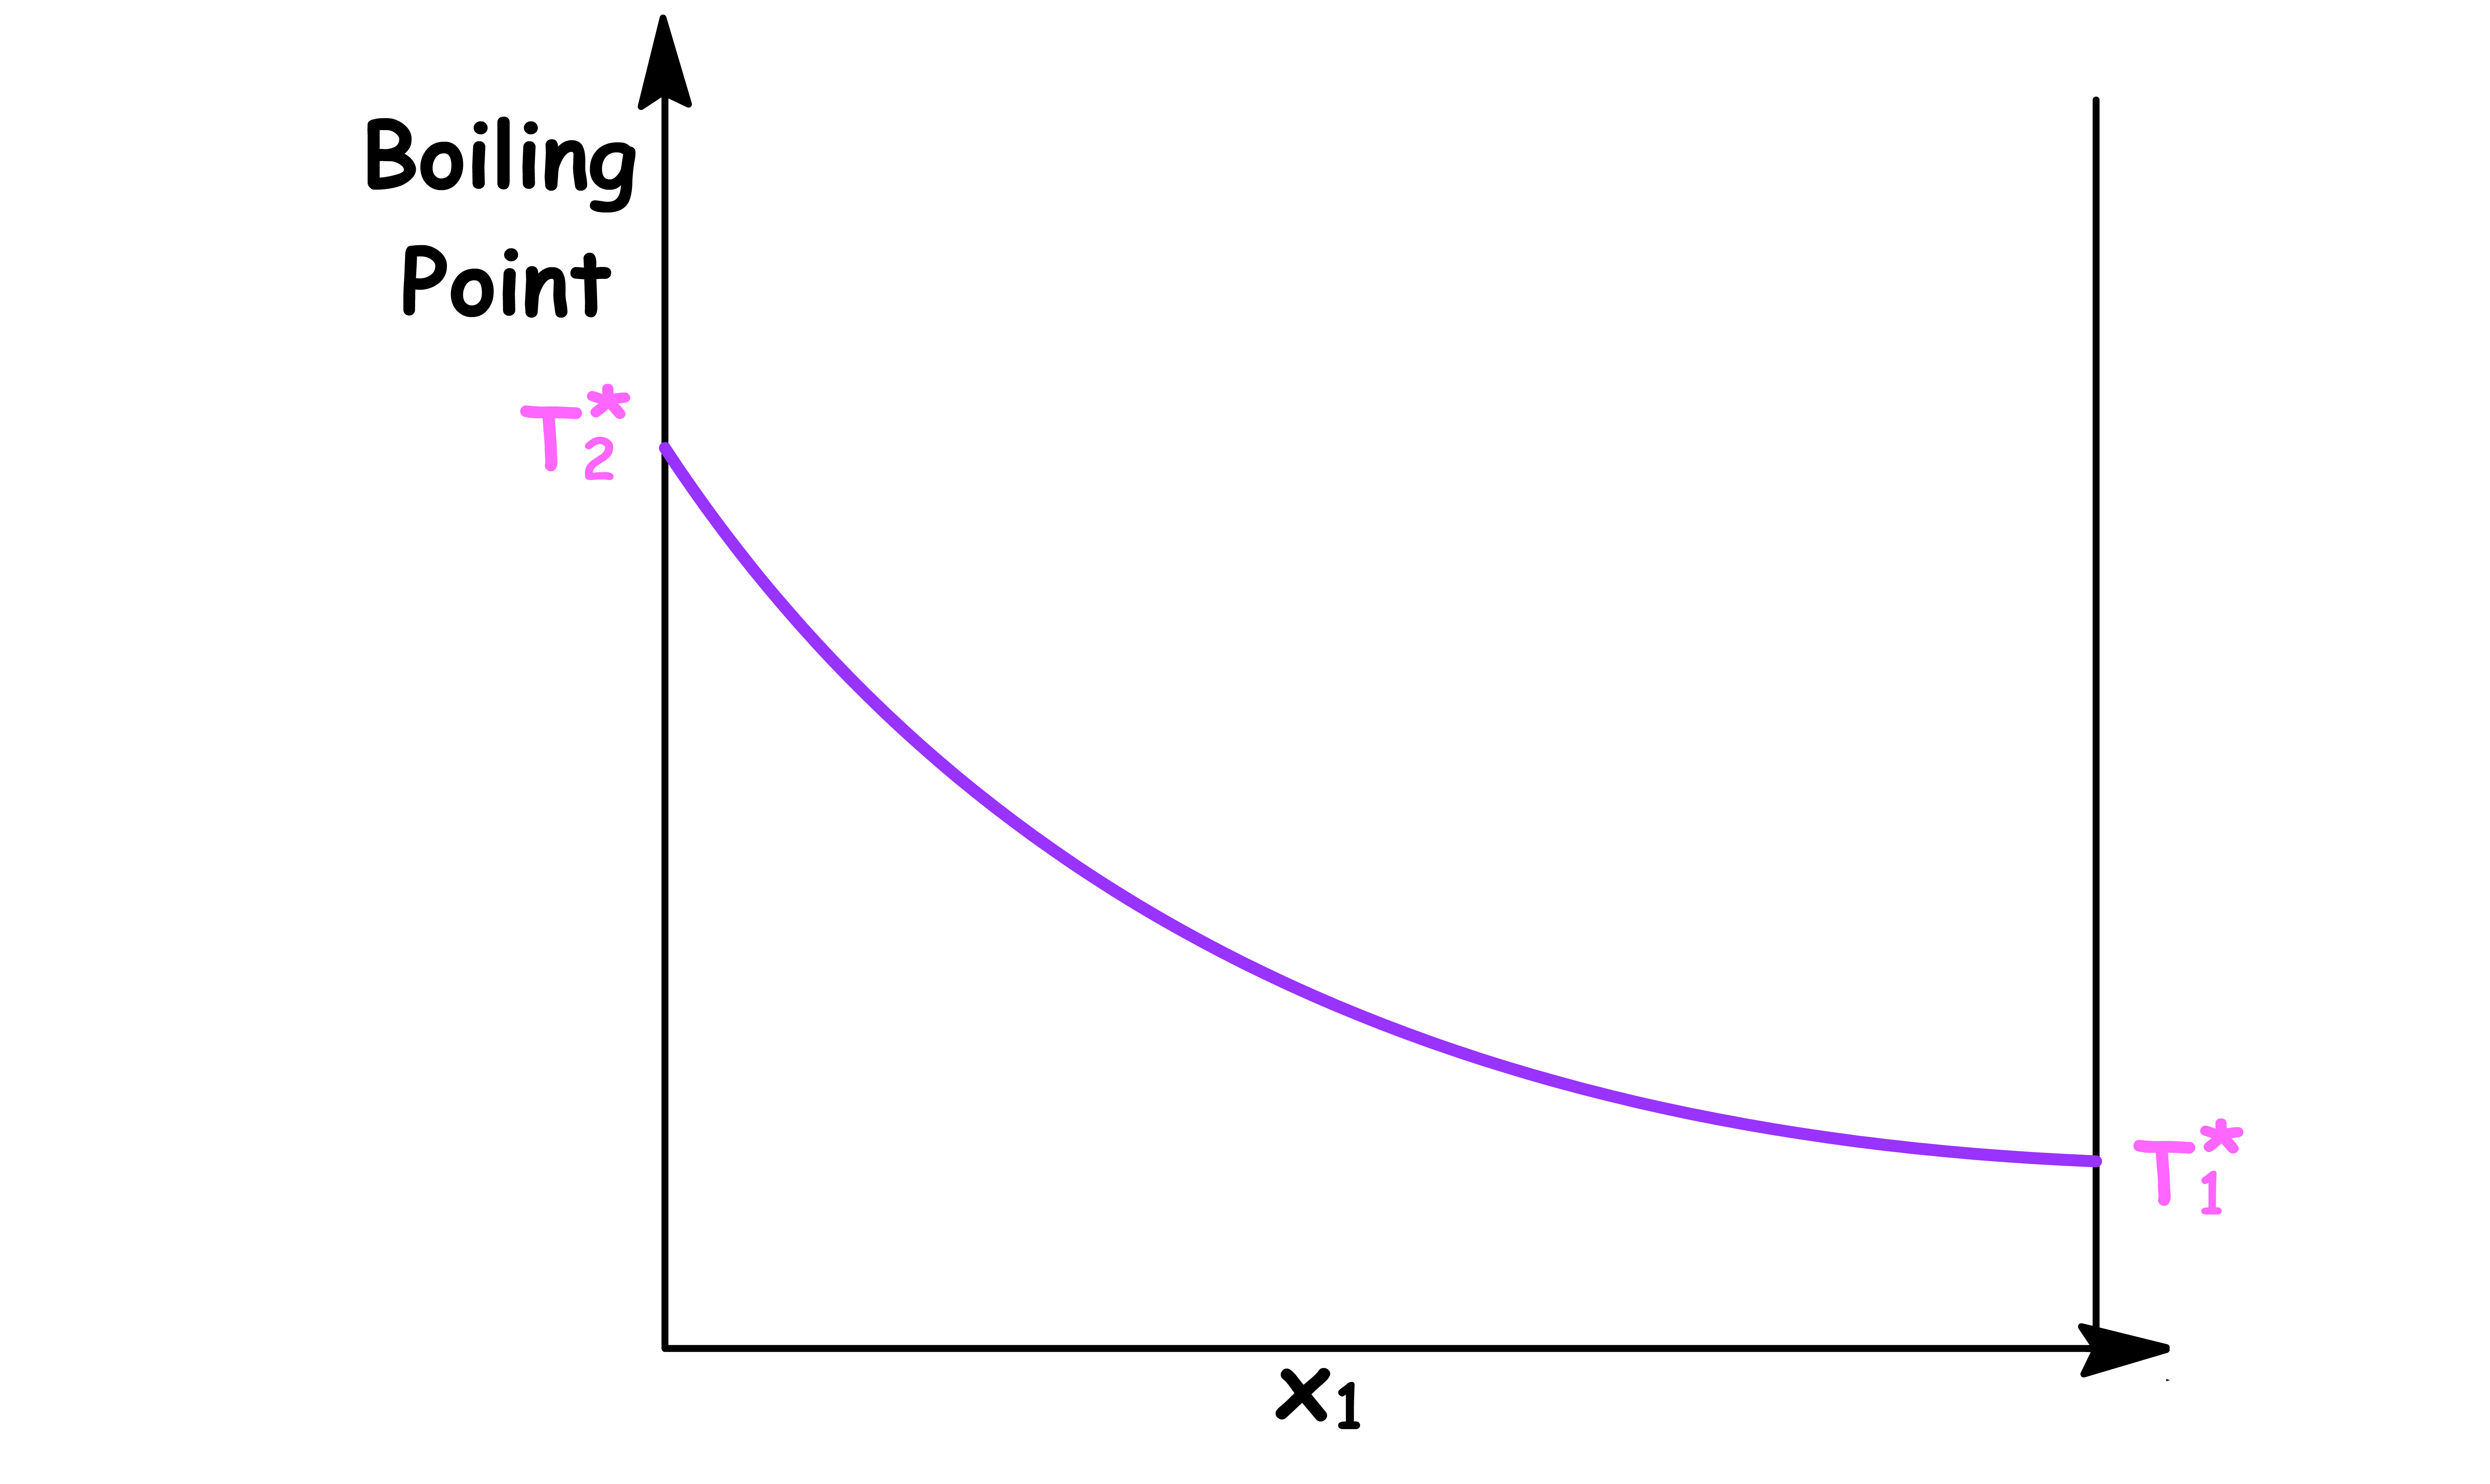
Temperature vs Mole Fraction in Solution ( x1 )
- The boiling point varys with the composition of the solution
- and are the boiling point of pure component 1 and pure component 2 respectively
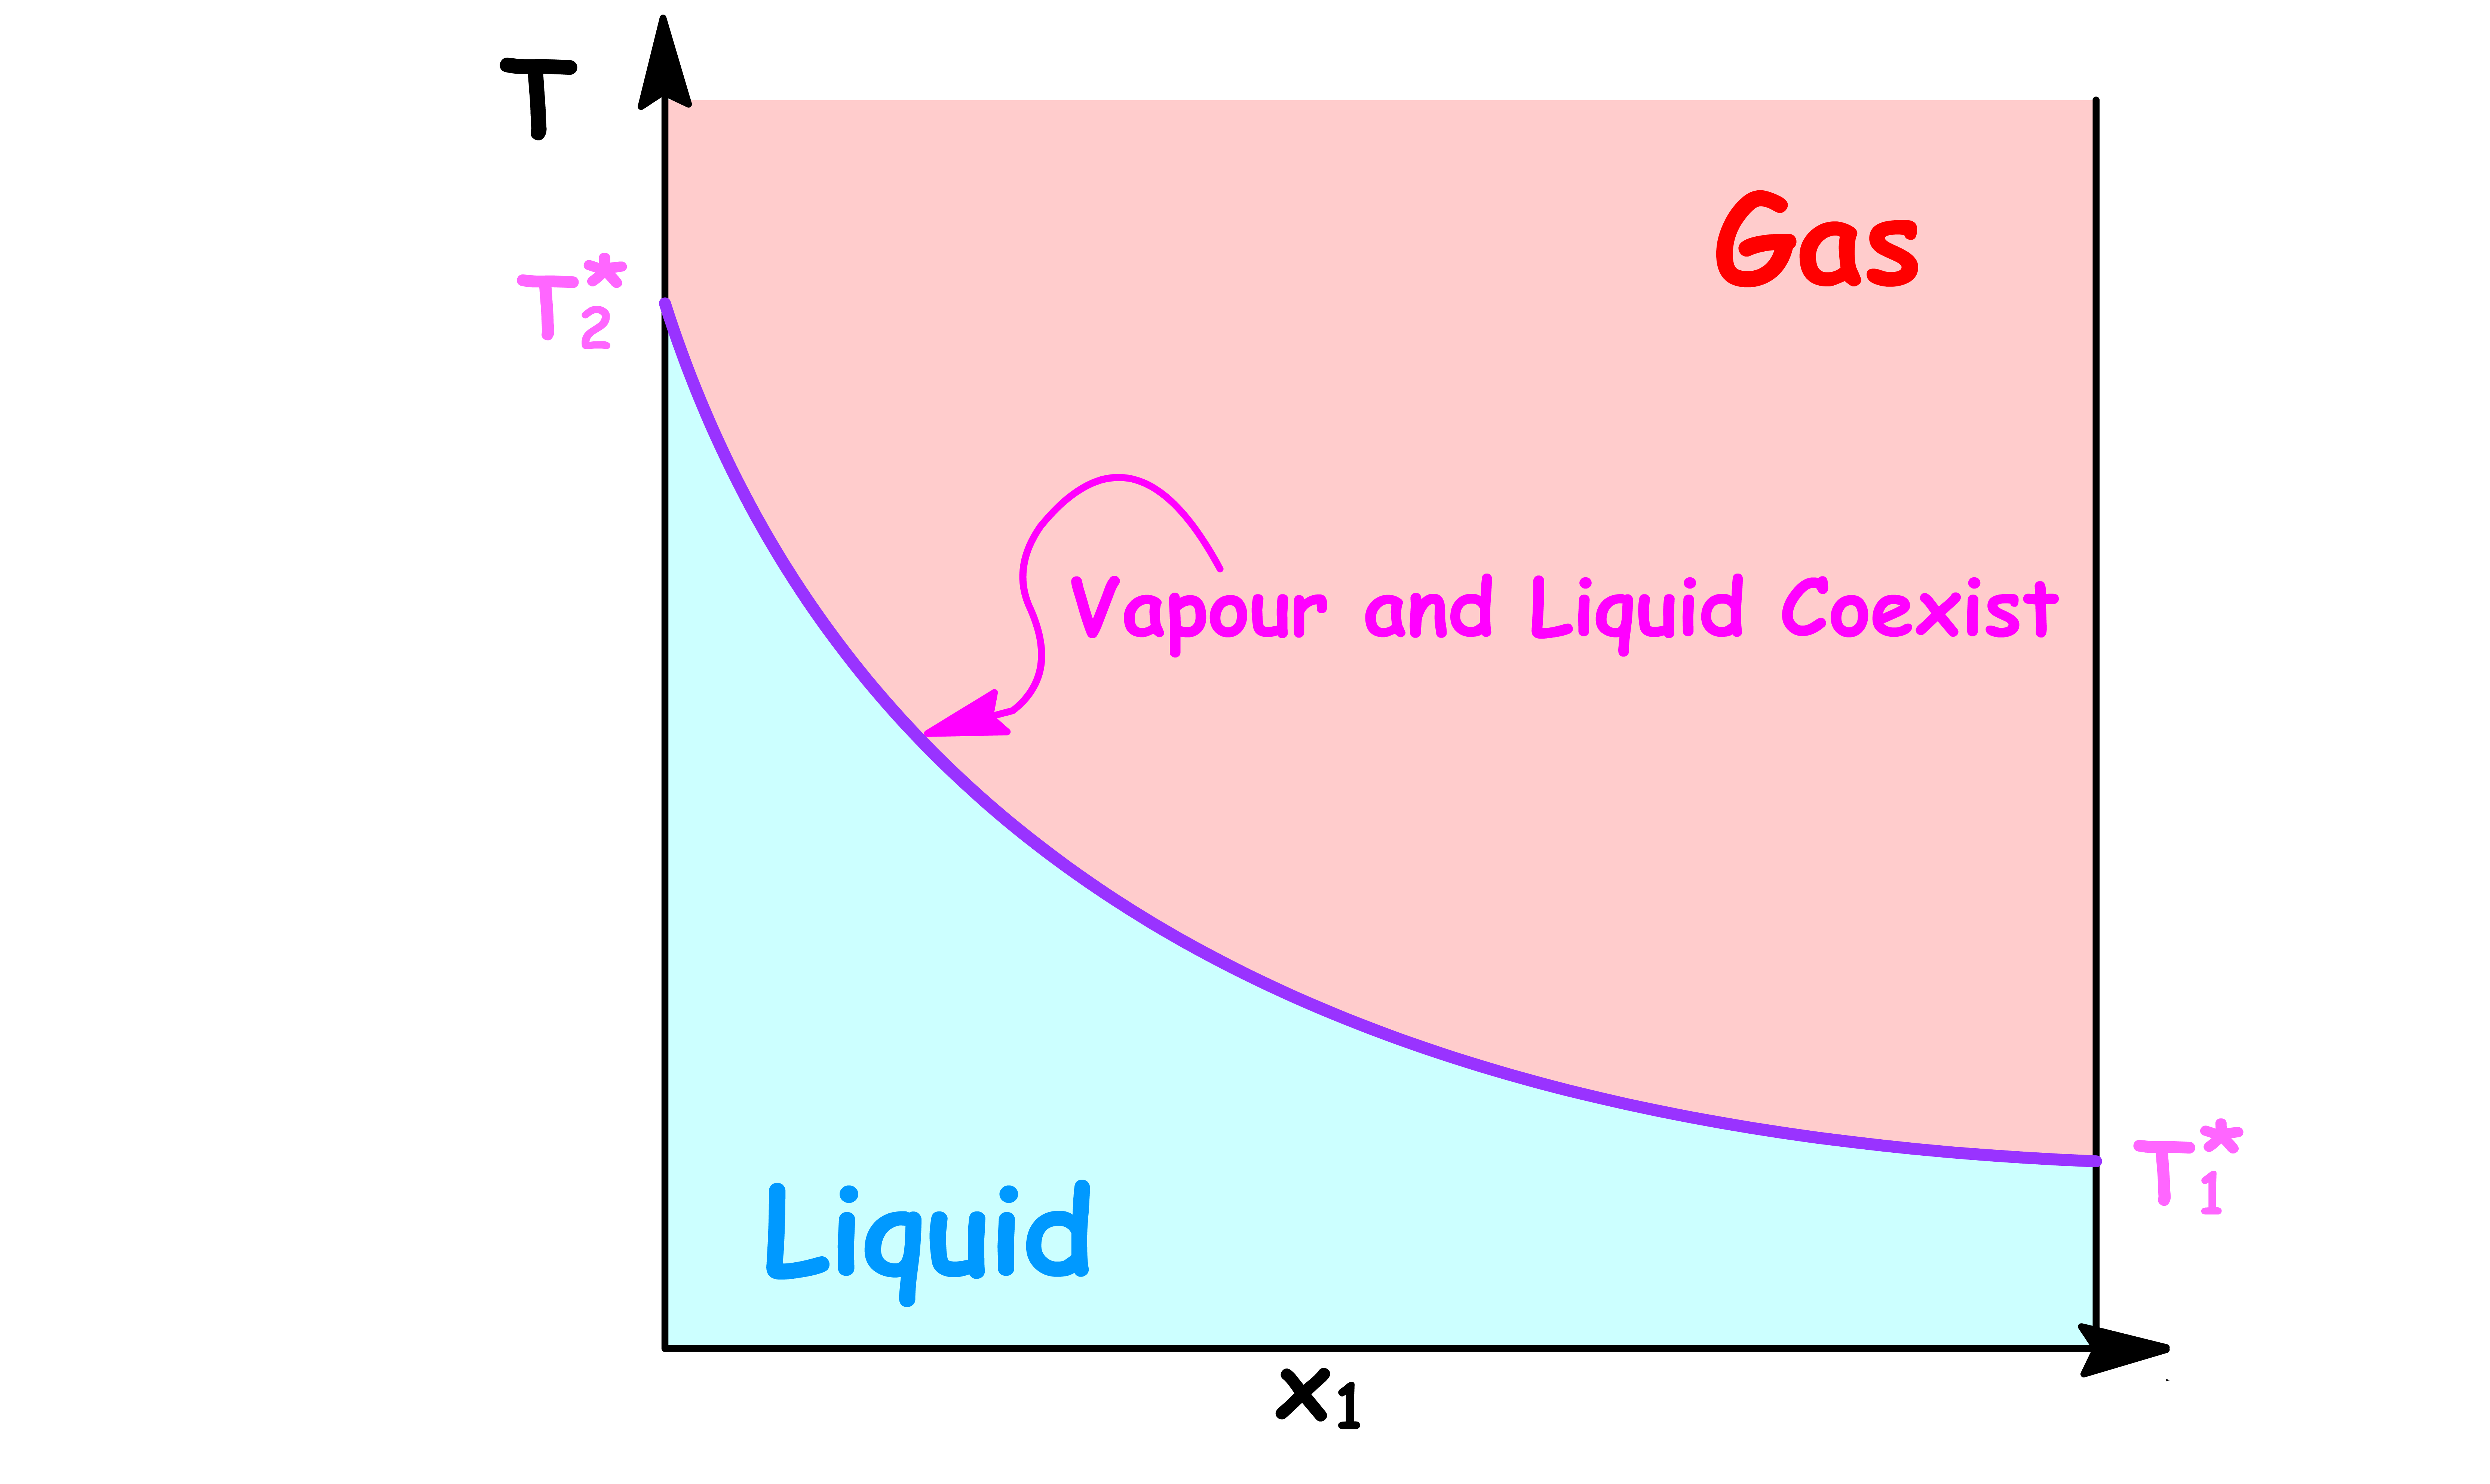
By changing the y-axis from boiling point to the temperature of the system, we have constructed a simple phase diagram
- When the temperature of the system is lower than the boiling point, the system is consist of a single liquid phase
- When the temperature of the system is higher than the boiling point, the system is consist of a single vapour phase
- When the temperature of the system is equal to the boiling point, the system will contain a both the liquid and vapour phase
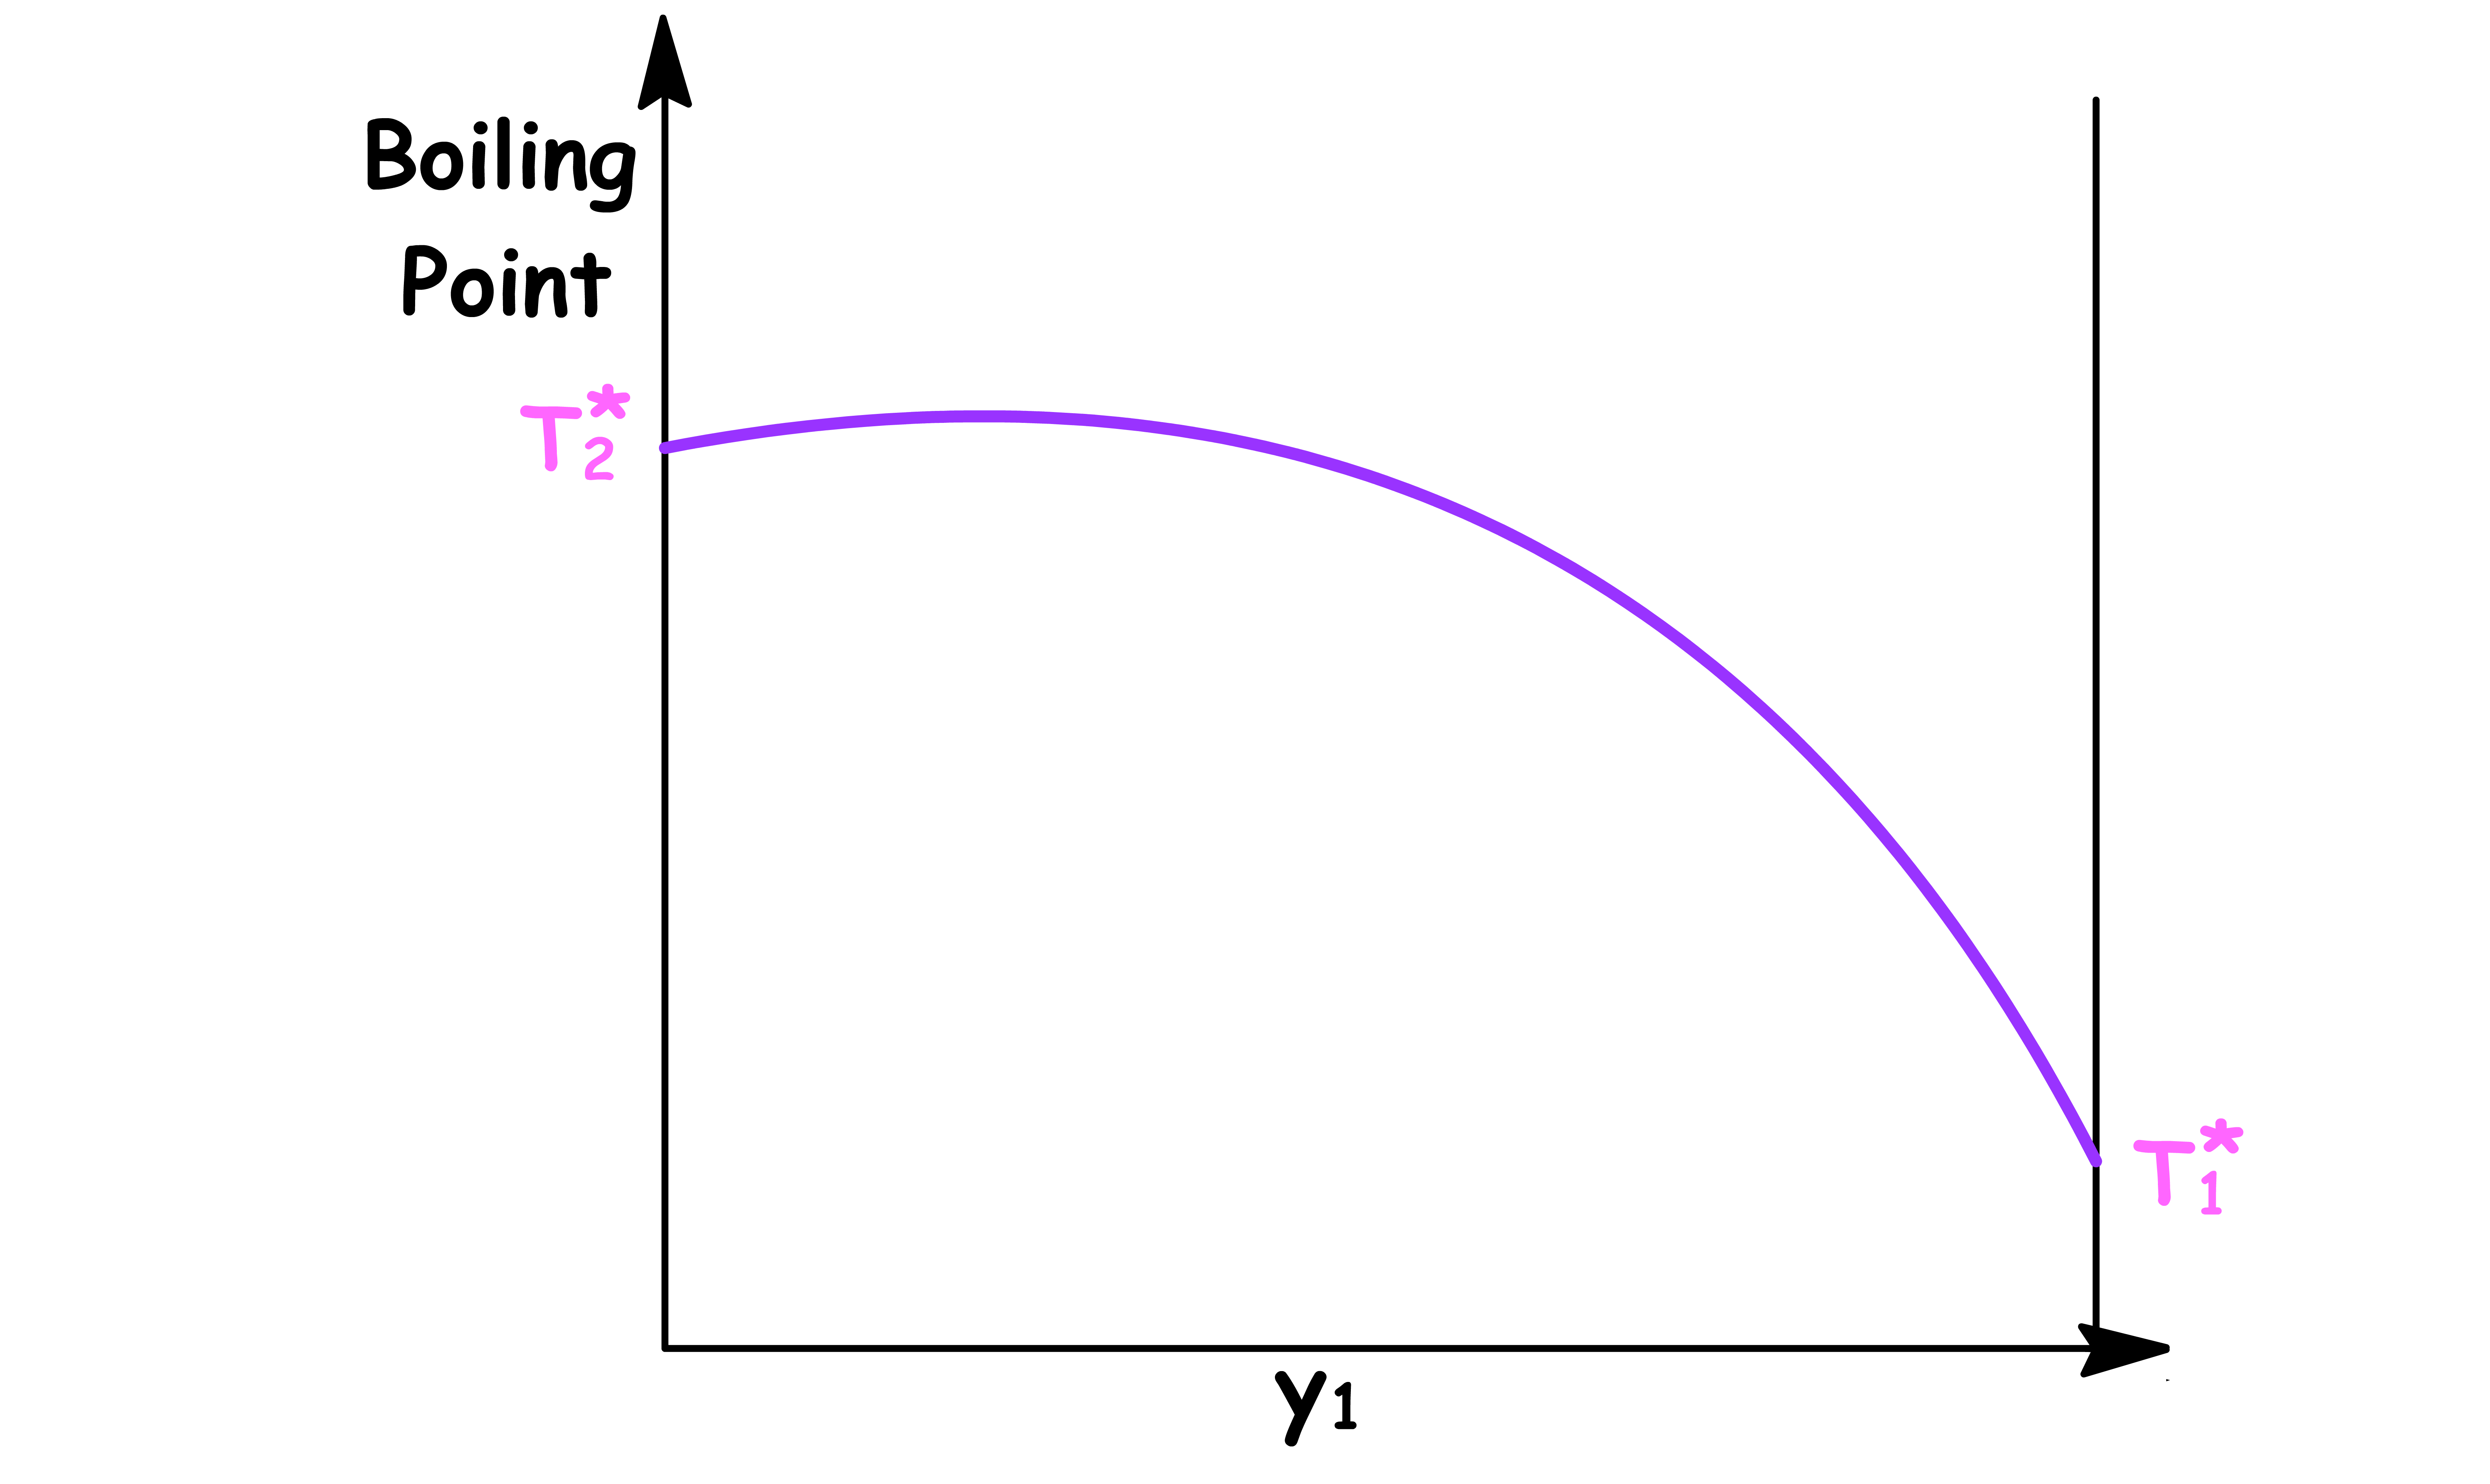
Temperature vs Mole Fraction in Vapour Phase ( y1 )
- The boiling point varys with the composition of the vapour phase
- and are the boiling point of pure component 1 and pure component 2 respectively
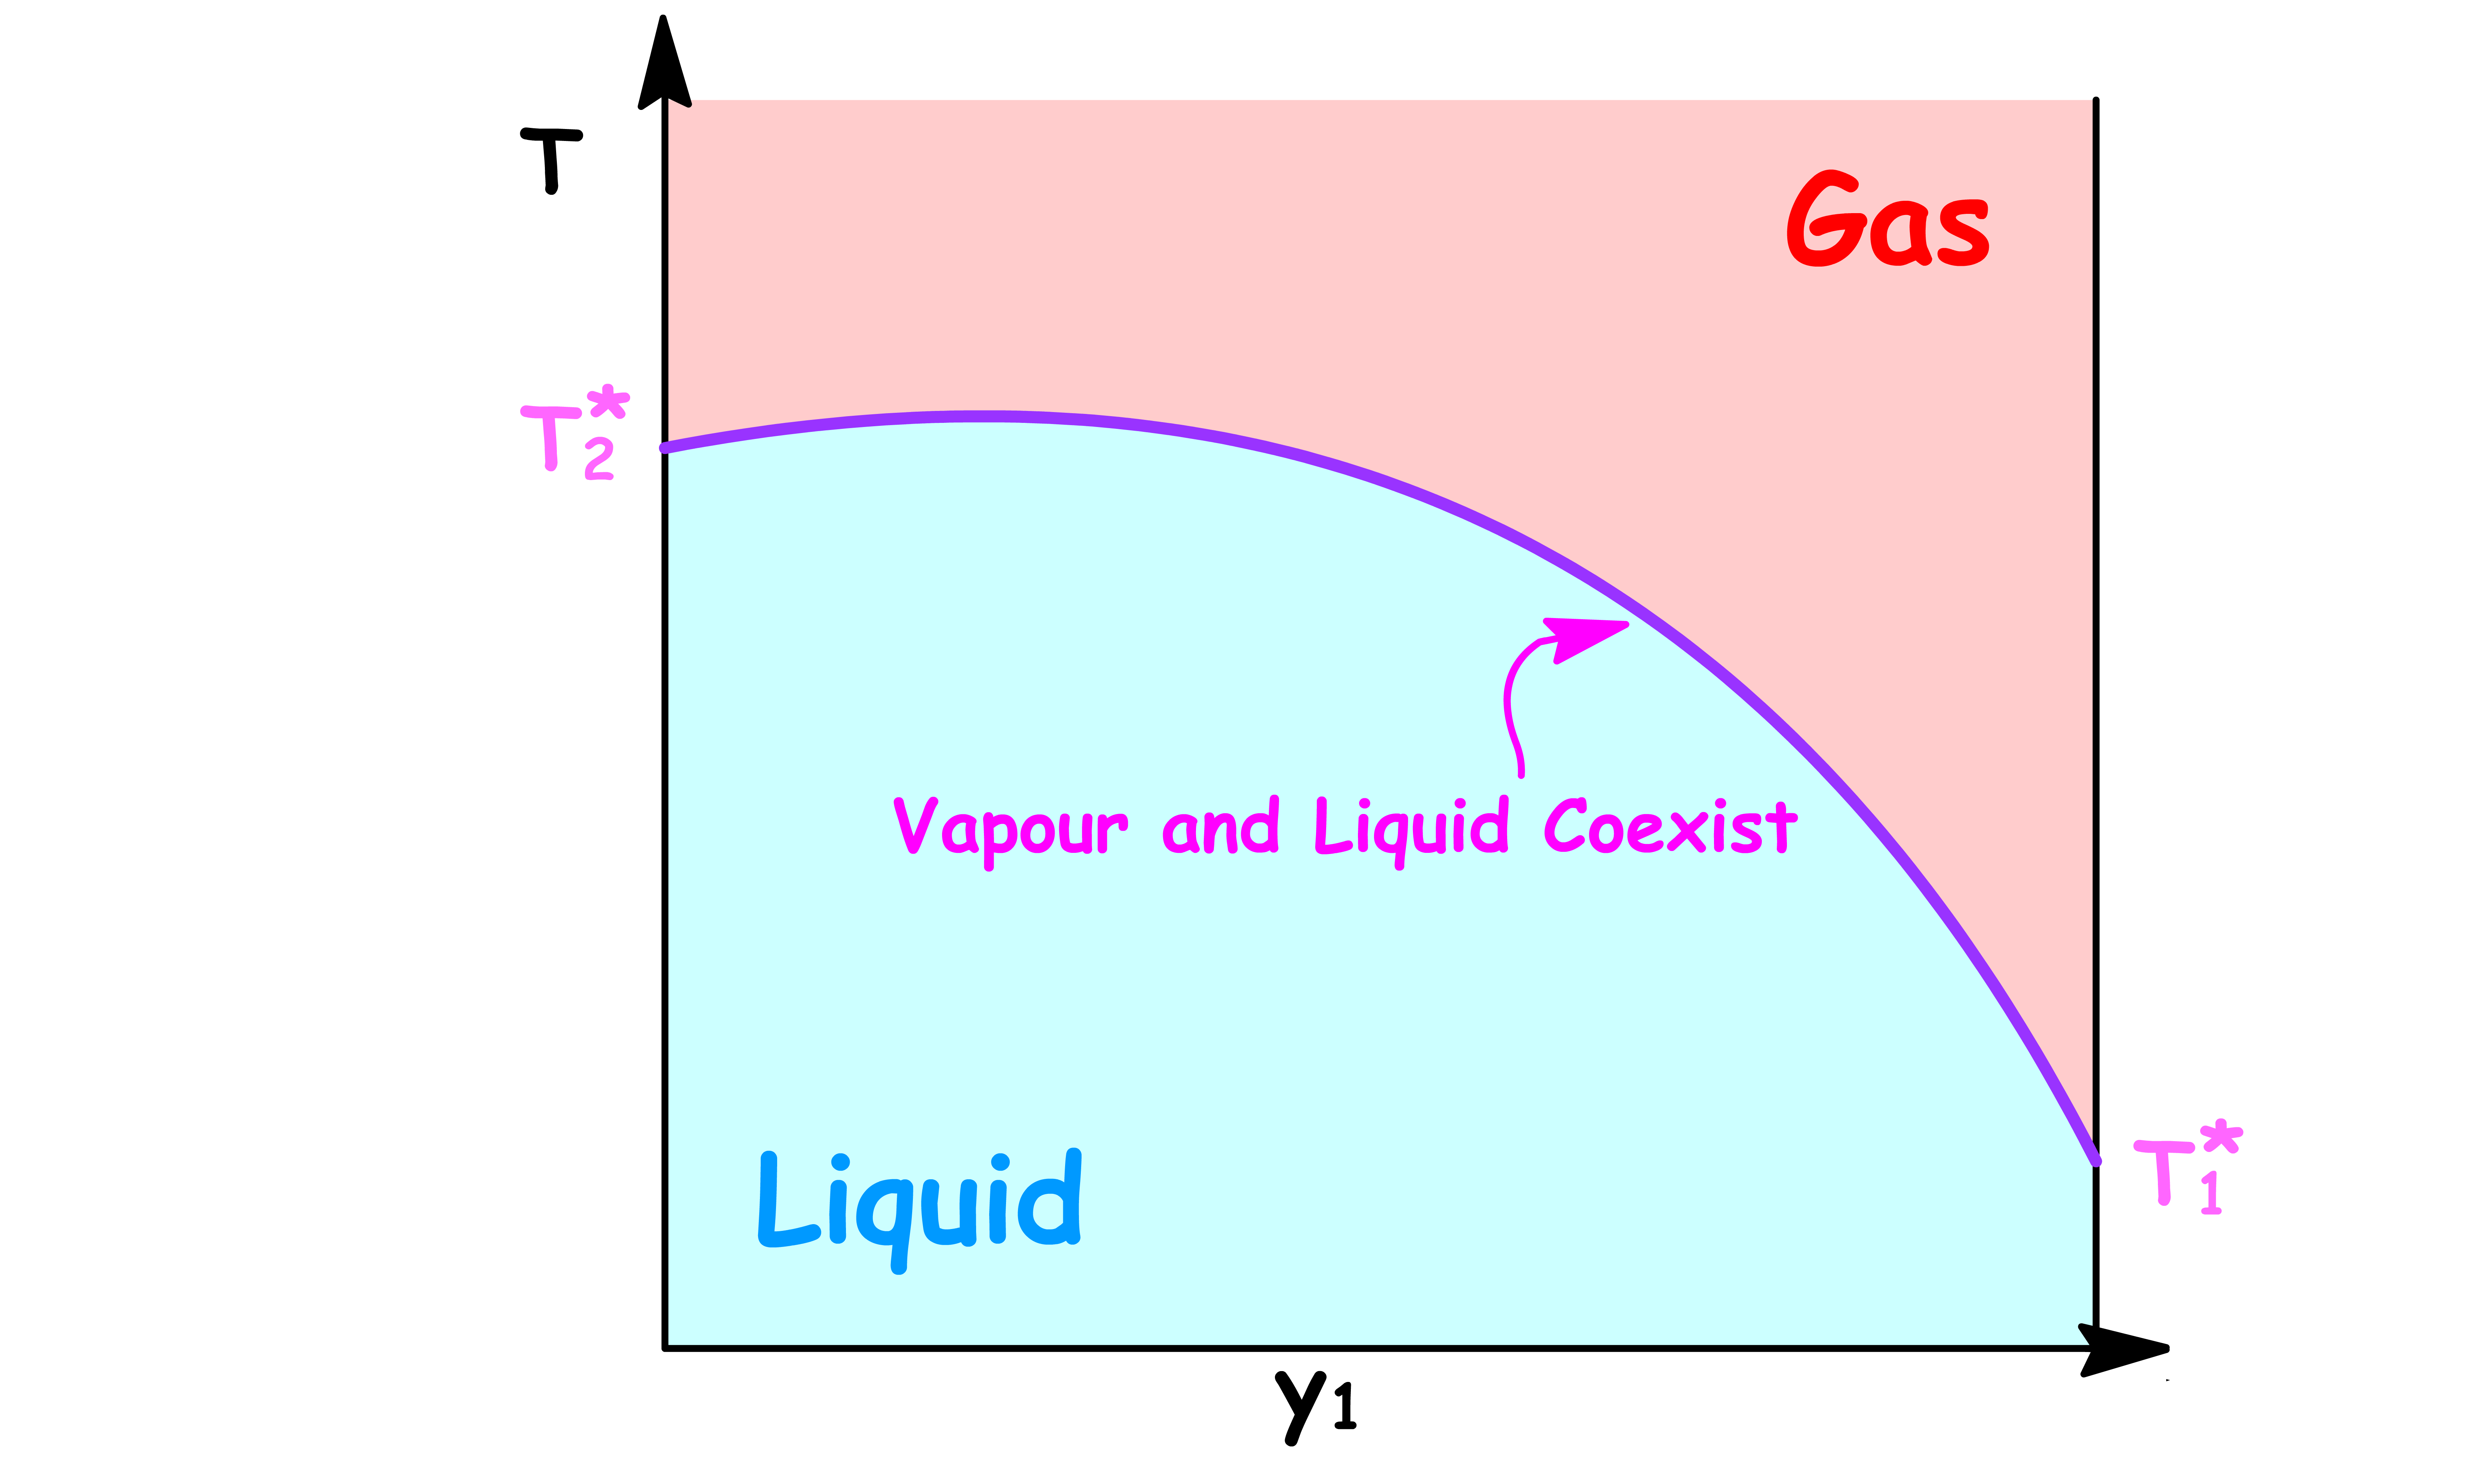
By changing the y-axis from boiling point to the temperature of the system, we have constructed a simple phase diagram
- When the temperature of the system is lower than the boiling point, the system is consist of a single liquid phase
- When the temperature of the system is higher than the boiling point, the system is consist of a single vapour phase
- When the temperature of the system is equal to the boiling point, the system will contain a both the liquid and vapour phase
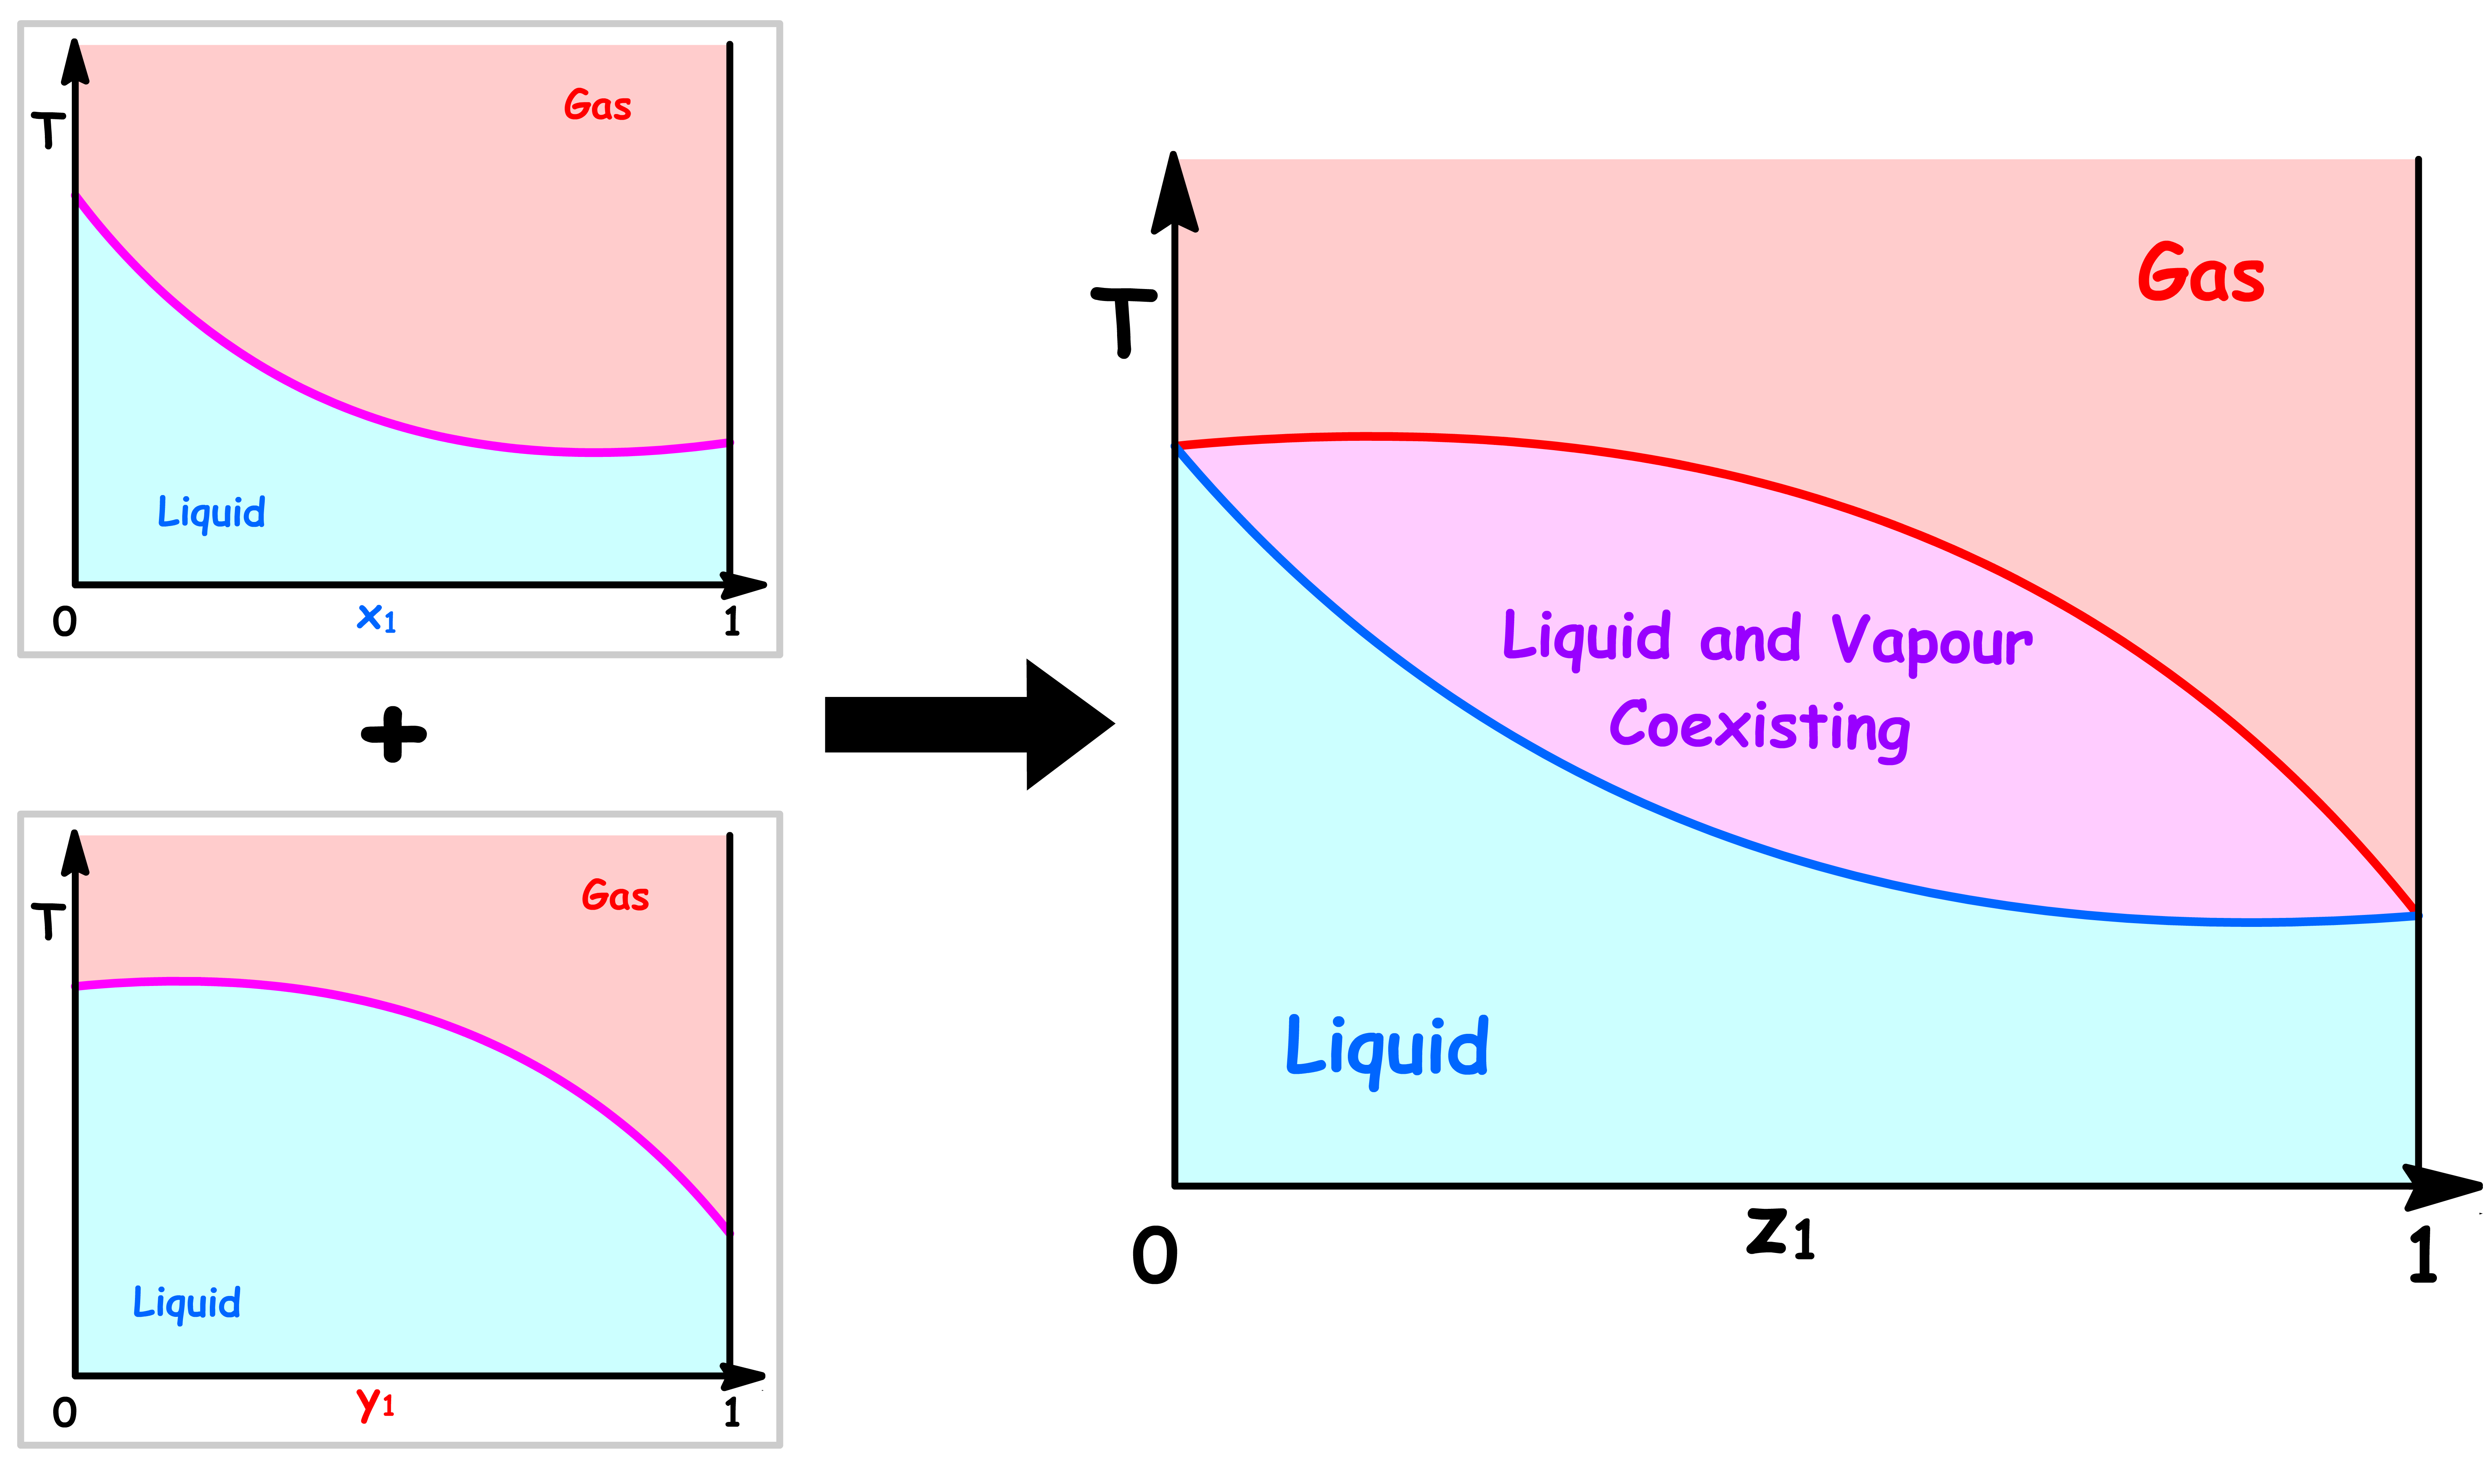
Temperature vs Overall Mole Fraction ( z1 )
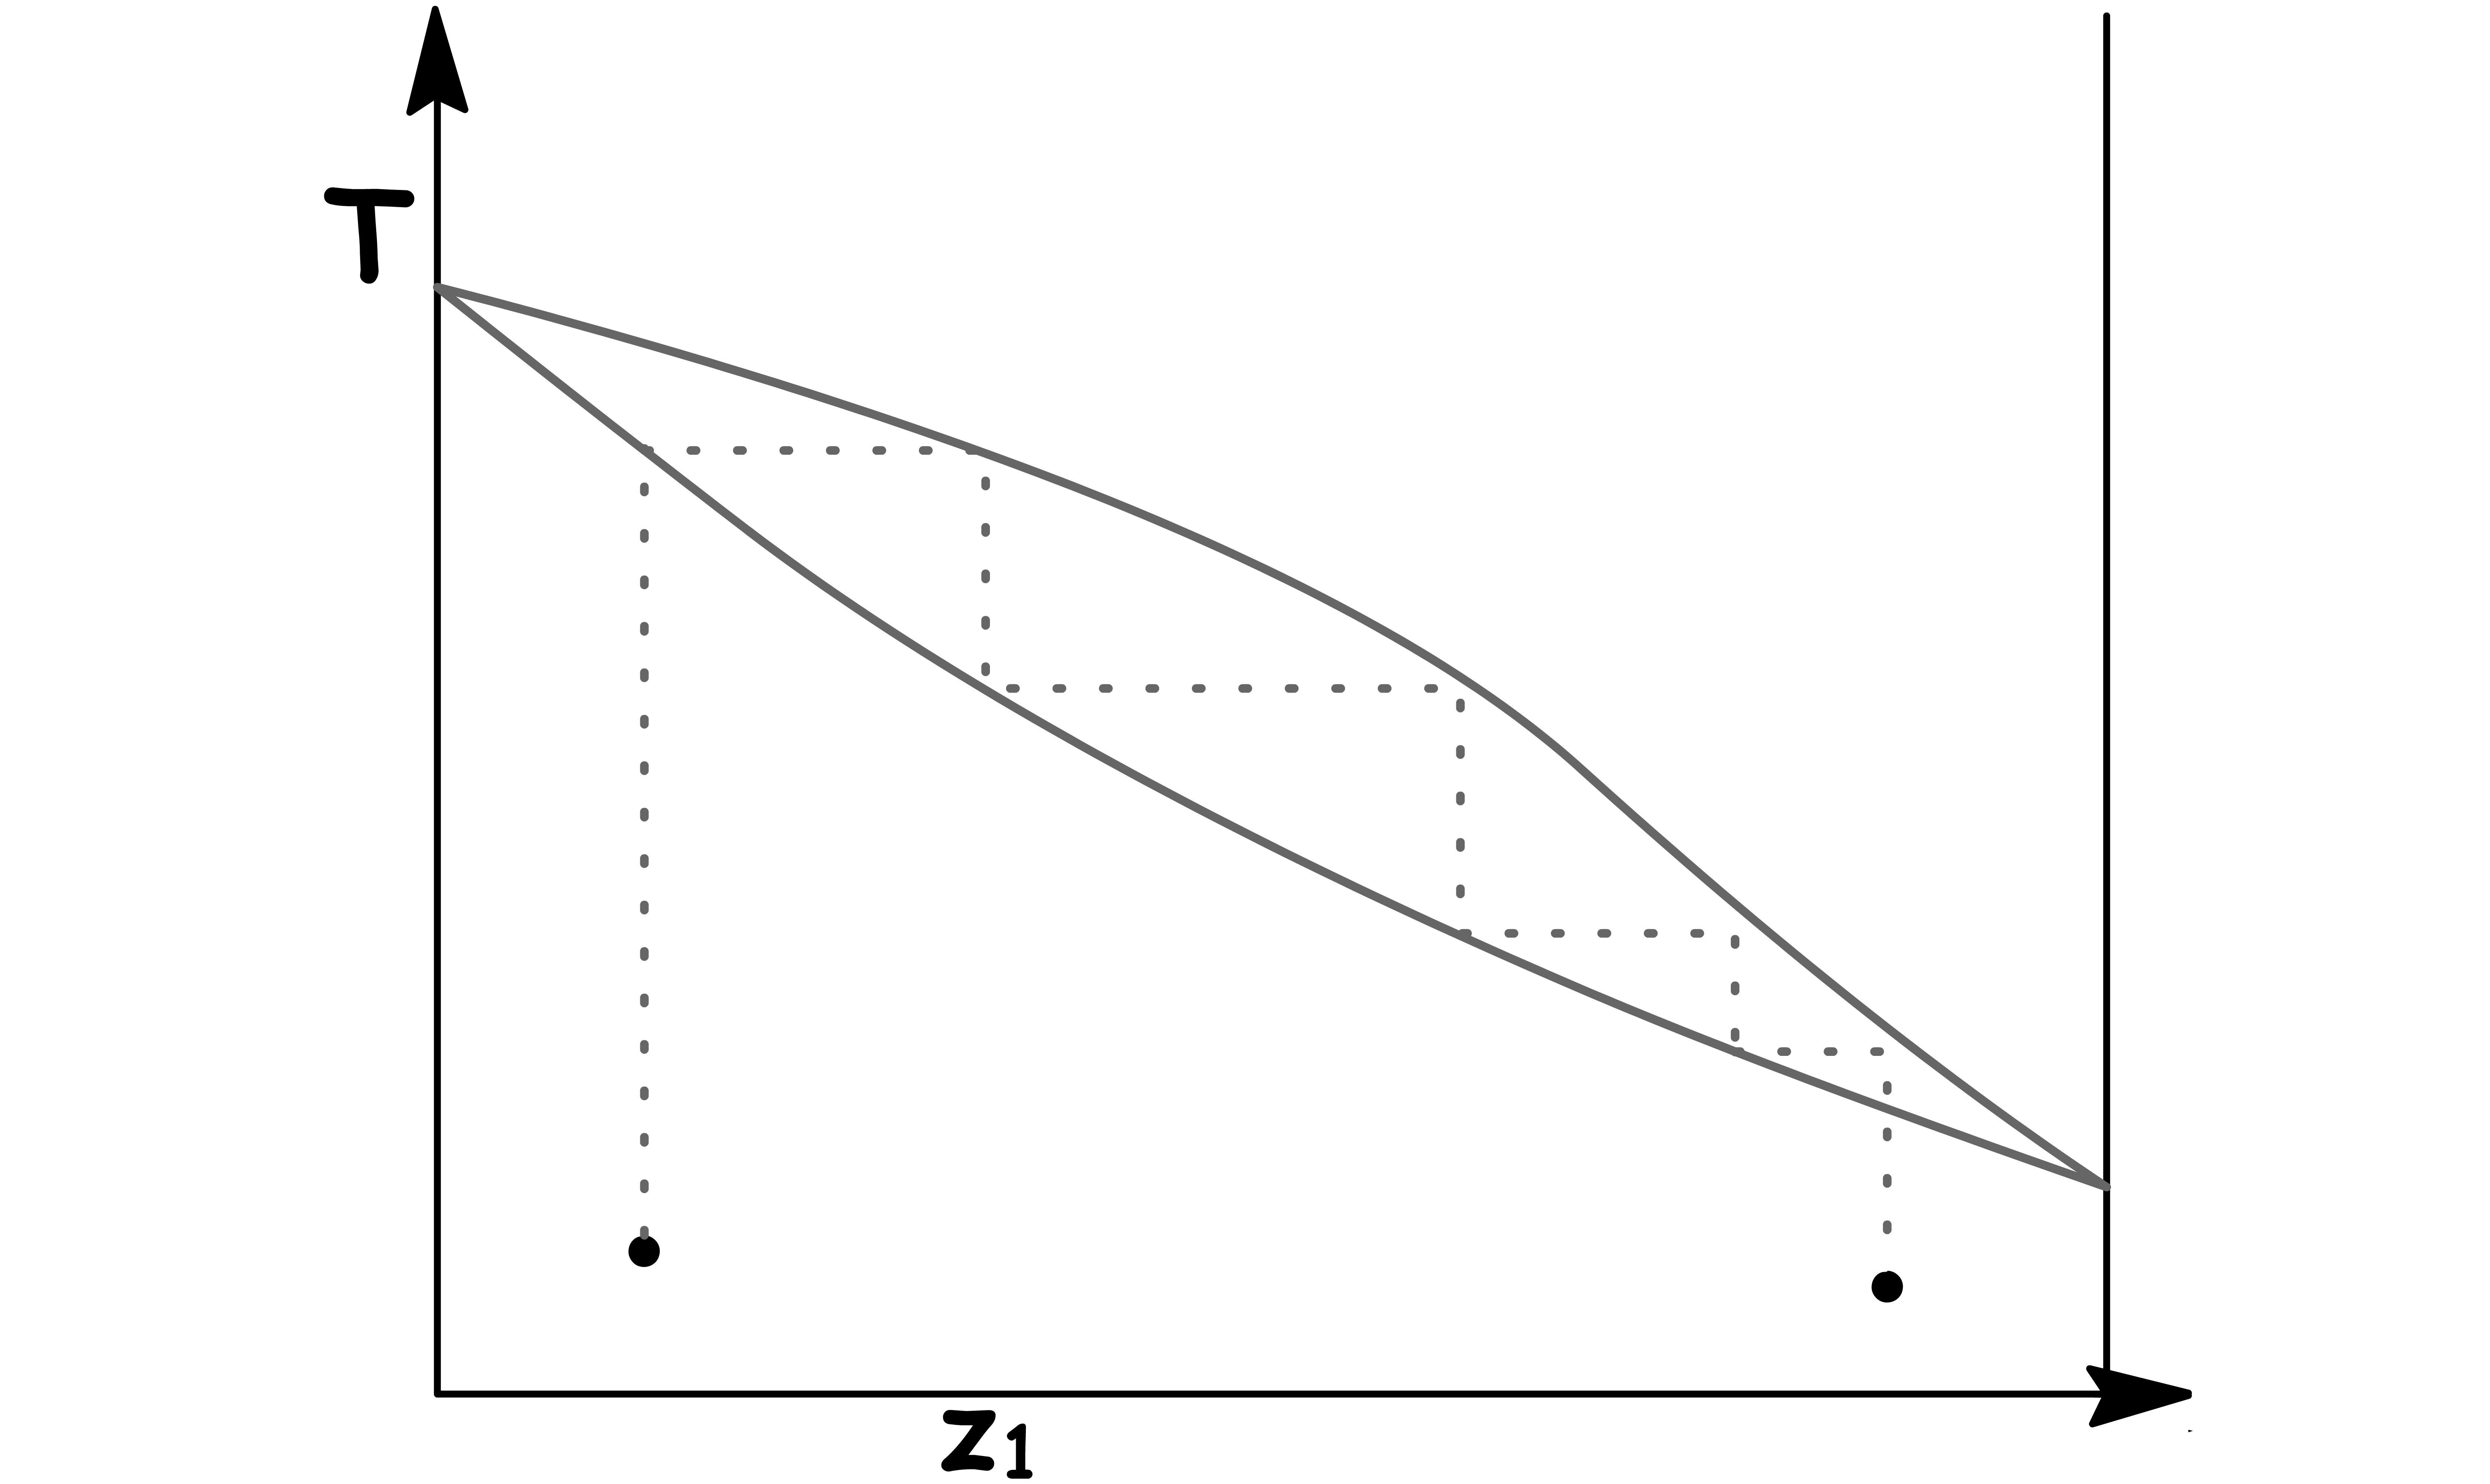
- Just like before, we can combine the two simple phase diagrams to obtained a more fruitful phase diagram
- This phase diagram can also be understood in the same way as the Pressure-Composition Phase Diagram
¶ The Distillation of Mixtures
The principle of dstillation can be illustrated using temperature-composition phase diagrams
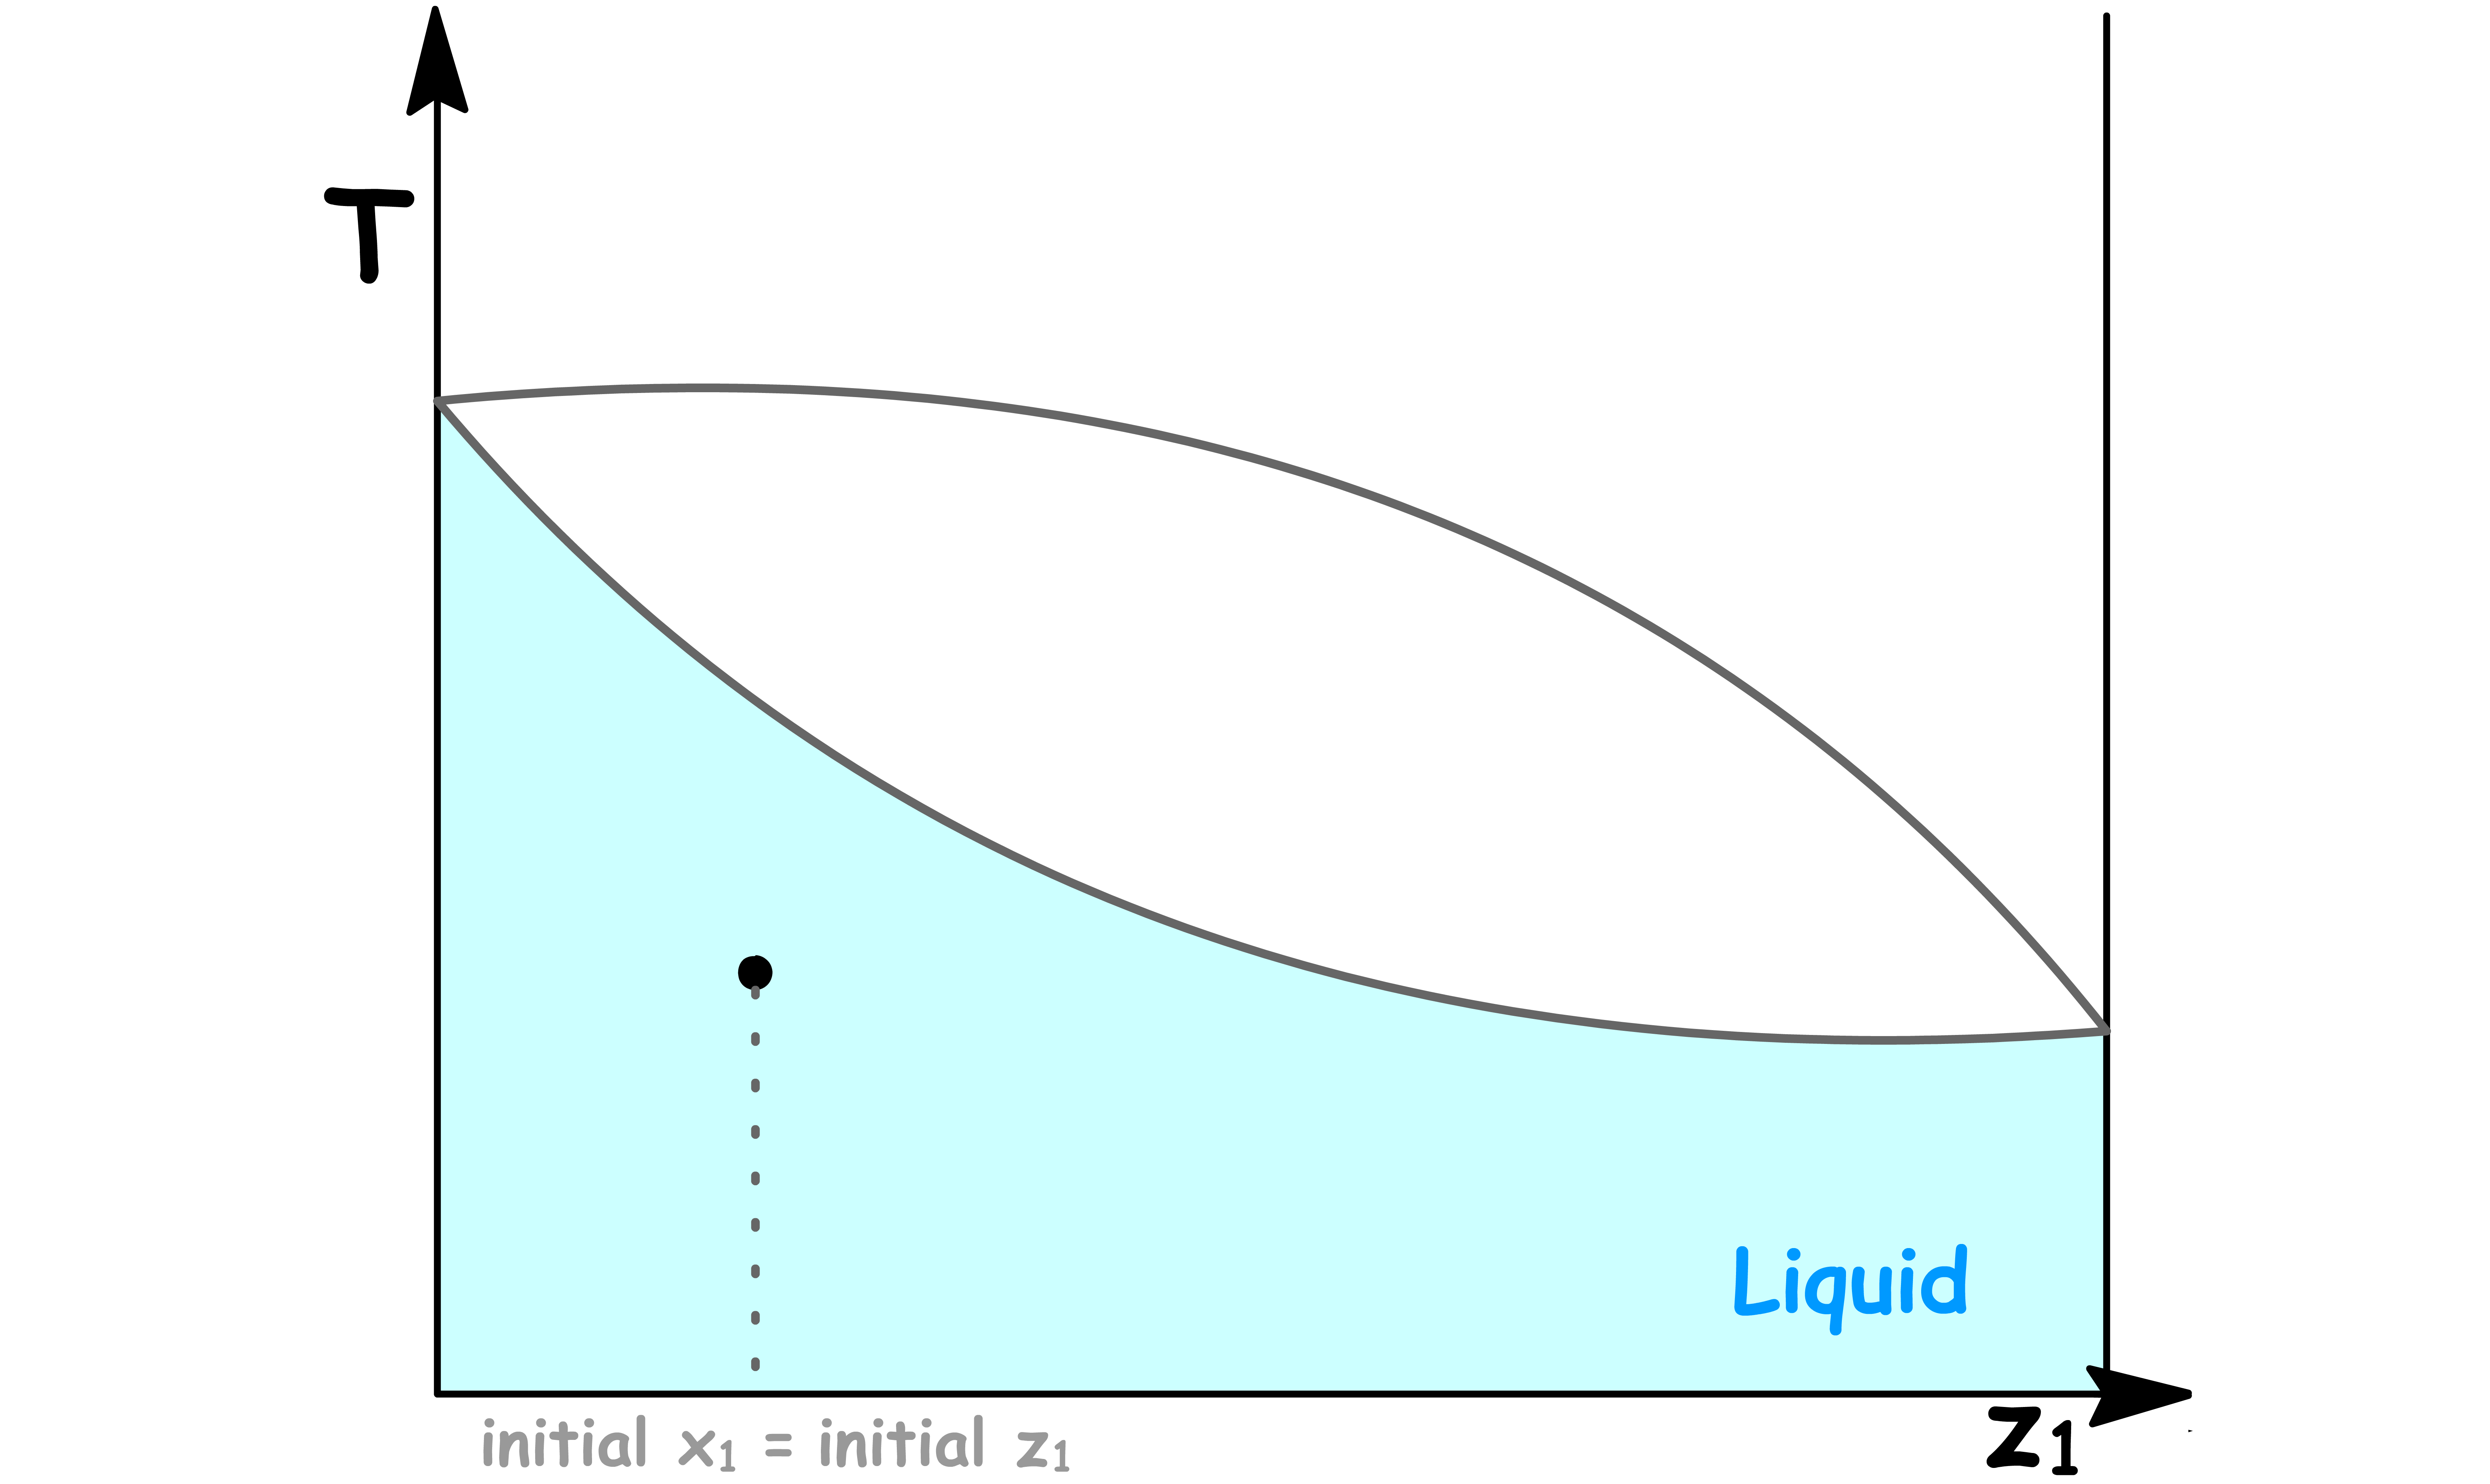
Initially, we have a solution sitting below its boiling point
- Since we are below the boiling point, there is only the liquid phase and so the mole fraction in solution is the same as the overall mole fraction
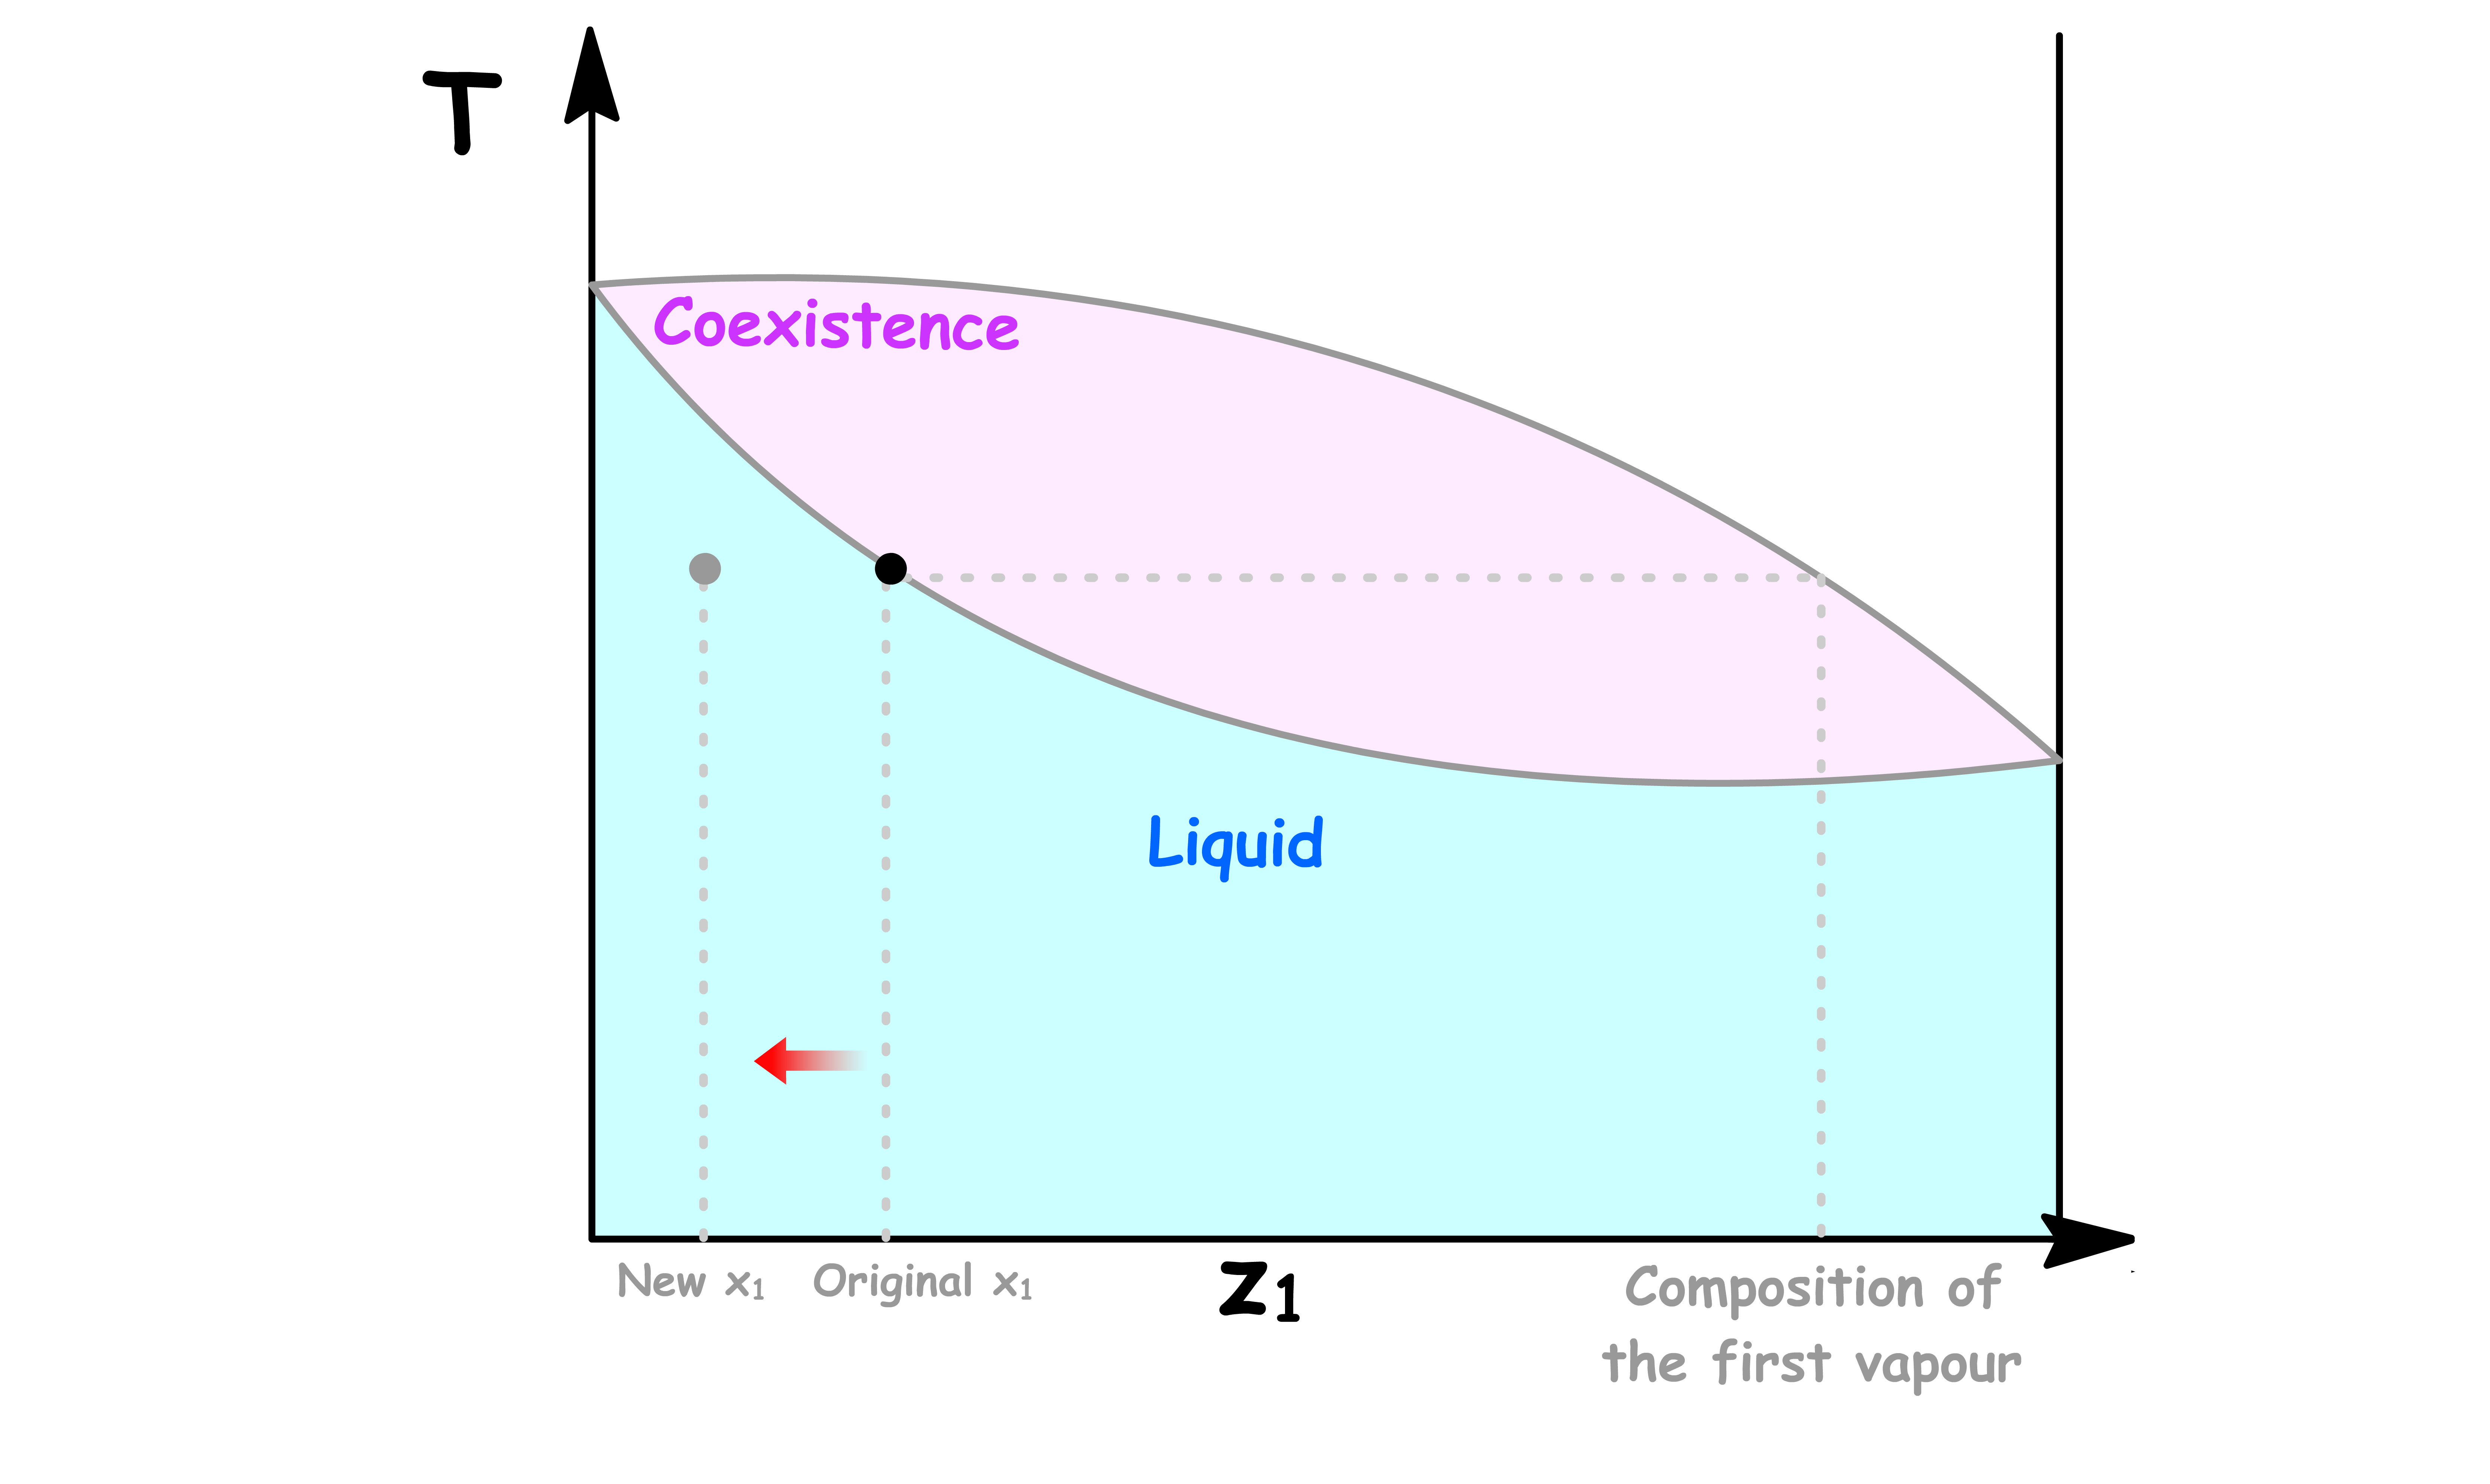
We then raise the temperature of the system to the boiling point of the solution and a small amount of liquid is vaporized
- The first vapour that comes off is richer in component 1
- Hence, the solution will has a lower mole fraction in component 1 and will therefore shift to the left
- As a result, we need to further raise the temperature of the system to keep the liquid boiling
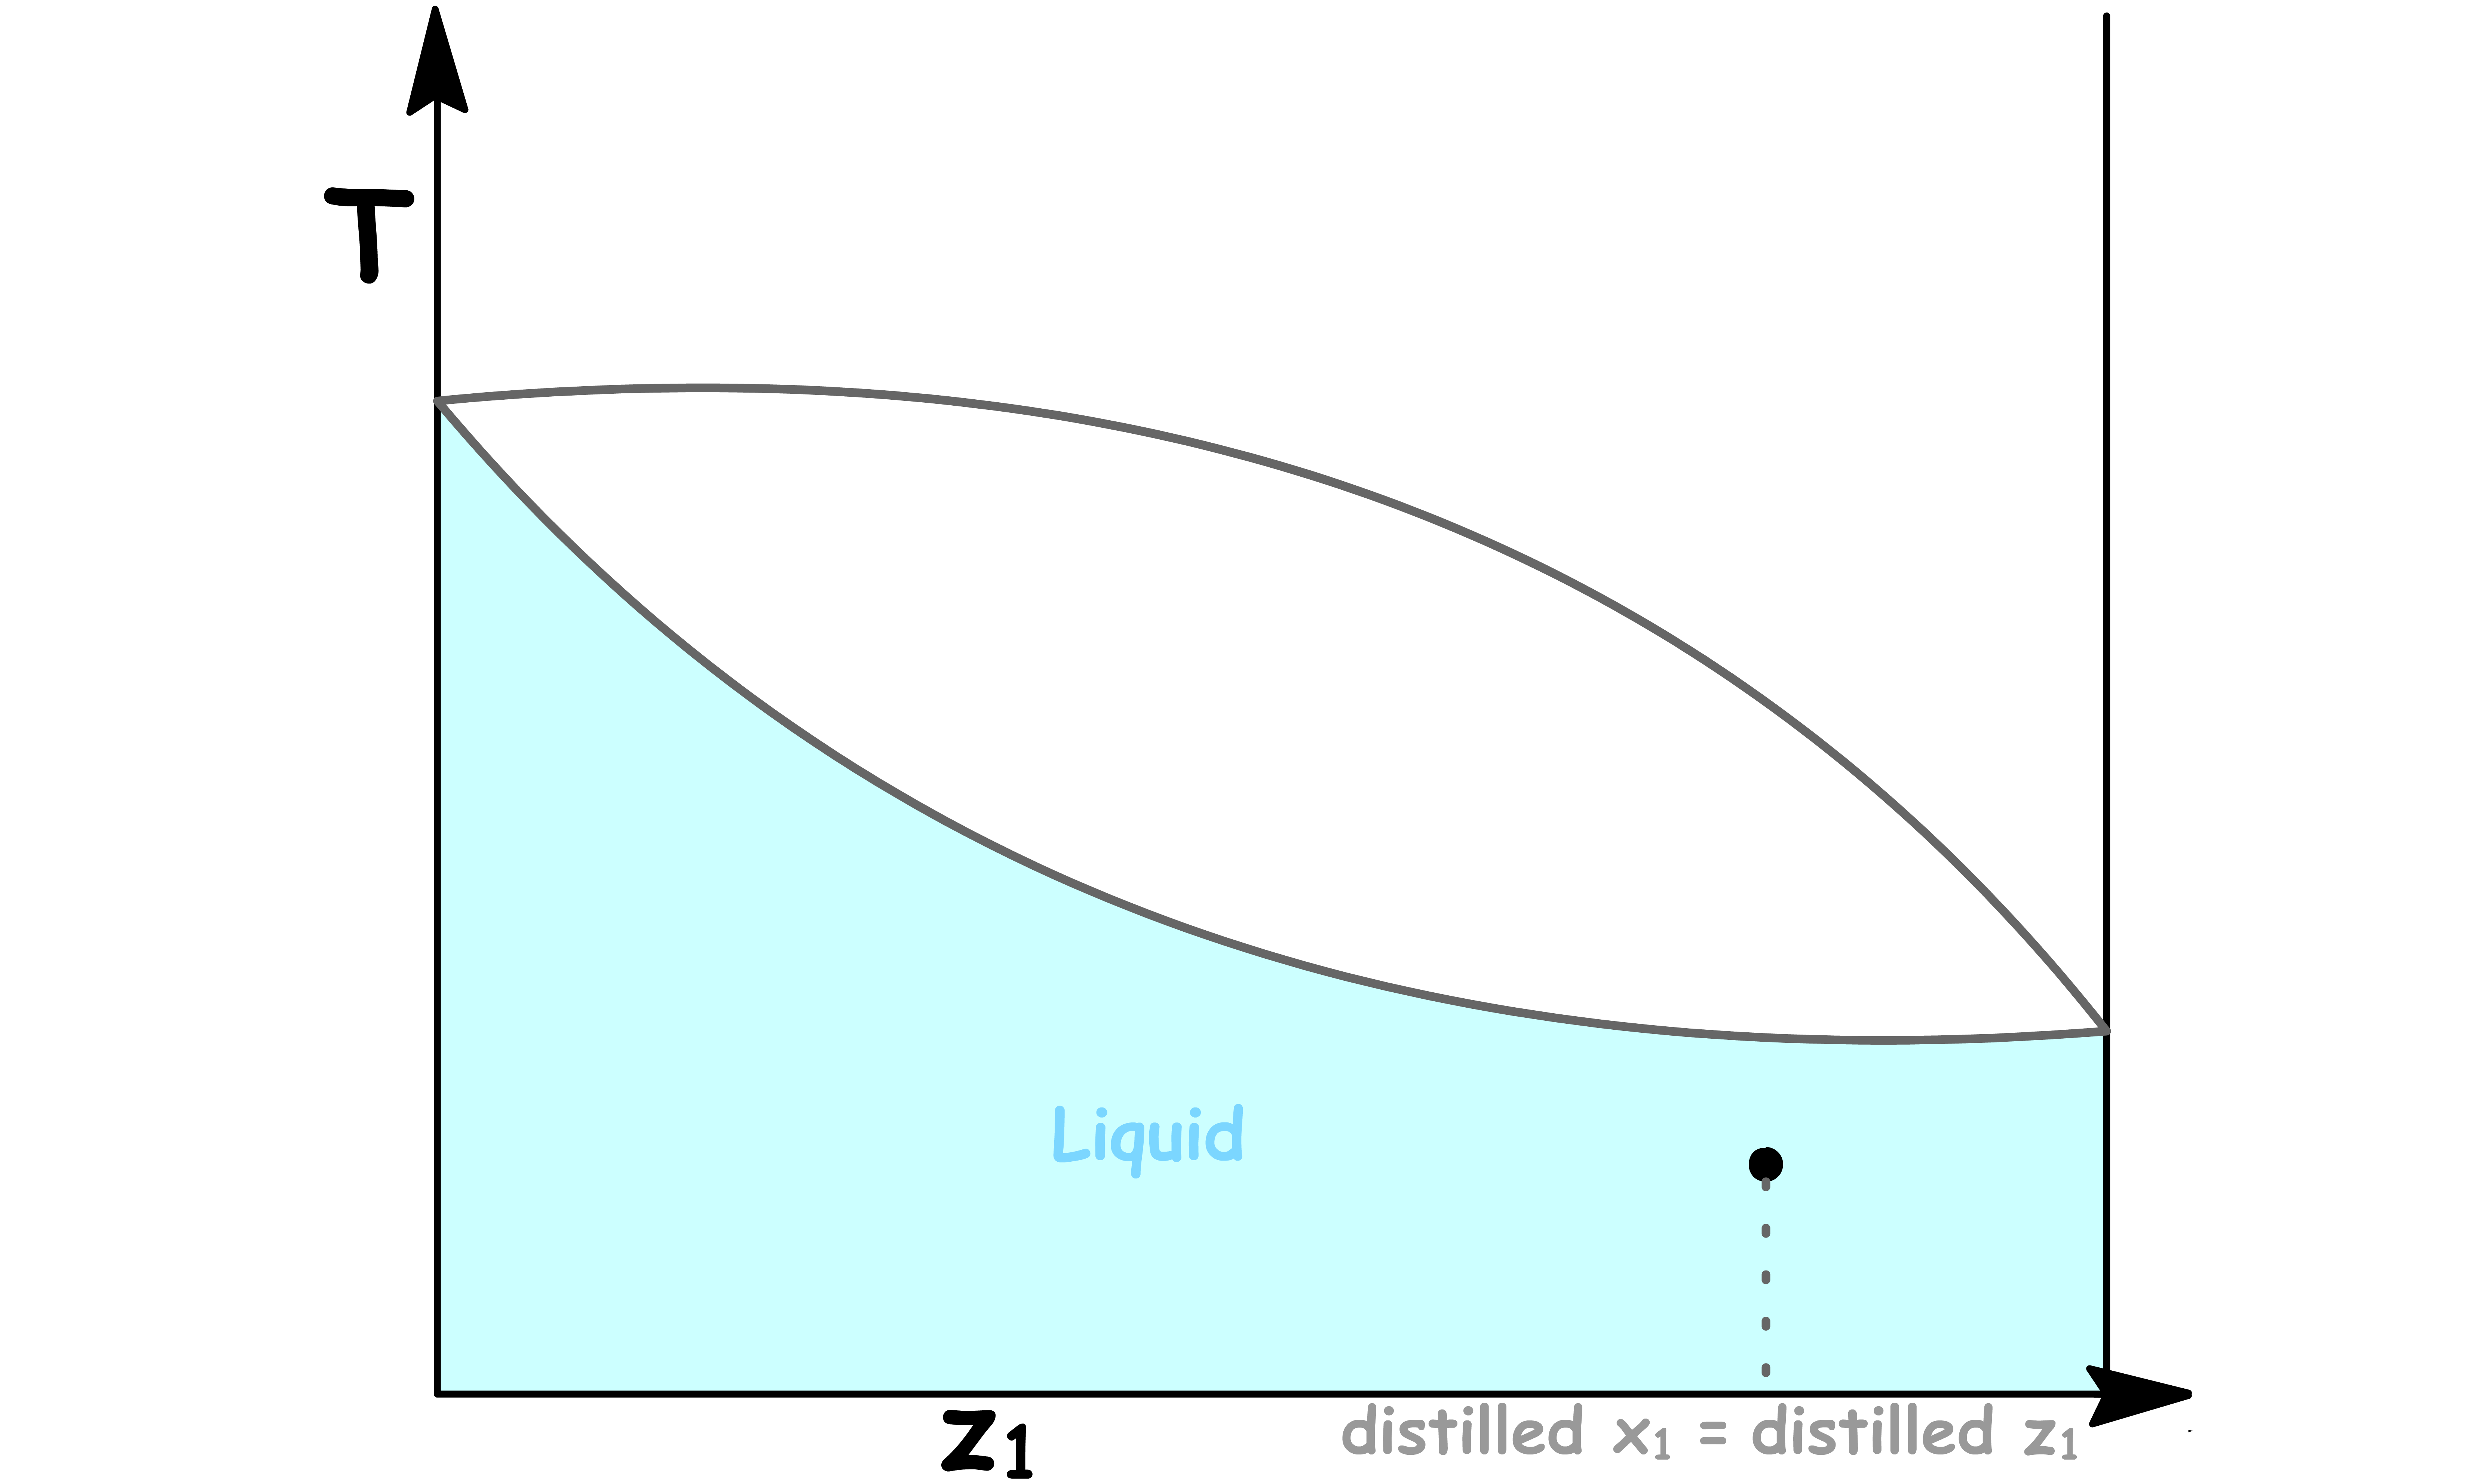
We collect the first vapour and cool it down
- If this first vapour is cooled, it condenses into a liquid with the same composition
- The distilled liquid has a higher mole fraction of component 1 than the original solution
¶ Fractional Distillation
We can further purify the liquid by successively condensing and revaporizing the mixture
- By packing the distillation column, we in effect get many succesive condensation and revaporizations
We get maximum enrichment of component 1 by taking just the first bit of vapour that comes off
- The maximum degree of enrichment for any one distillation step is said to represent one theoretical plate
- The efficiency of a fractionating column can be expressed in terms of the number of theoretical plates
- The number of theoratical plates is the number of effictive vaporization and condensation steps that are required to achieve a condensate of a given composition from a given distillate
¶ Lever Rule
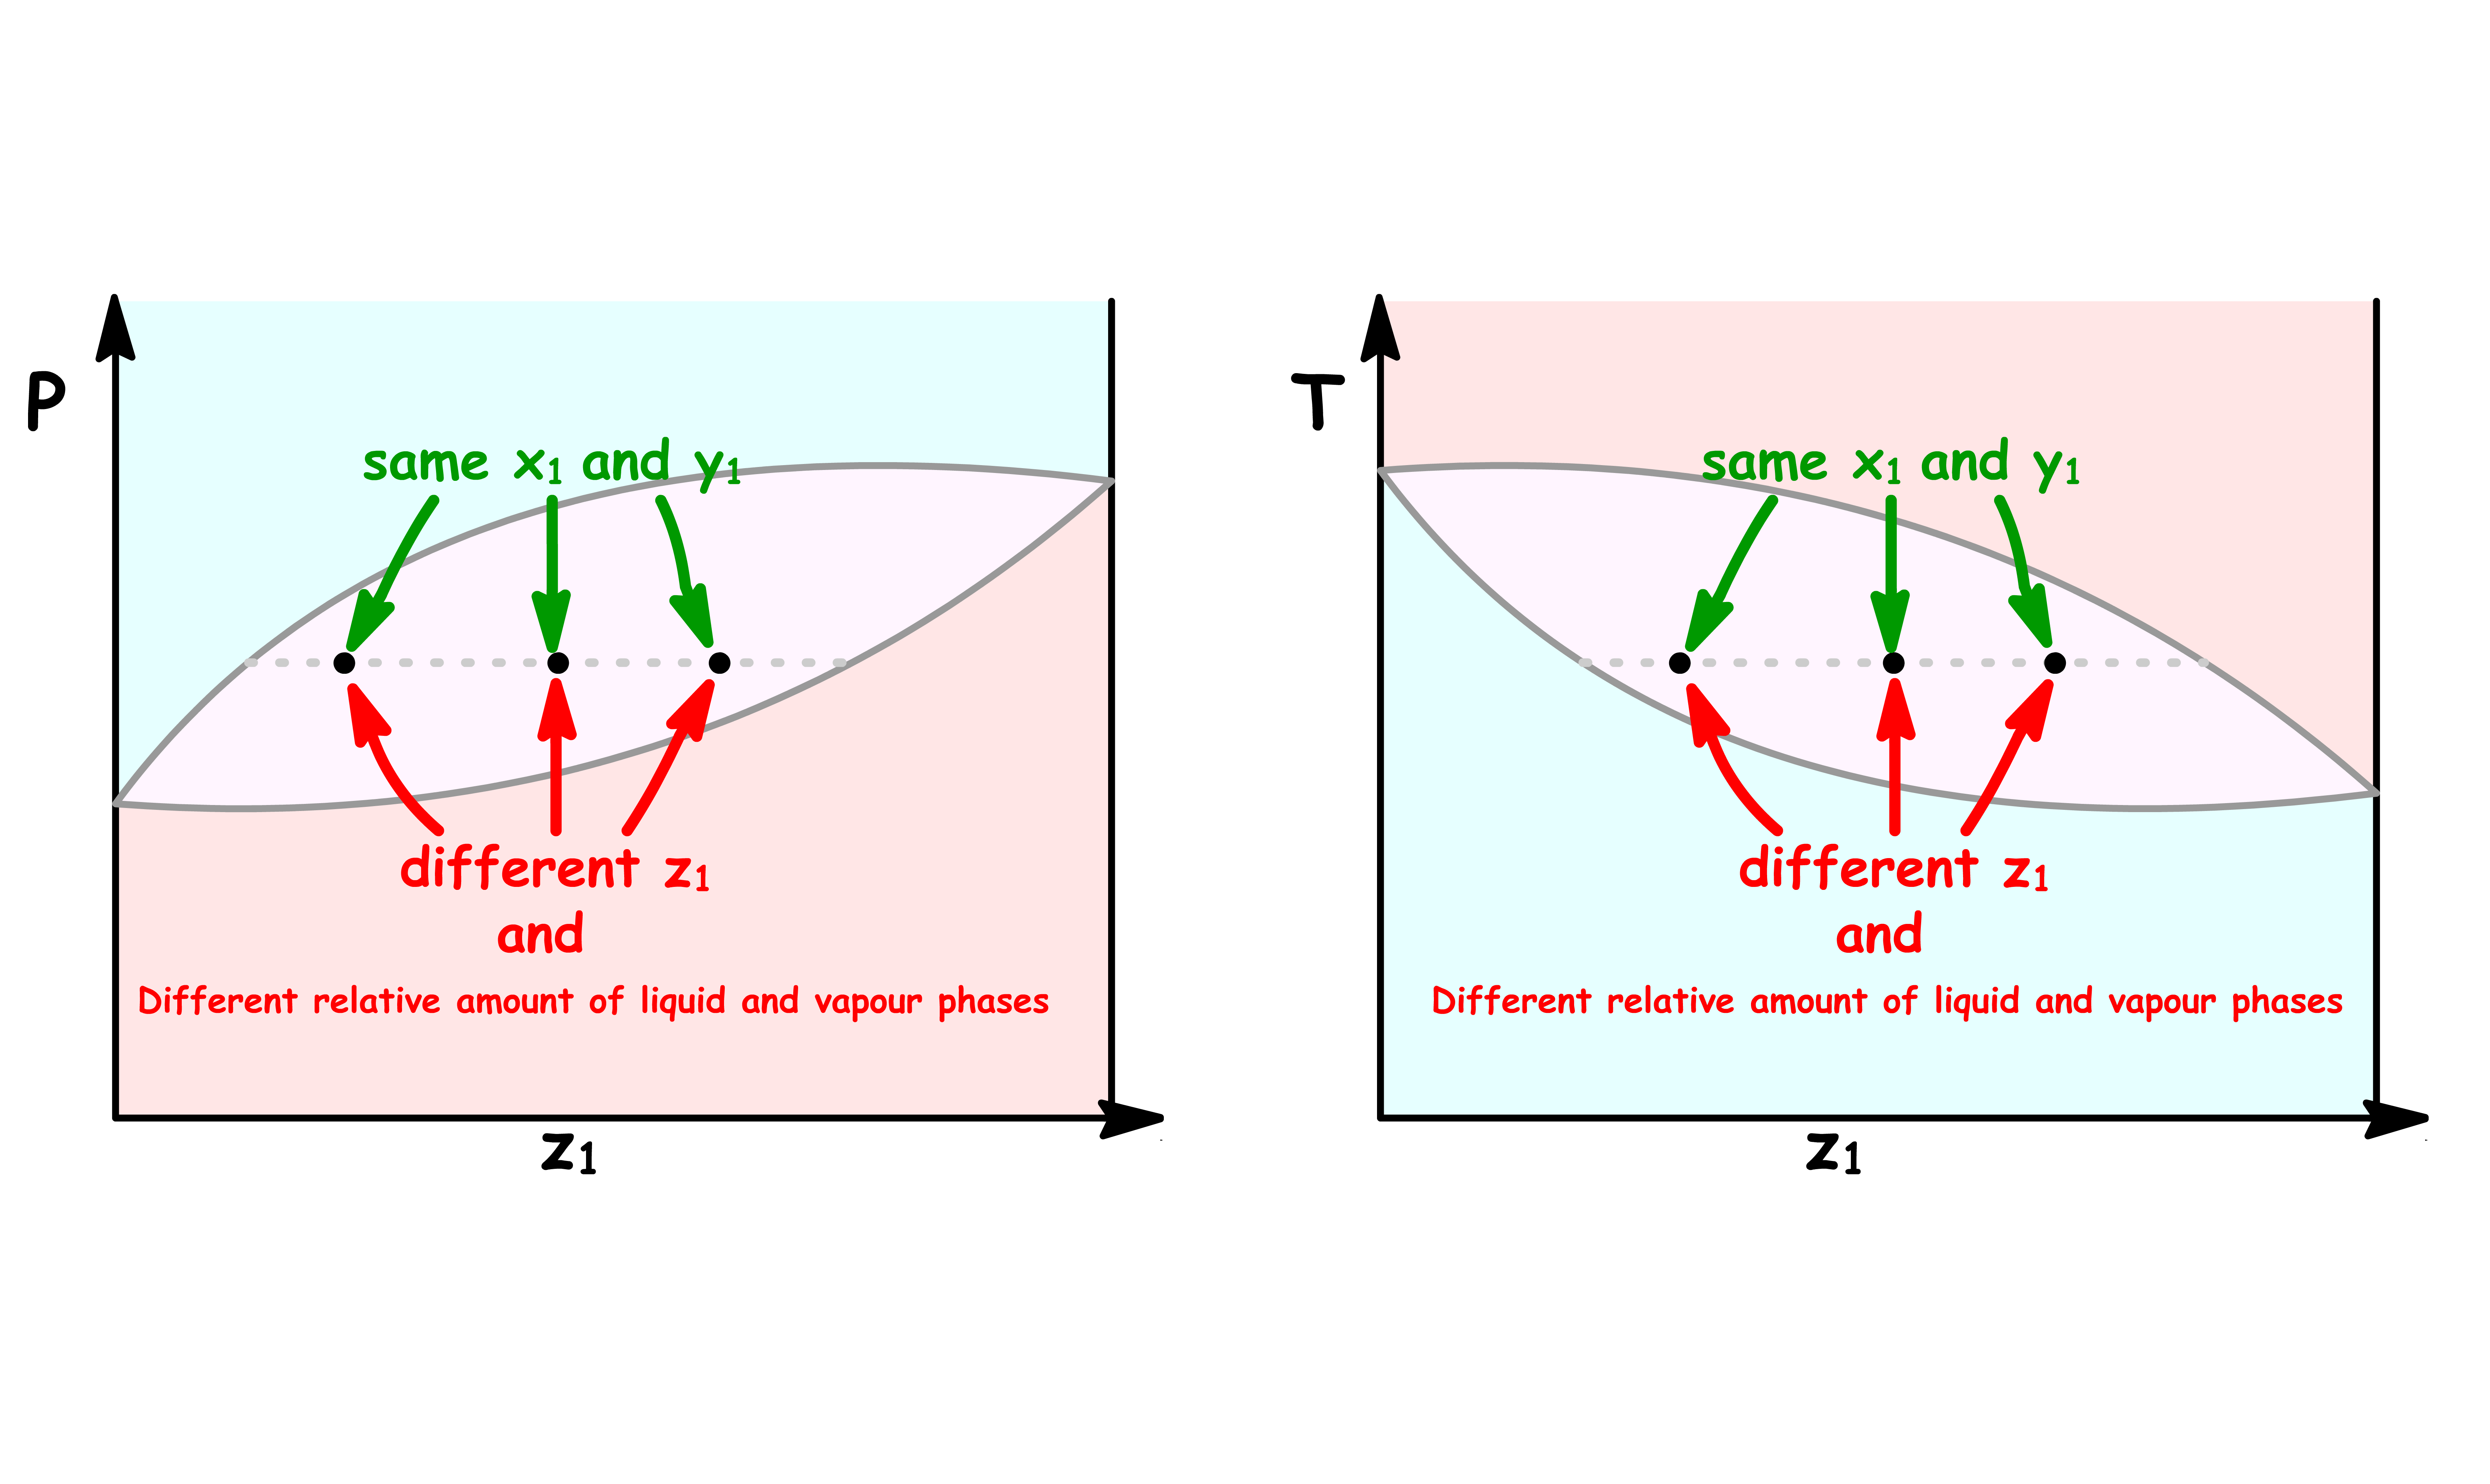
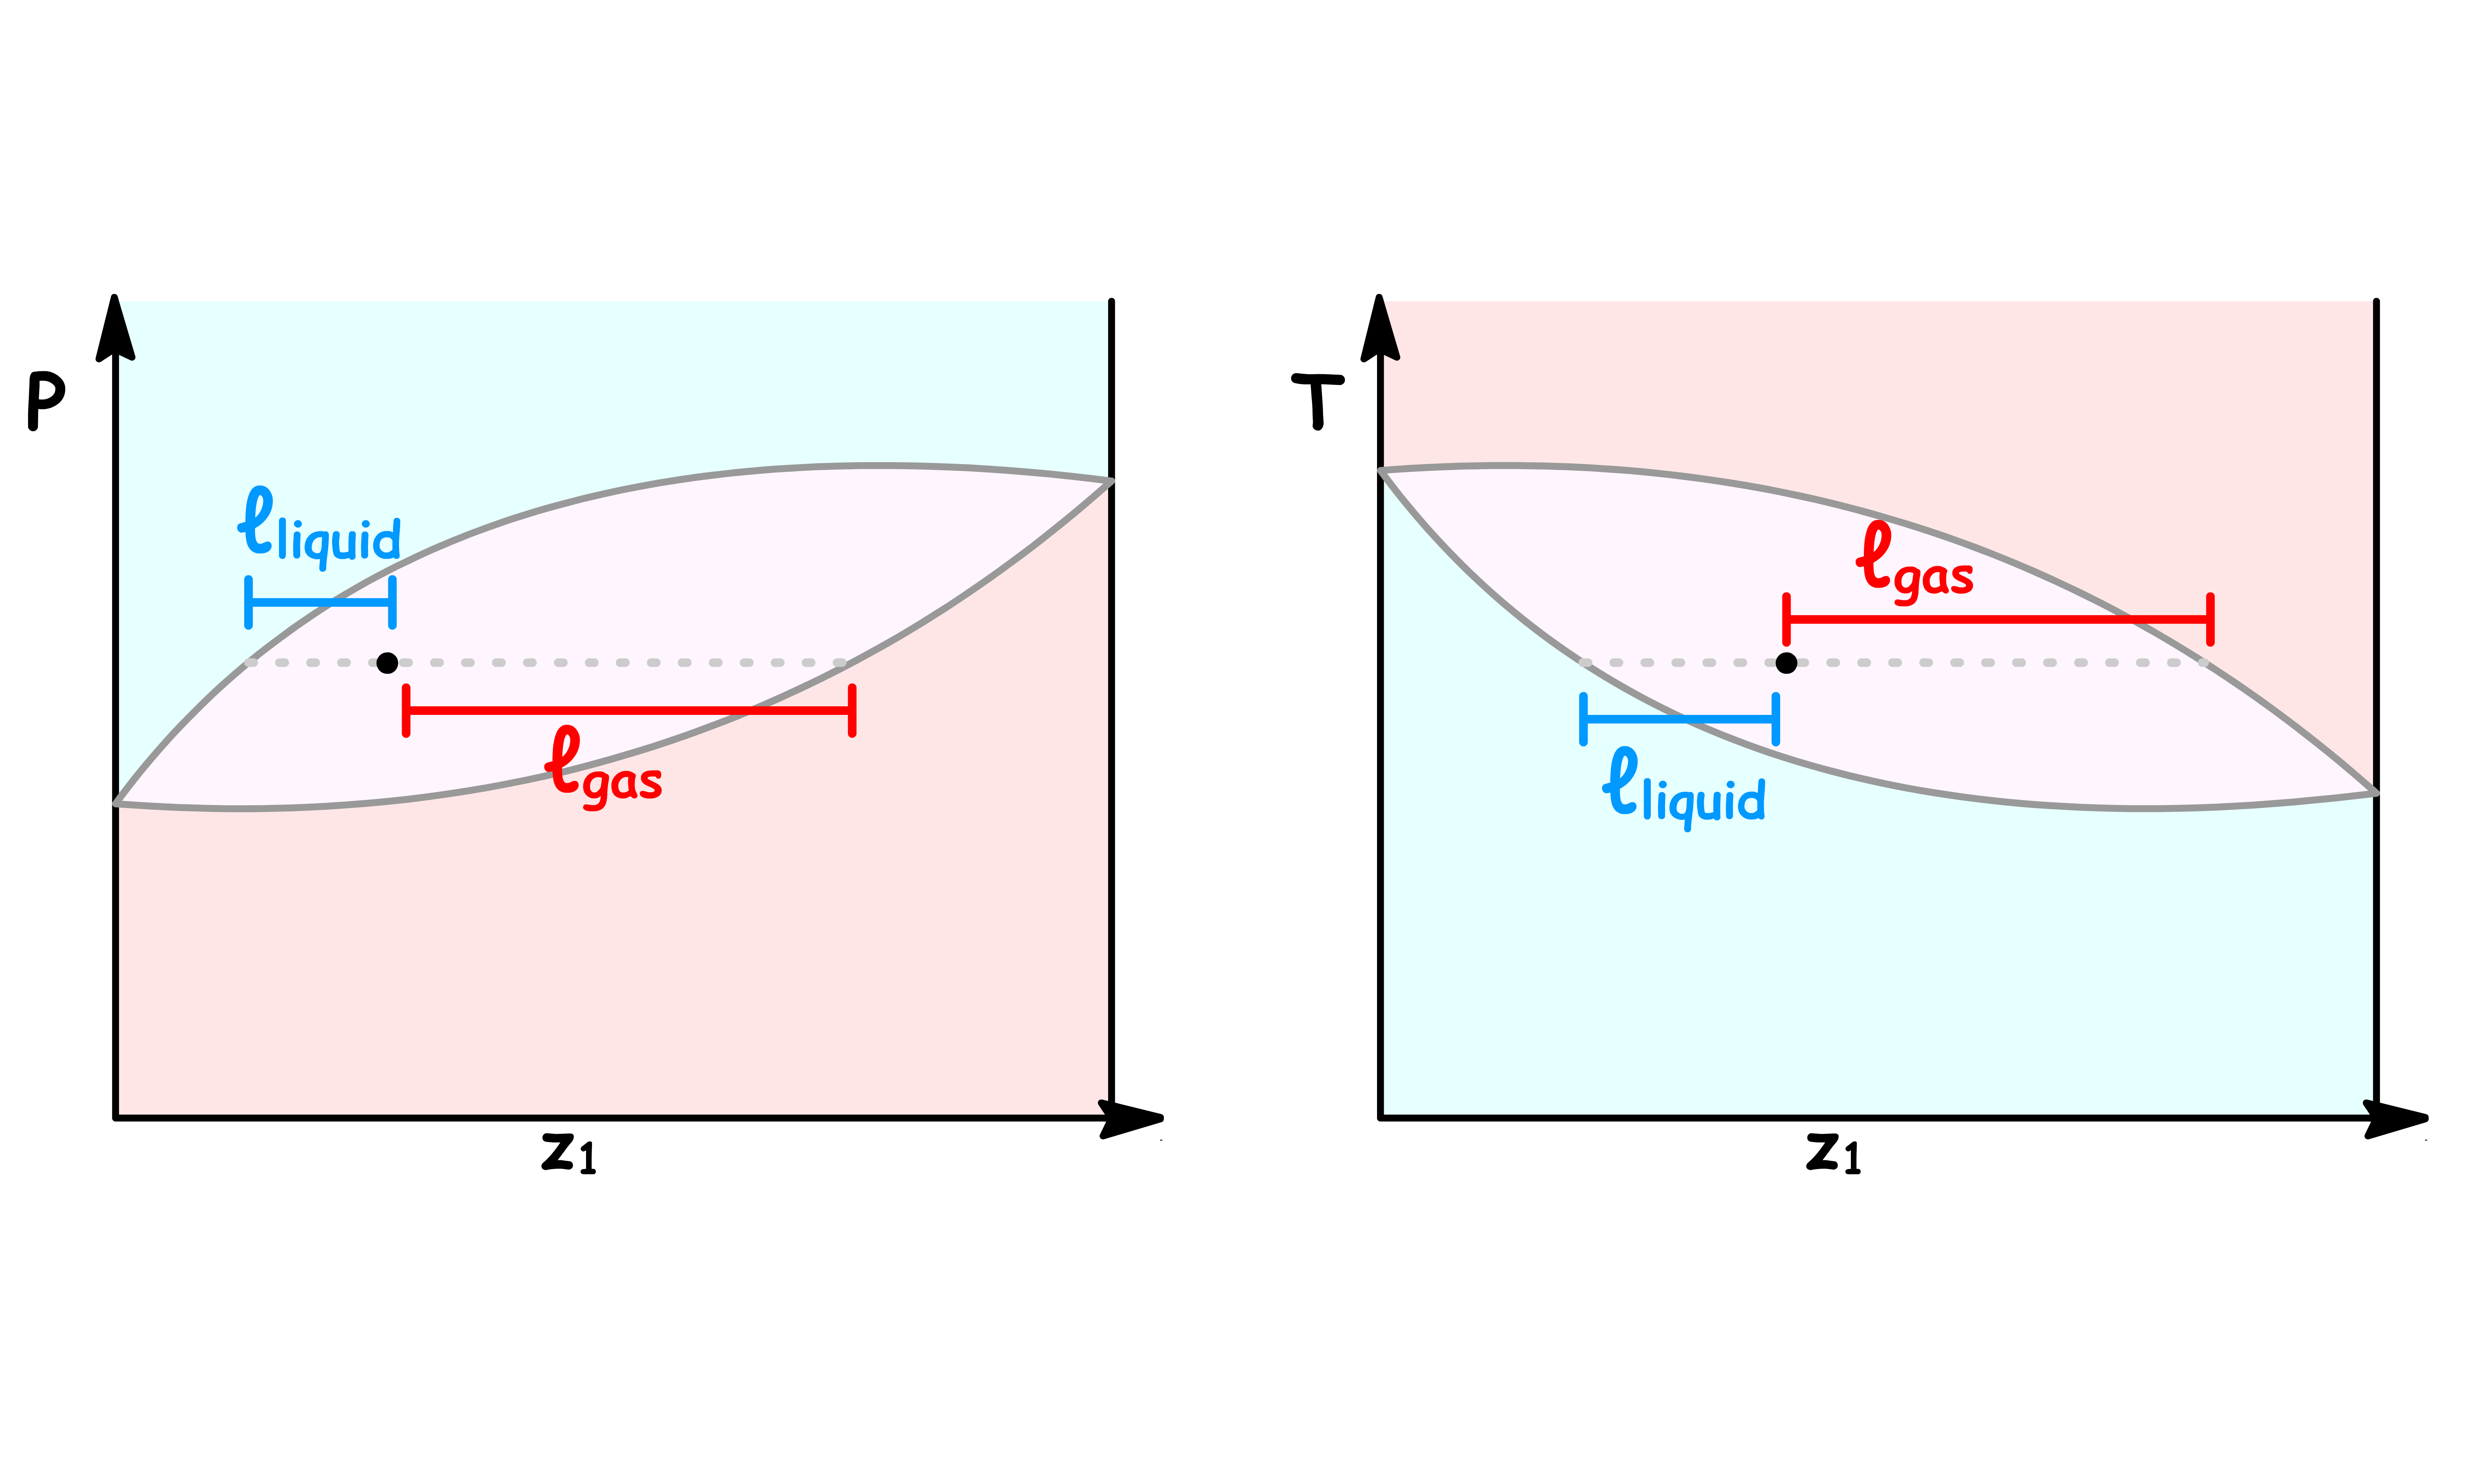
Different relative amount of liquid and vapour phases correspond to different points along a tie line
- A point in the coexistence region of a phase diagram not only tells us what the mole fraction of a component in each phase, it also allows us to quantitatively the ratio of liquid and vapour present
We can determine the ratio of the total mole number of each phase using the lever rule
- The lever rule states that the ratio of the total mole number of each phase is the reciprocal of the ratio of length on the tie line
¶ Composition Phase Diagram for Non-Ideal Solutions
The phase diagrams above are constructed with the assumption that the solution is idea
- For most real solutions, the basic principles of those phase diagrams are still applicable
- Here, we shall examine some extreme cases
¶ Azeotrope
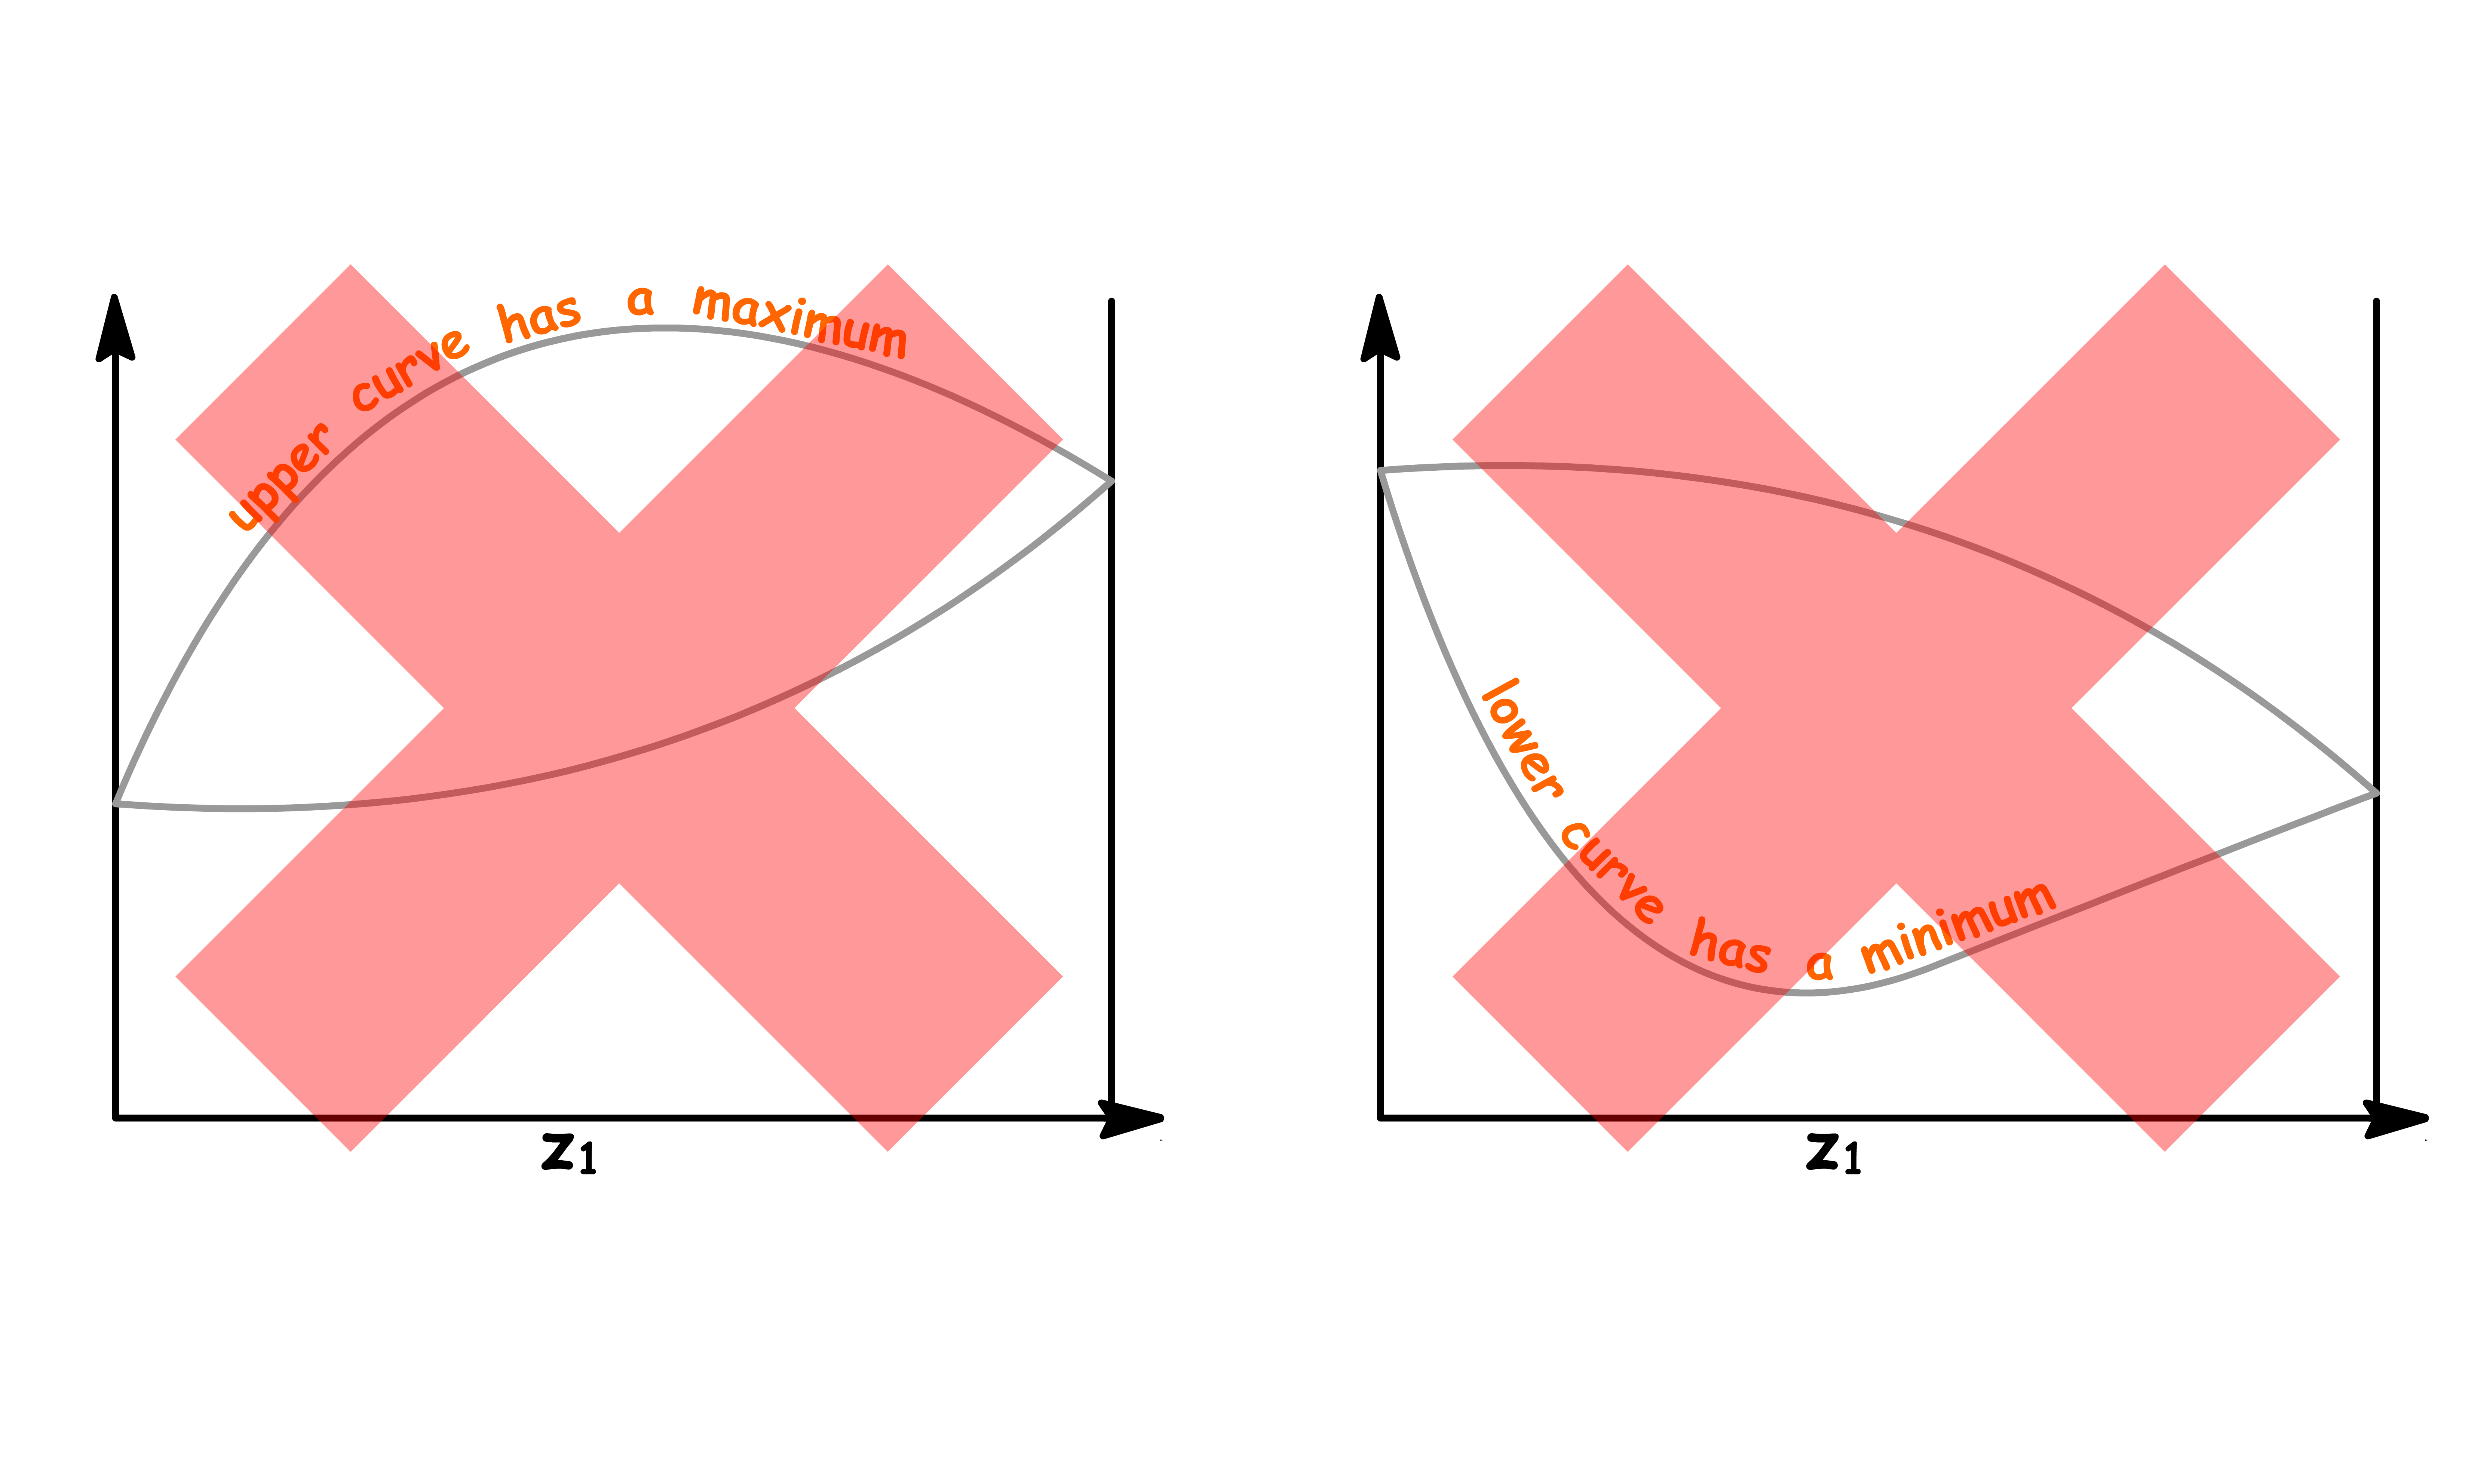
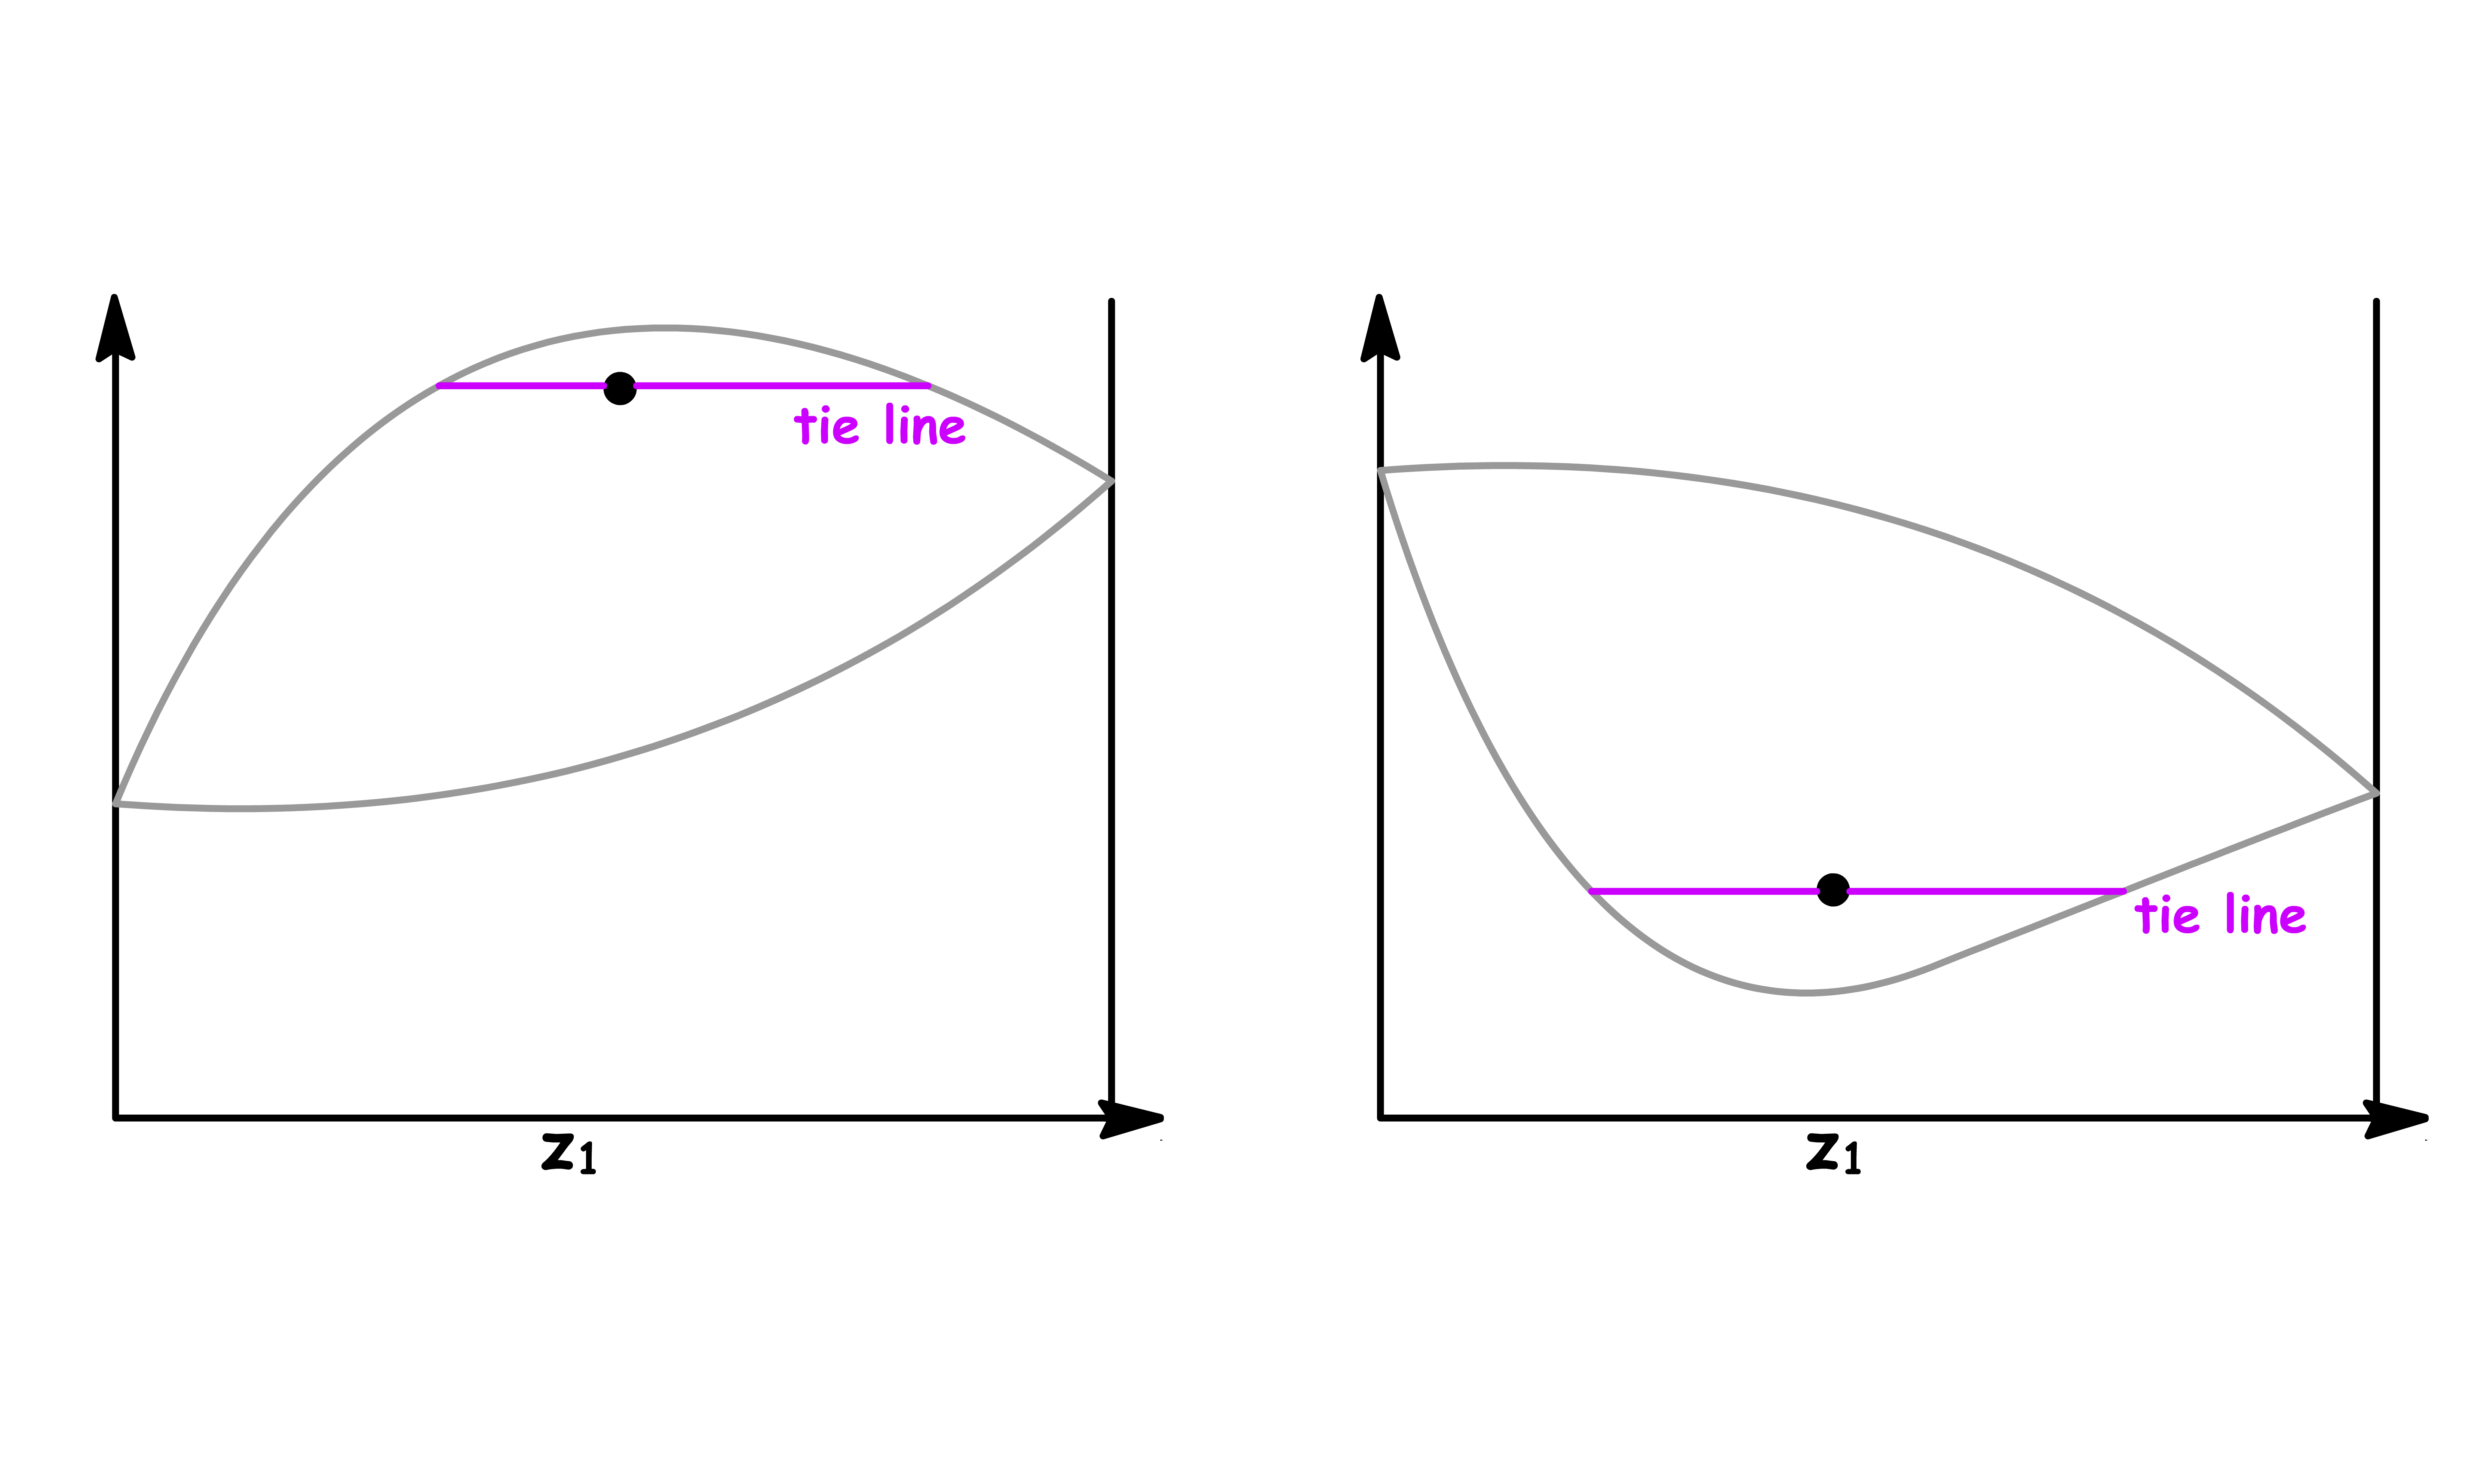
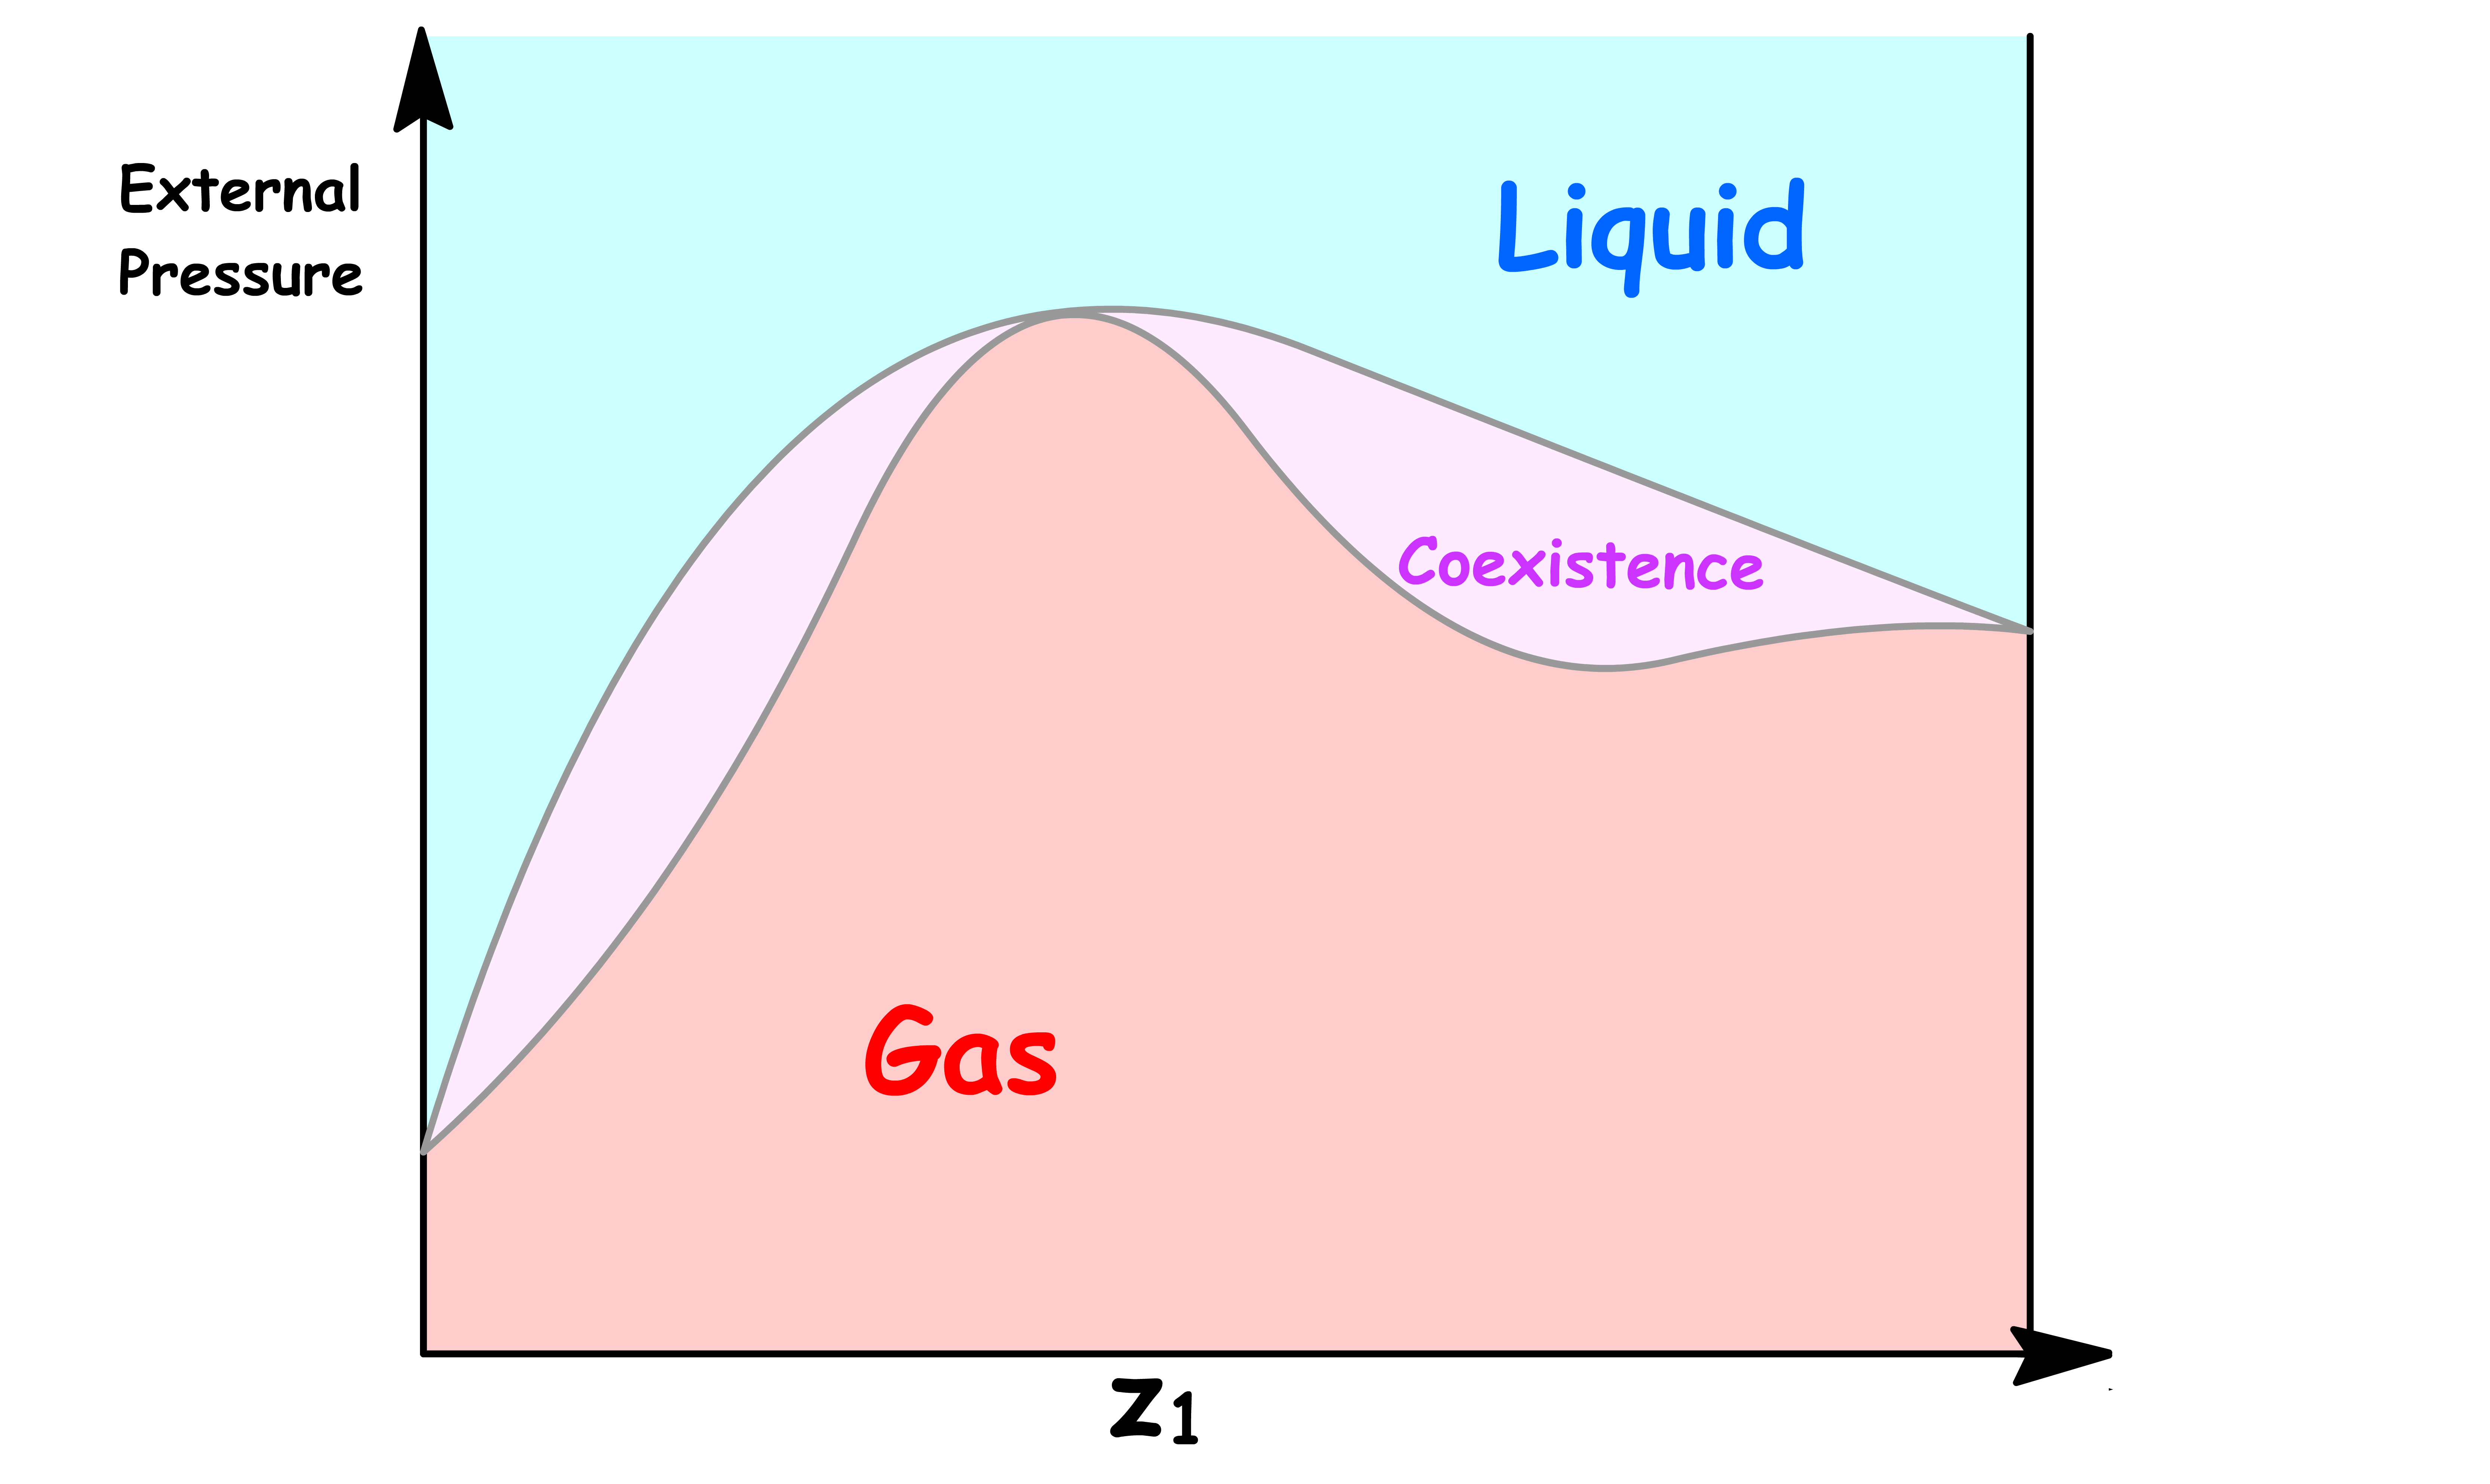
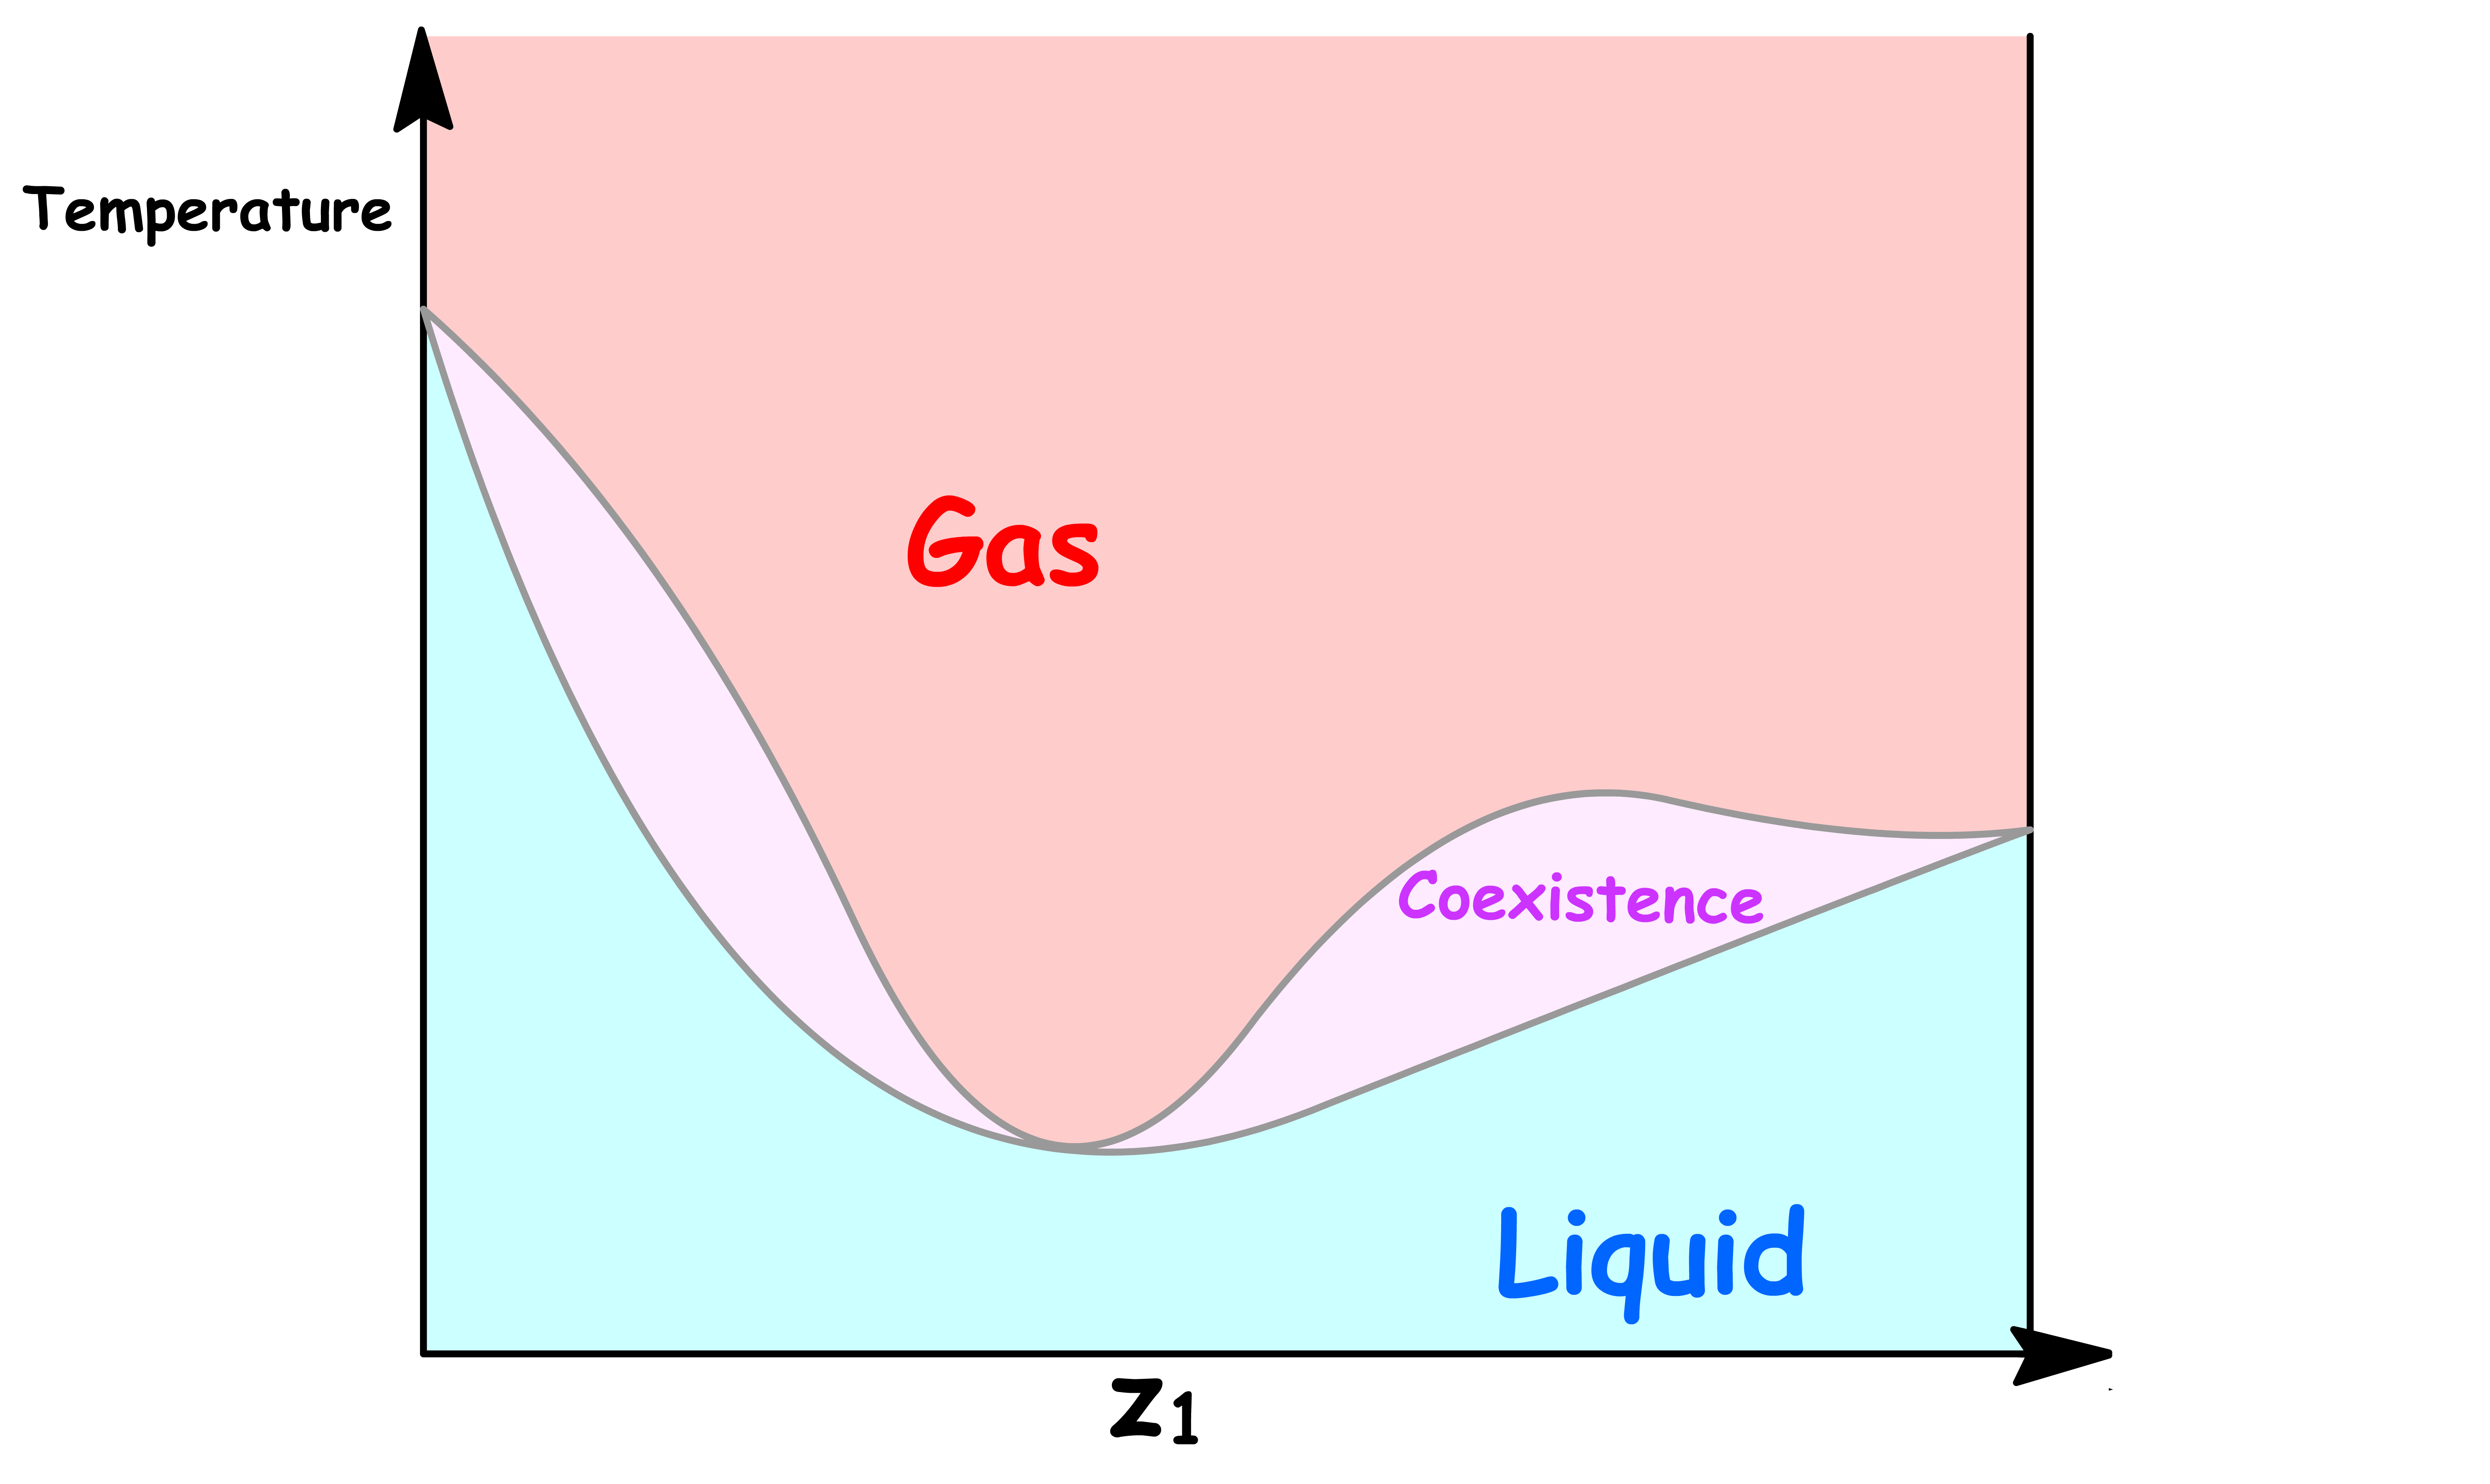
If the solution has a great enough deviation from ideality to give a maximum or minimum in the upper curve or lower curve respectively of the phase diagram, a new phenomenon appears
It is impossible for these kind of phase diagrams to look have the following shapes
- This is because there are regions where the both ends of the tie line are on the same curve, which means we cannot determine the mole fraction in both the liquid and the vapour phase
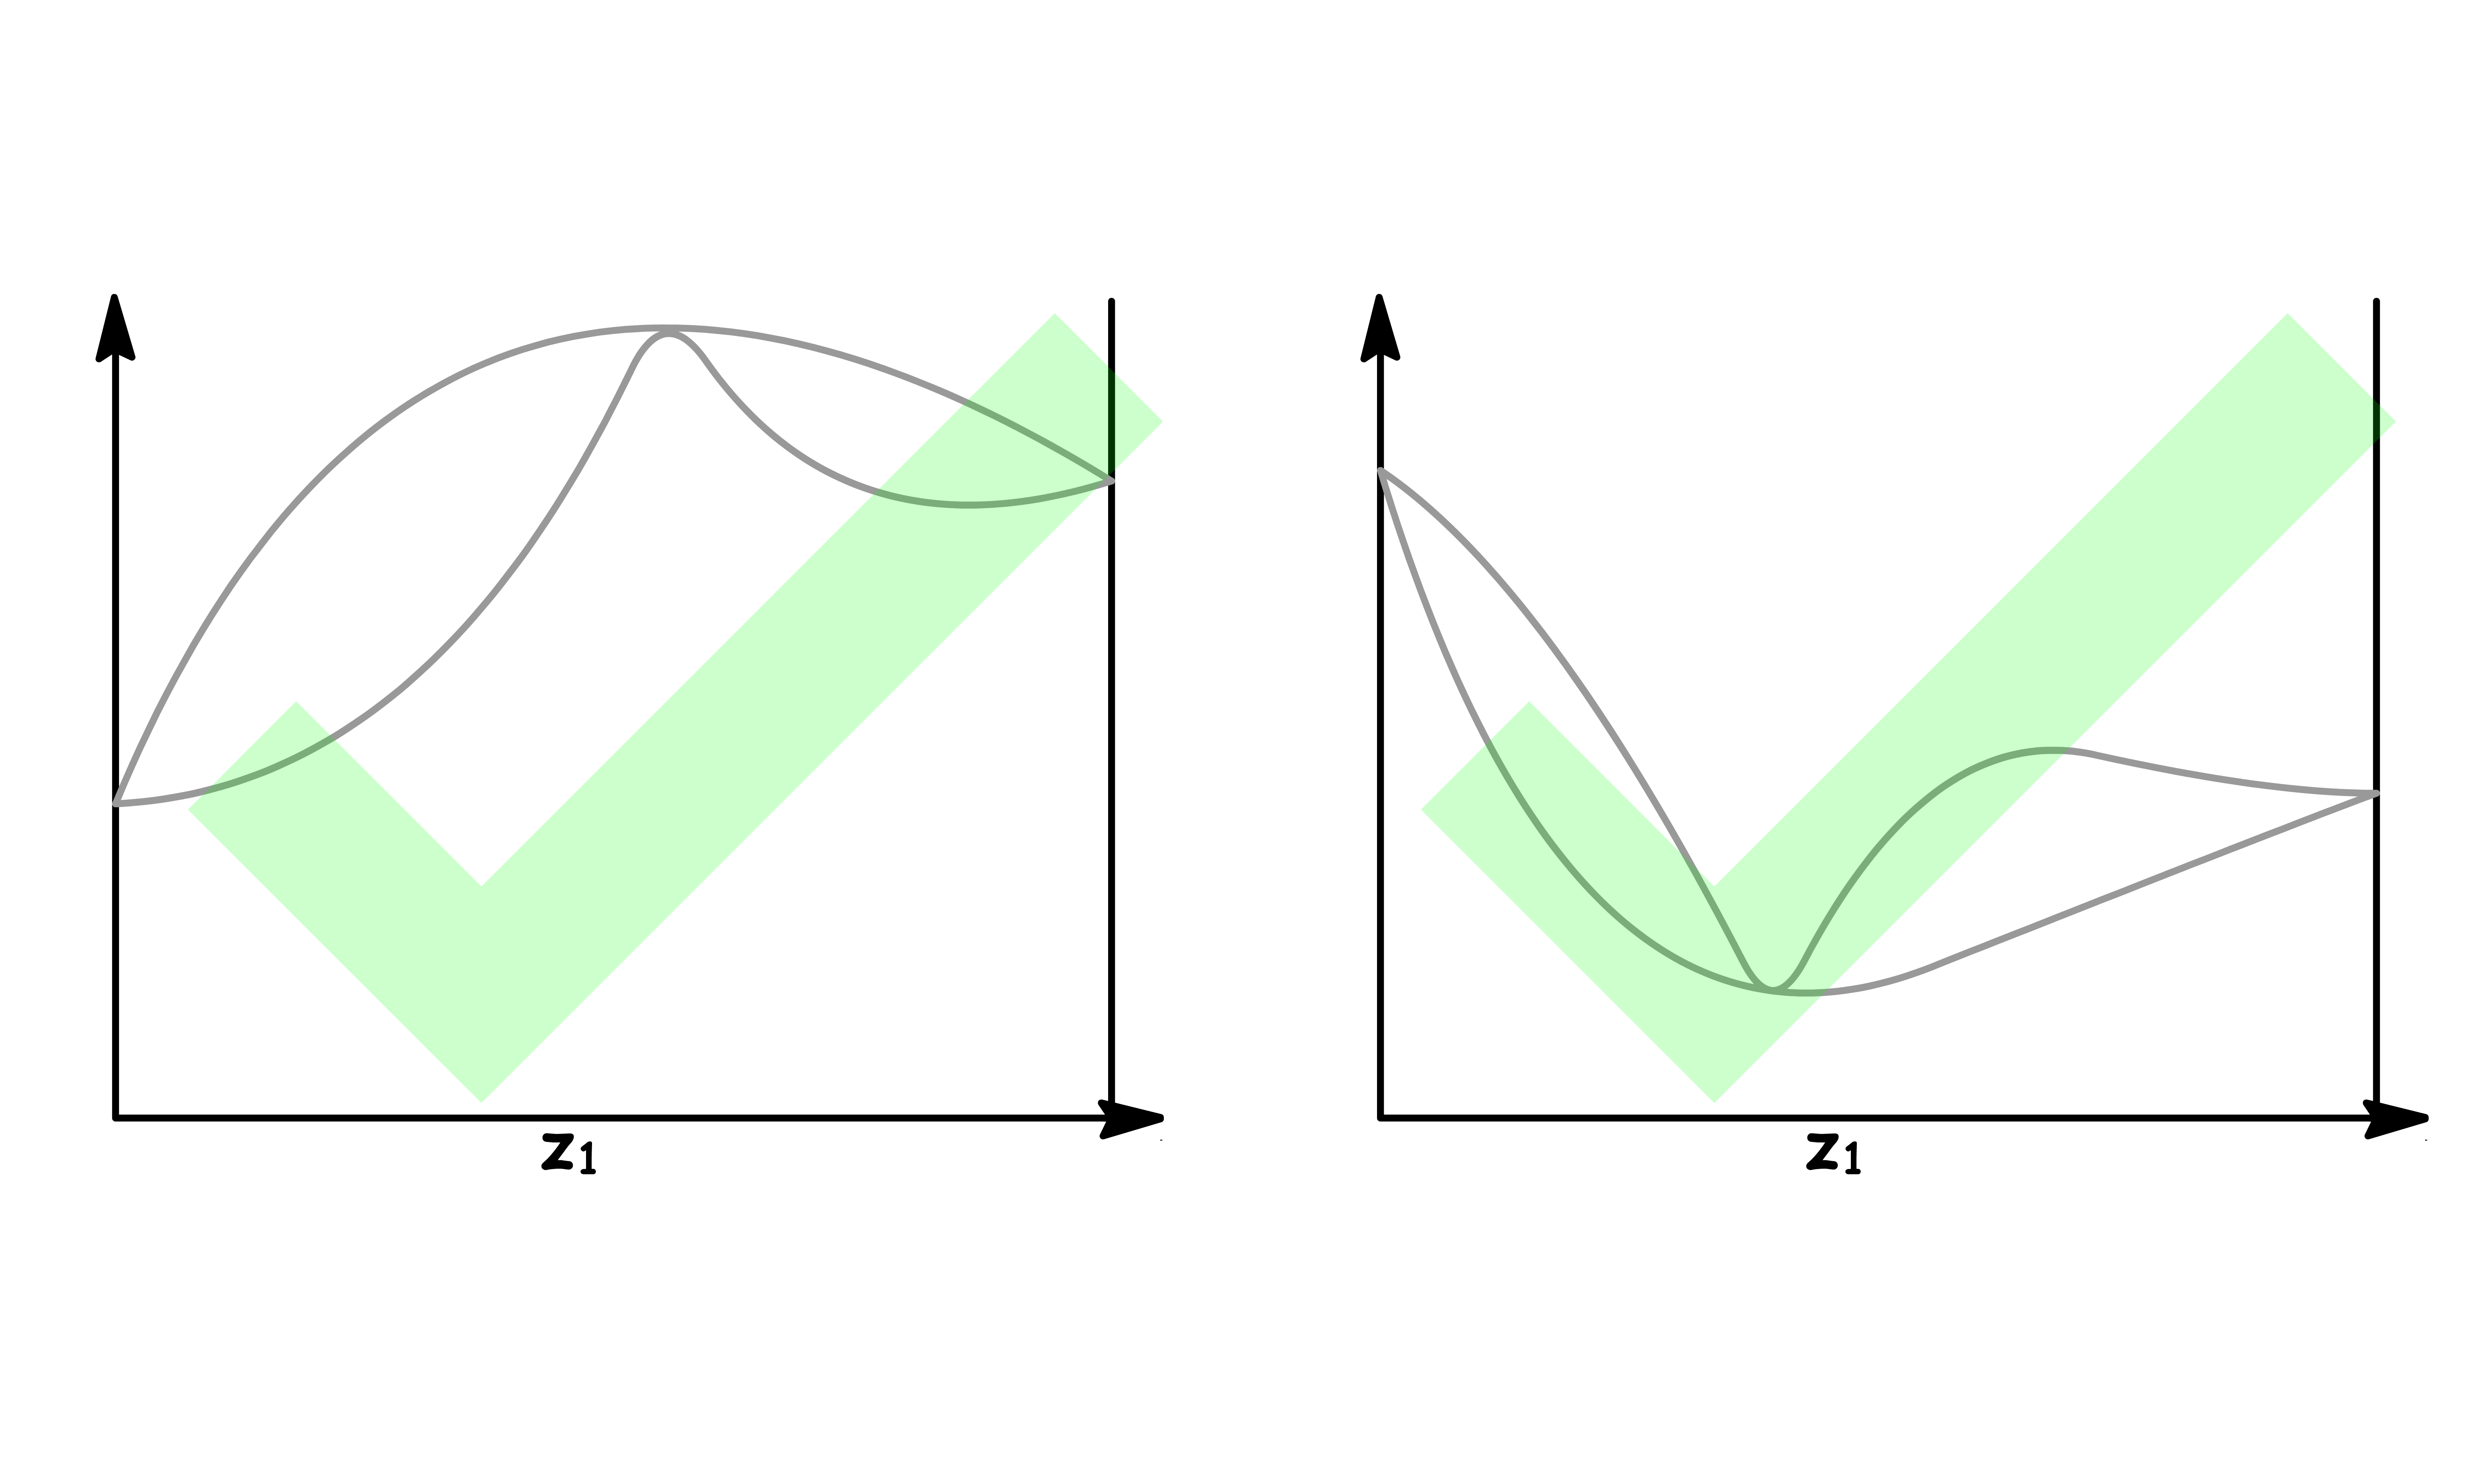
The only way we can draw these kind of phase diagrams is to have both curve converge at the maximum or minimum
- Either a maximum or a minimum point in such a curve is called an azeotrope. The two curves representing vapour and liquid compositions are tangent at this point
¶ Intermolecular Interaction Dictates the Shape of the Phase Diagrams
- As established in the previous chapter, non-ideal solutions are solutions where the intermolecular interaction between the mixture is different from that of the pure substance
- How these real phase diagrams deviates from ideality therefore depends on the nature of the intermolecular interaction
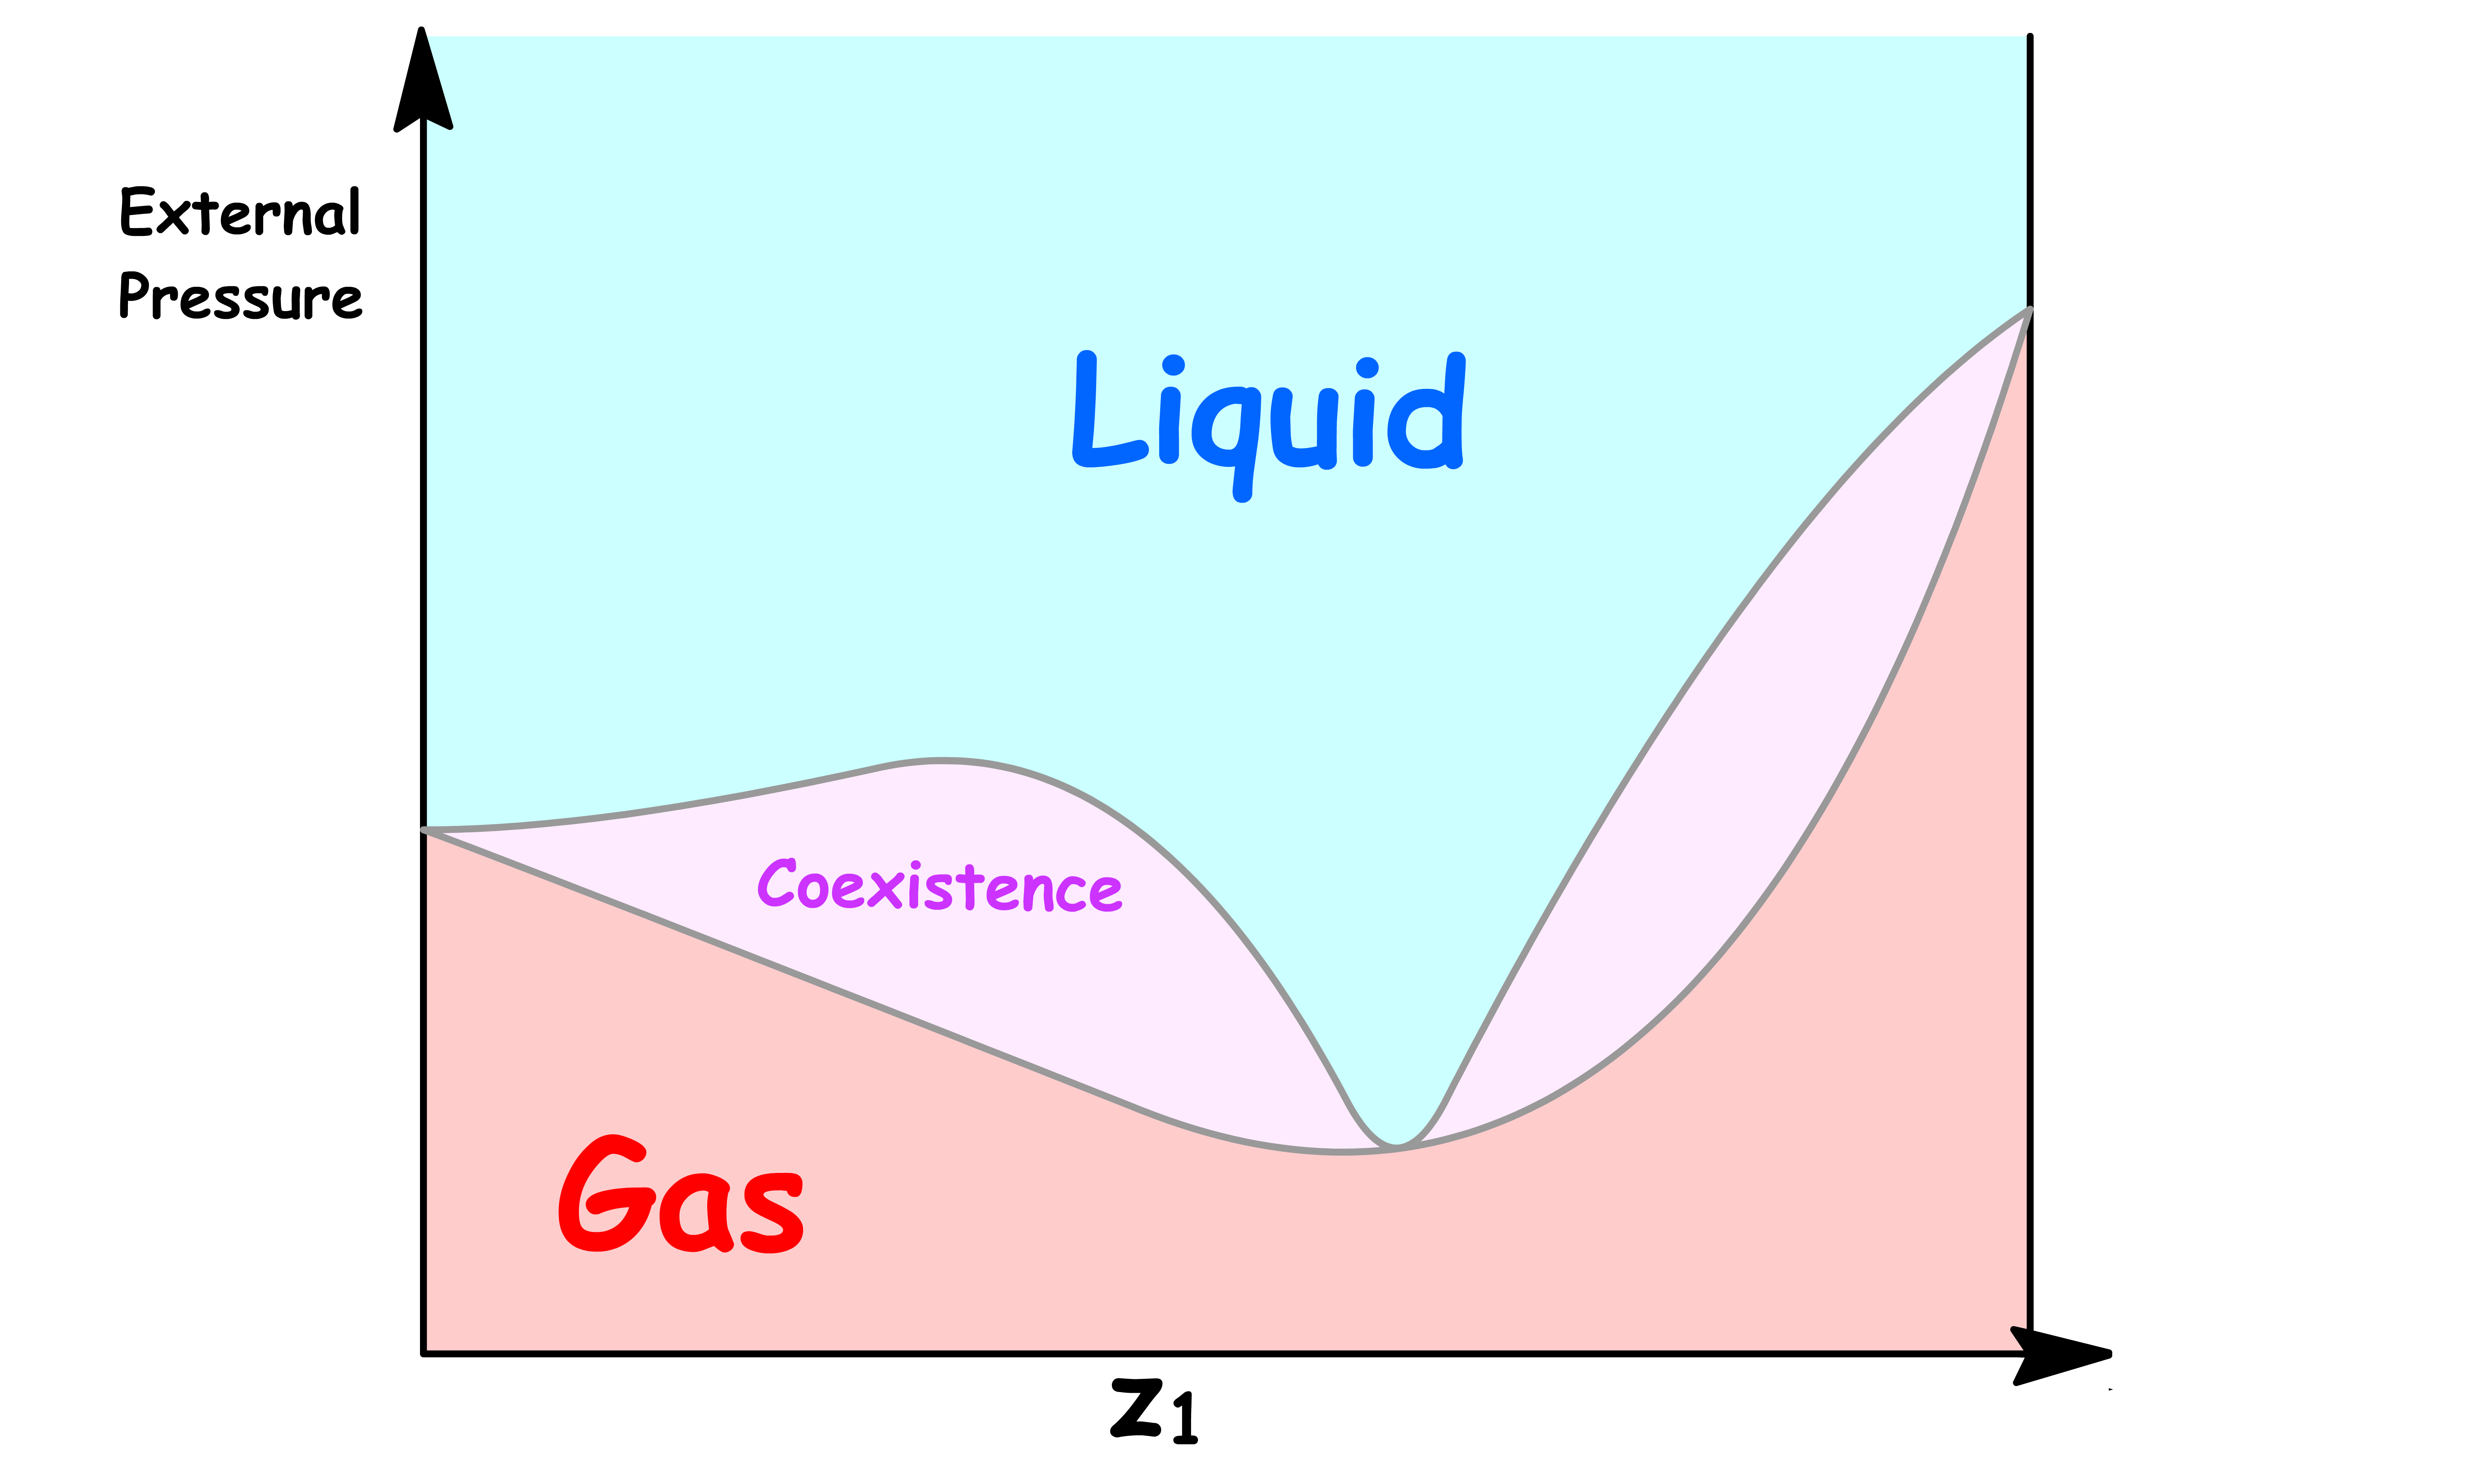
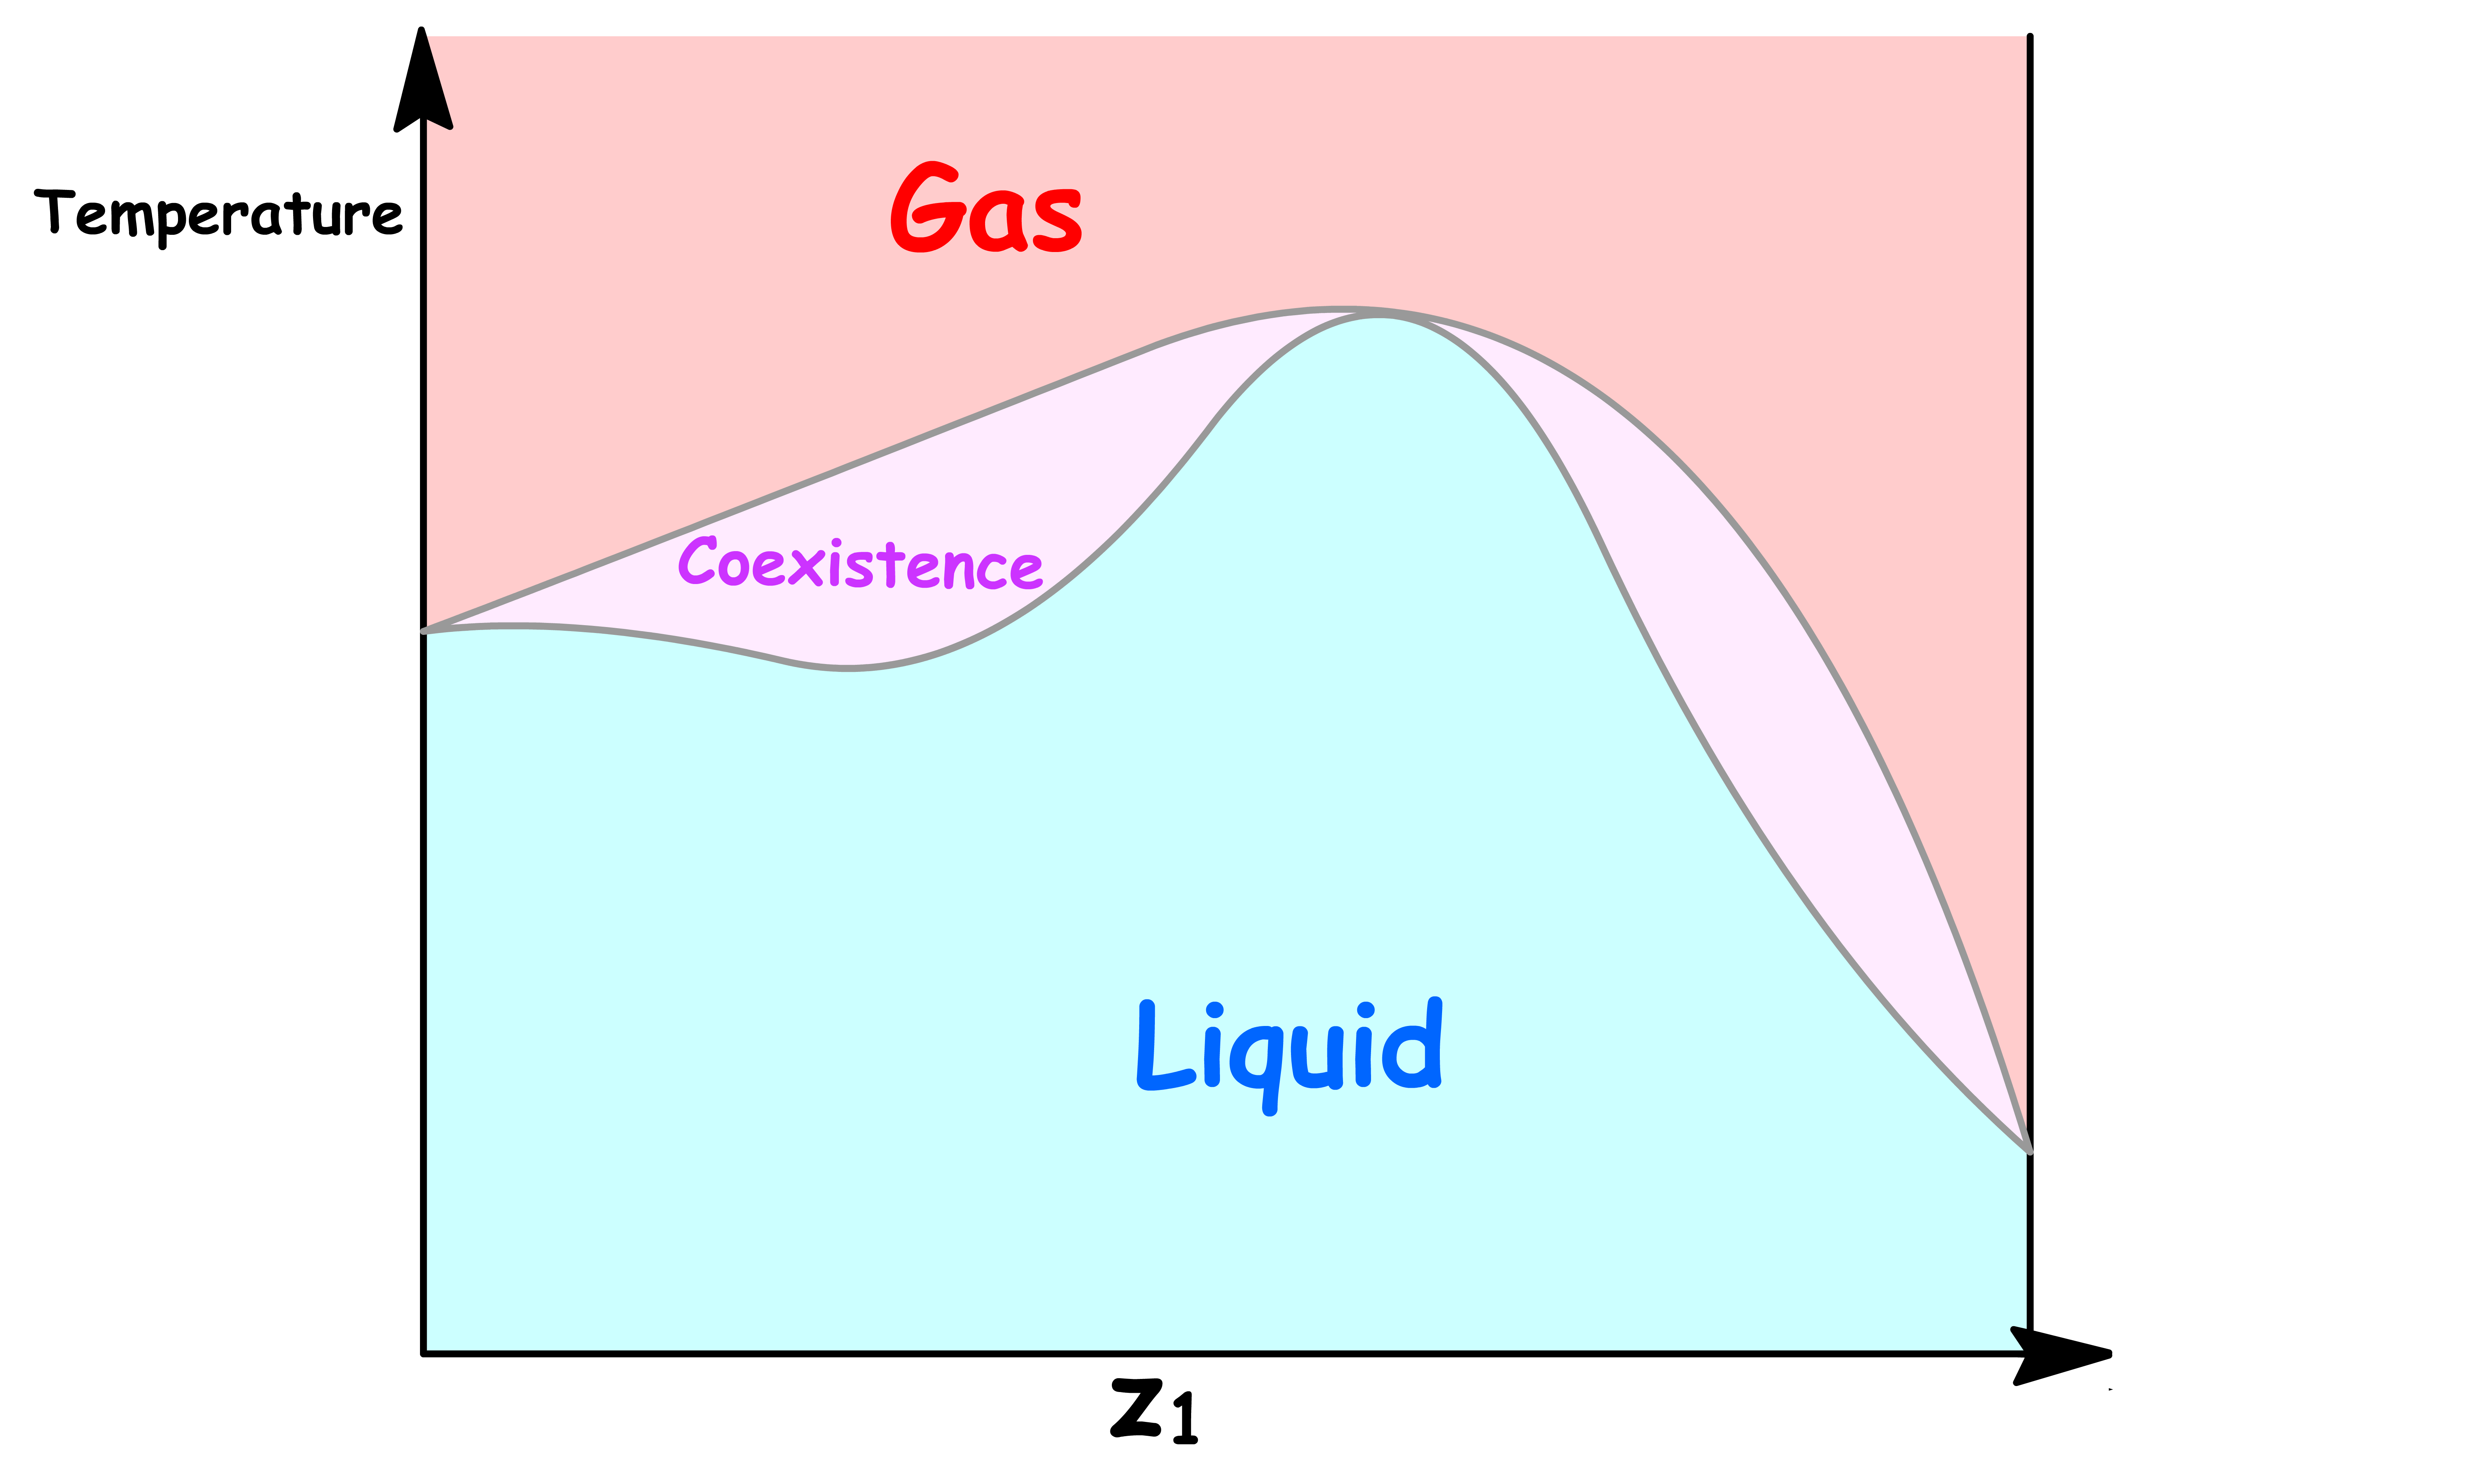
ΔmixH is NegativeLet us first consider the case where the intermolecular interaction within the mixture is stronger than that of the pure liquids. In other words, the enthalpy of mixing is negative
- The favorable interactions between the mixtures reduces the vapour pressure and the Pressure-Composition Phase Diagram will have a minimum if the interaction is strong enough
- The favorable interactions between the mixtures stabilizes the liquid phase, which in turns raises the boiling point. Hence, the Temperature-Composition Phase Diagram will have a maximum if the interaction is strong enough
ΔmixH is Positive
We shall now consider the case where the intermolecular interaction within the mixture is weaker than that of the pure liquids. In other words, the enthalpy of mixing is positive
- The interactions within the mixtures is destabilizing, which increases the vapour pressure and the Pressure-Composition Phase Diagram will have a maximum if the interaction is strong enough
- The interactions between the mixtures destabilizes the liquid phase, which in turns lowers the boiling point. Hence, the Temperature-Composition Phase Diagram will have a minimum if the interaction is strong enough
¶ Azeotropes and Distillation
- The reason why distillation can purify liquid from solution is because the composition of the vapour is not the same as the composition of the solution
However, distillation does not work when we are at the azeotrope
- This is because the liquid and vapour phase have the same composition at an azeotrope
- In other words, a liquid whose composition is at the azeotrope when boiled will yield vapour with the same composition as the liquid
- It is therefore impossible to distill from one side of an azeotrope to another
Since vaporization does not change the liquid's composition, the entire sample of liquid will boil at constant temperature
- The boiling of azeotrope resembles that of a pure compound and contrasts with that of most solutions of two liquids, which boil over a temperature range
¶ Liquid-Liquid Phase Diagrams of Partially Miscible Liquids
There are two types of miscibility
- When two liquids are soluble at any proportion, they are said to be completely miscible
- When two liquids are only soluble in each other to a limited extent, they are said to be partially miscible
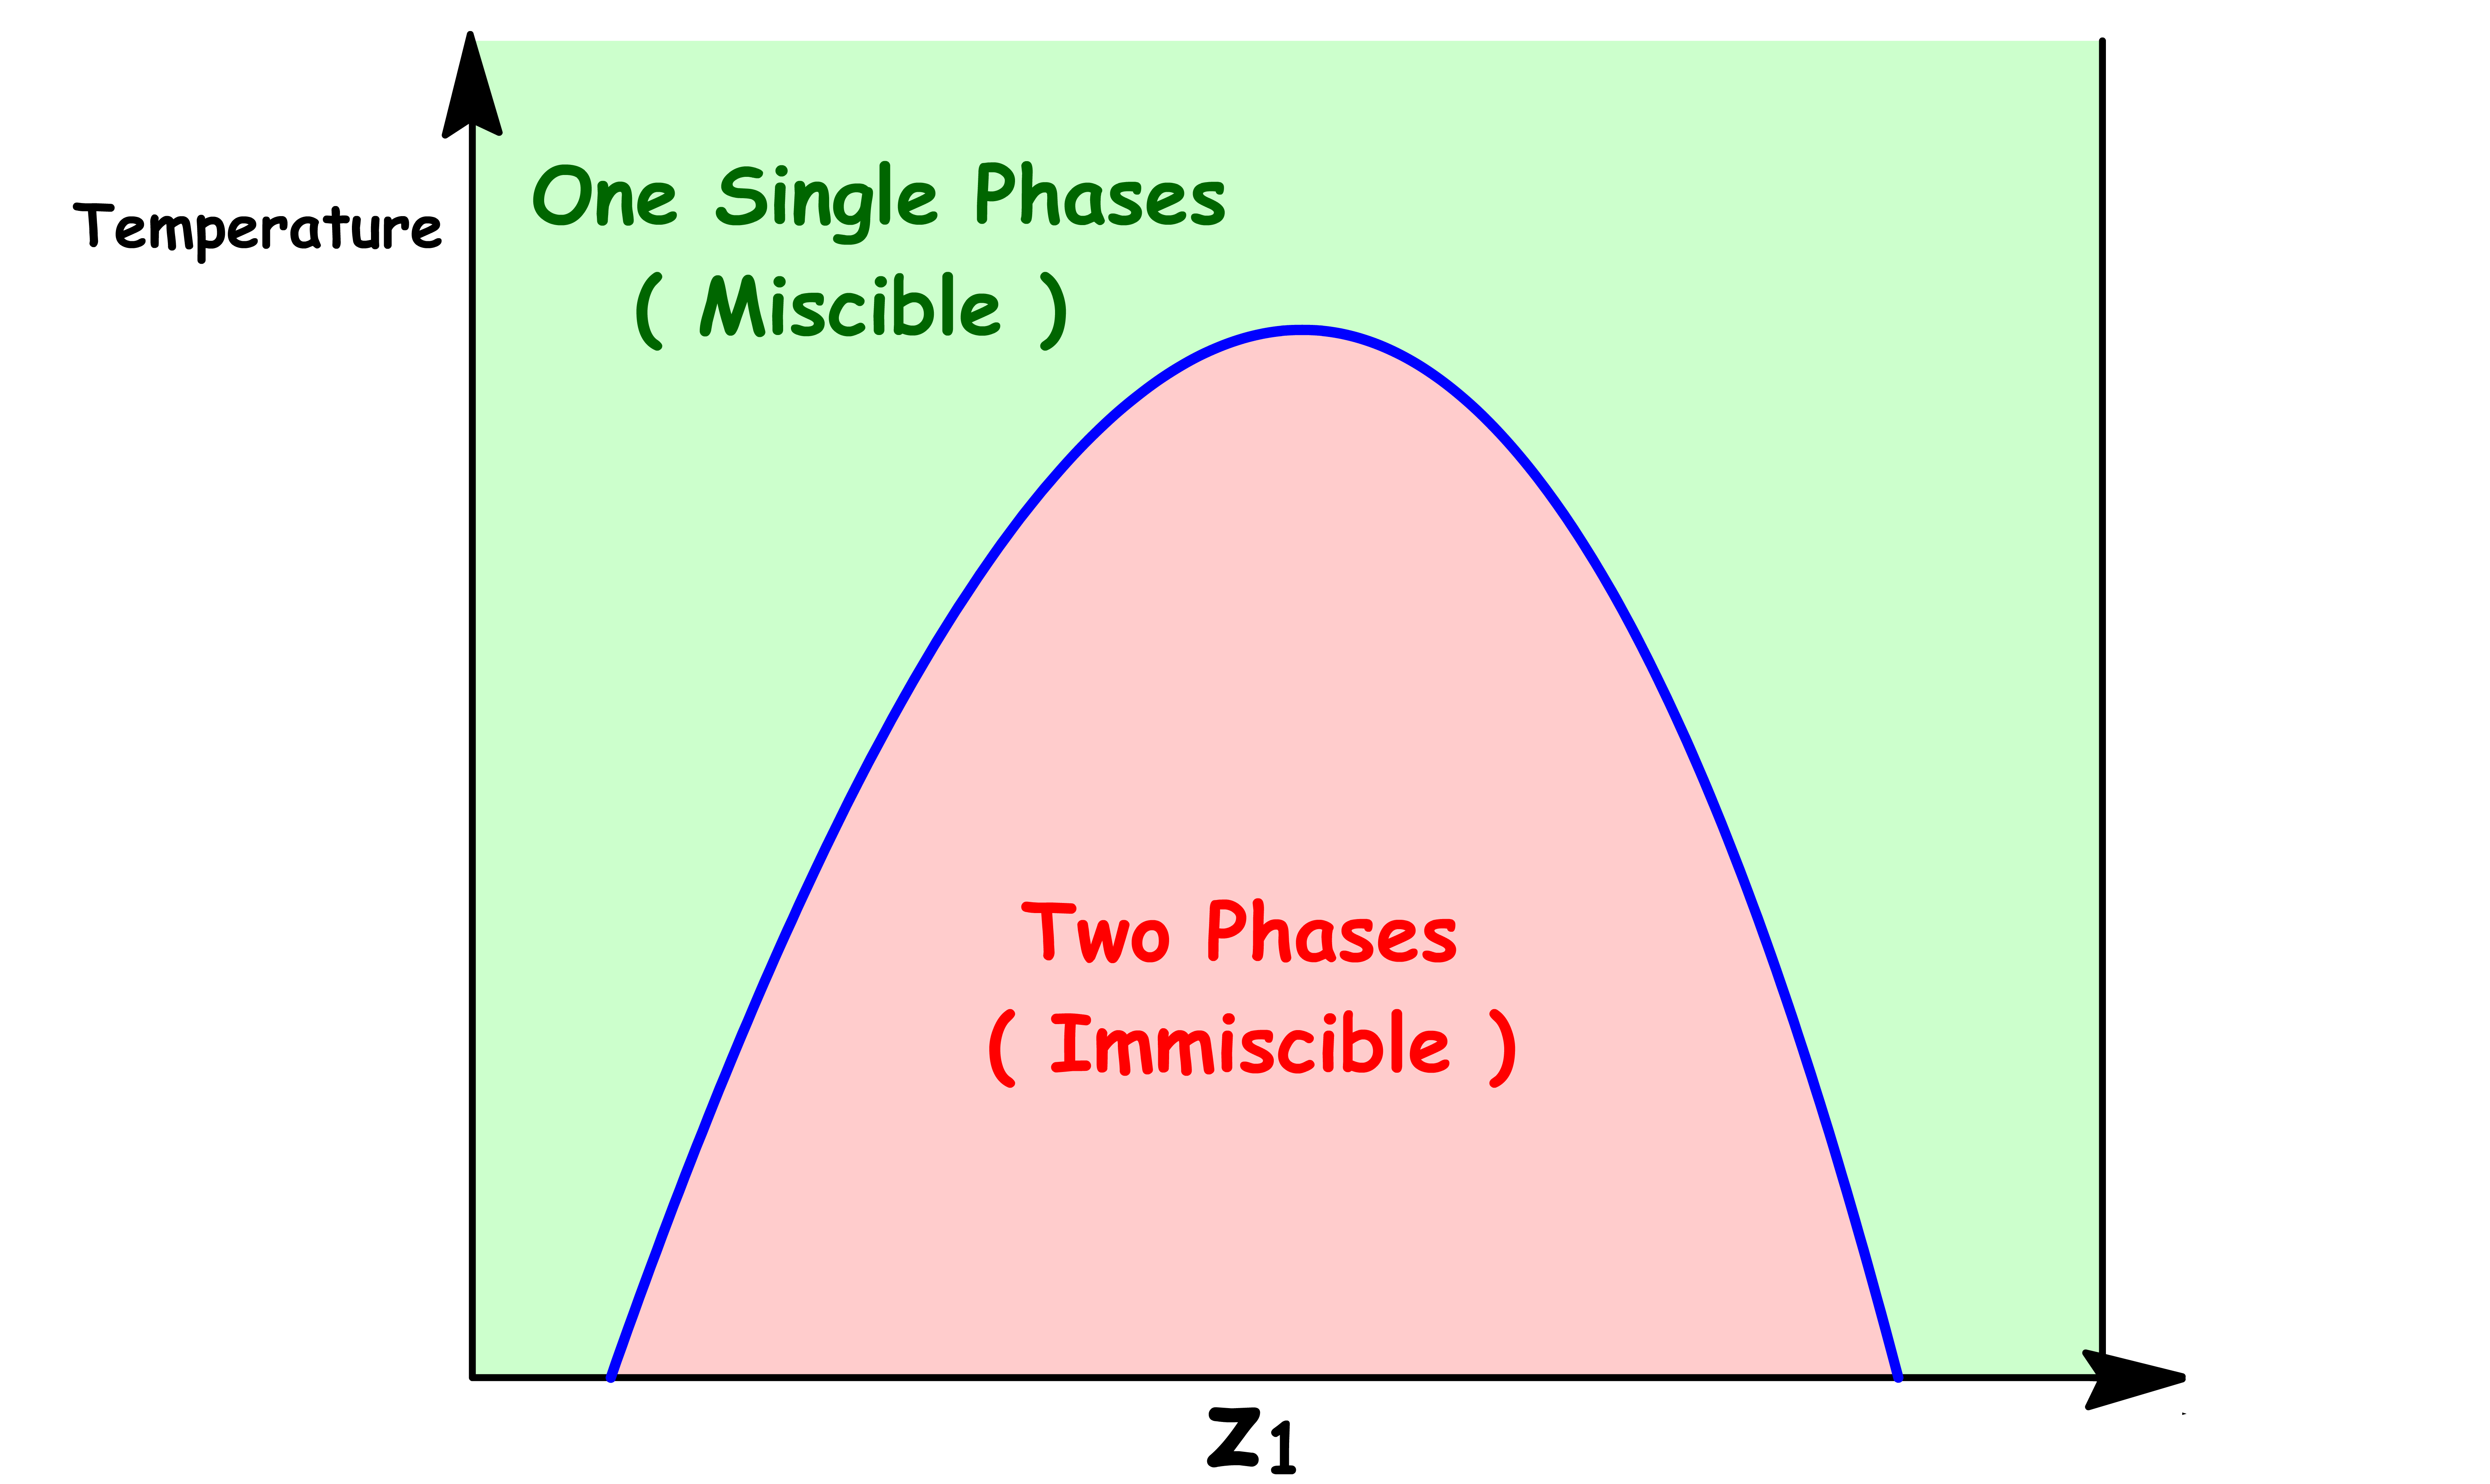
We are particularly interested in the Temperature vs Composition Liquid-Liquid Phase Diagram
- The curve separating the two-phase region from the one-phase region is called the binodal curve
- In the two-phase region below the binodal curve, there will be two distinct phases present, typically called the rich and lean phases
- Above the binodal curve, there is only one phase present, which is a mixture of the two liquids
¶ Miscibility Vary with Composition
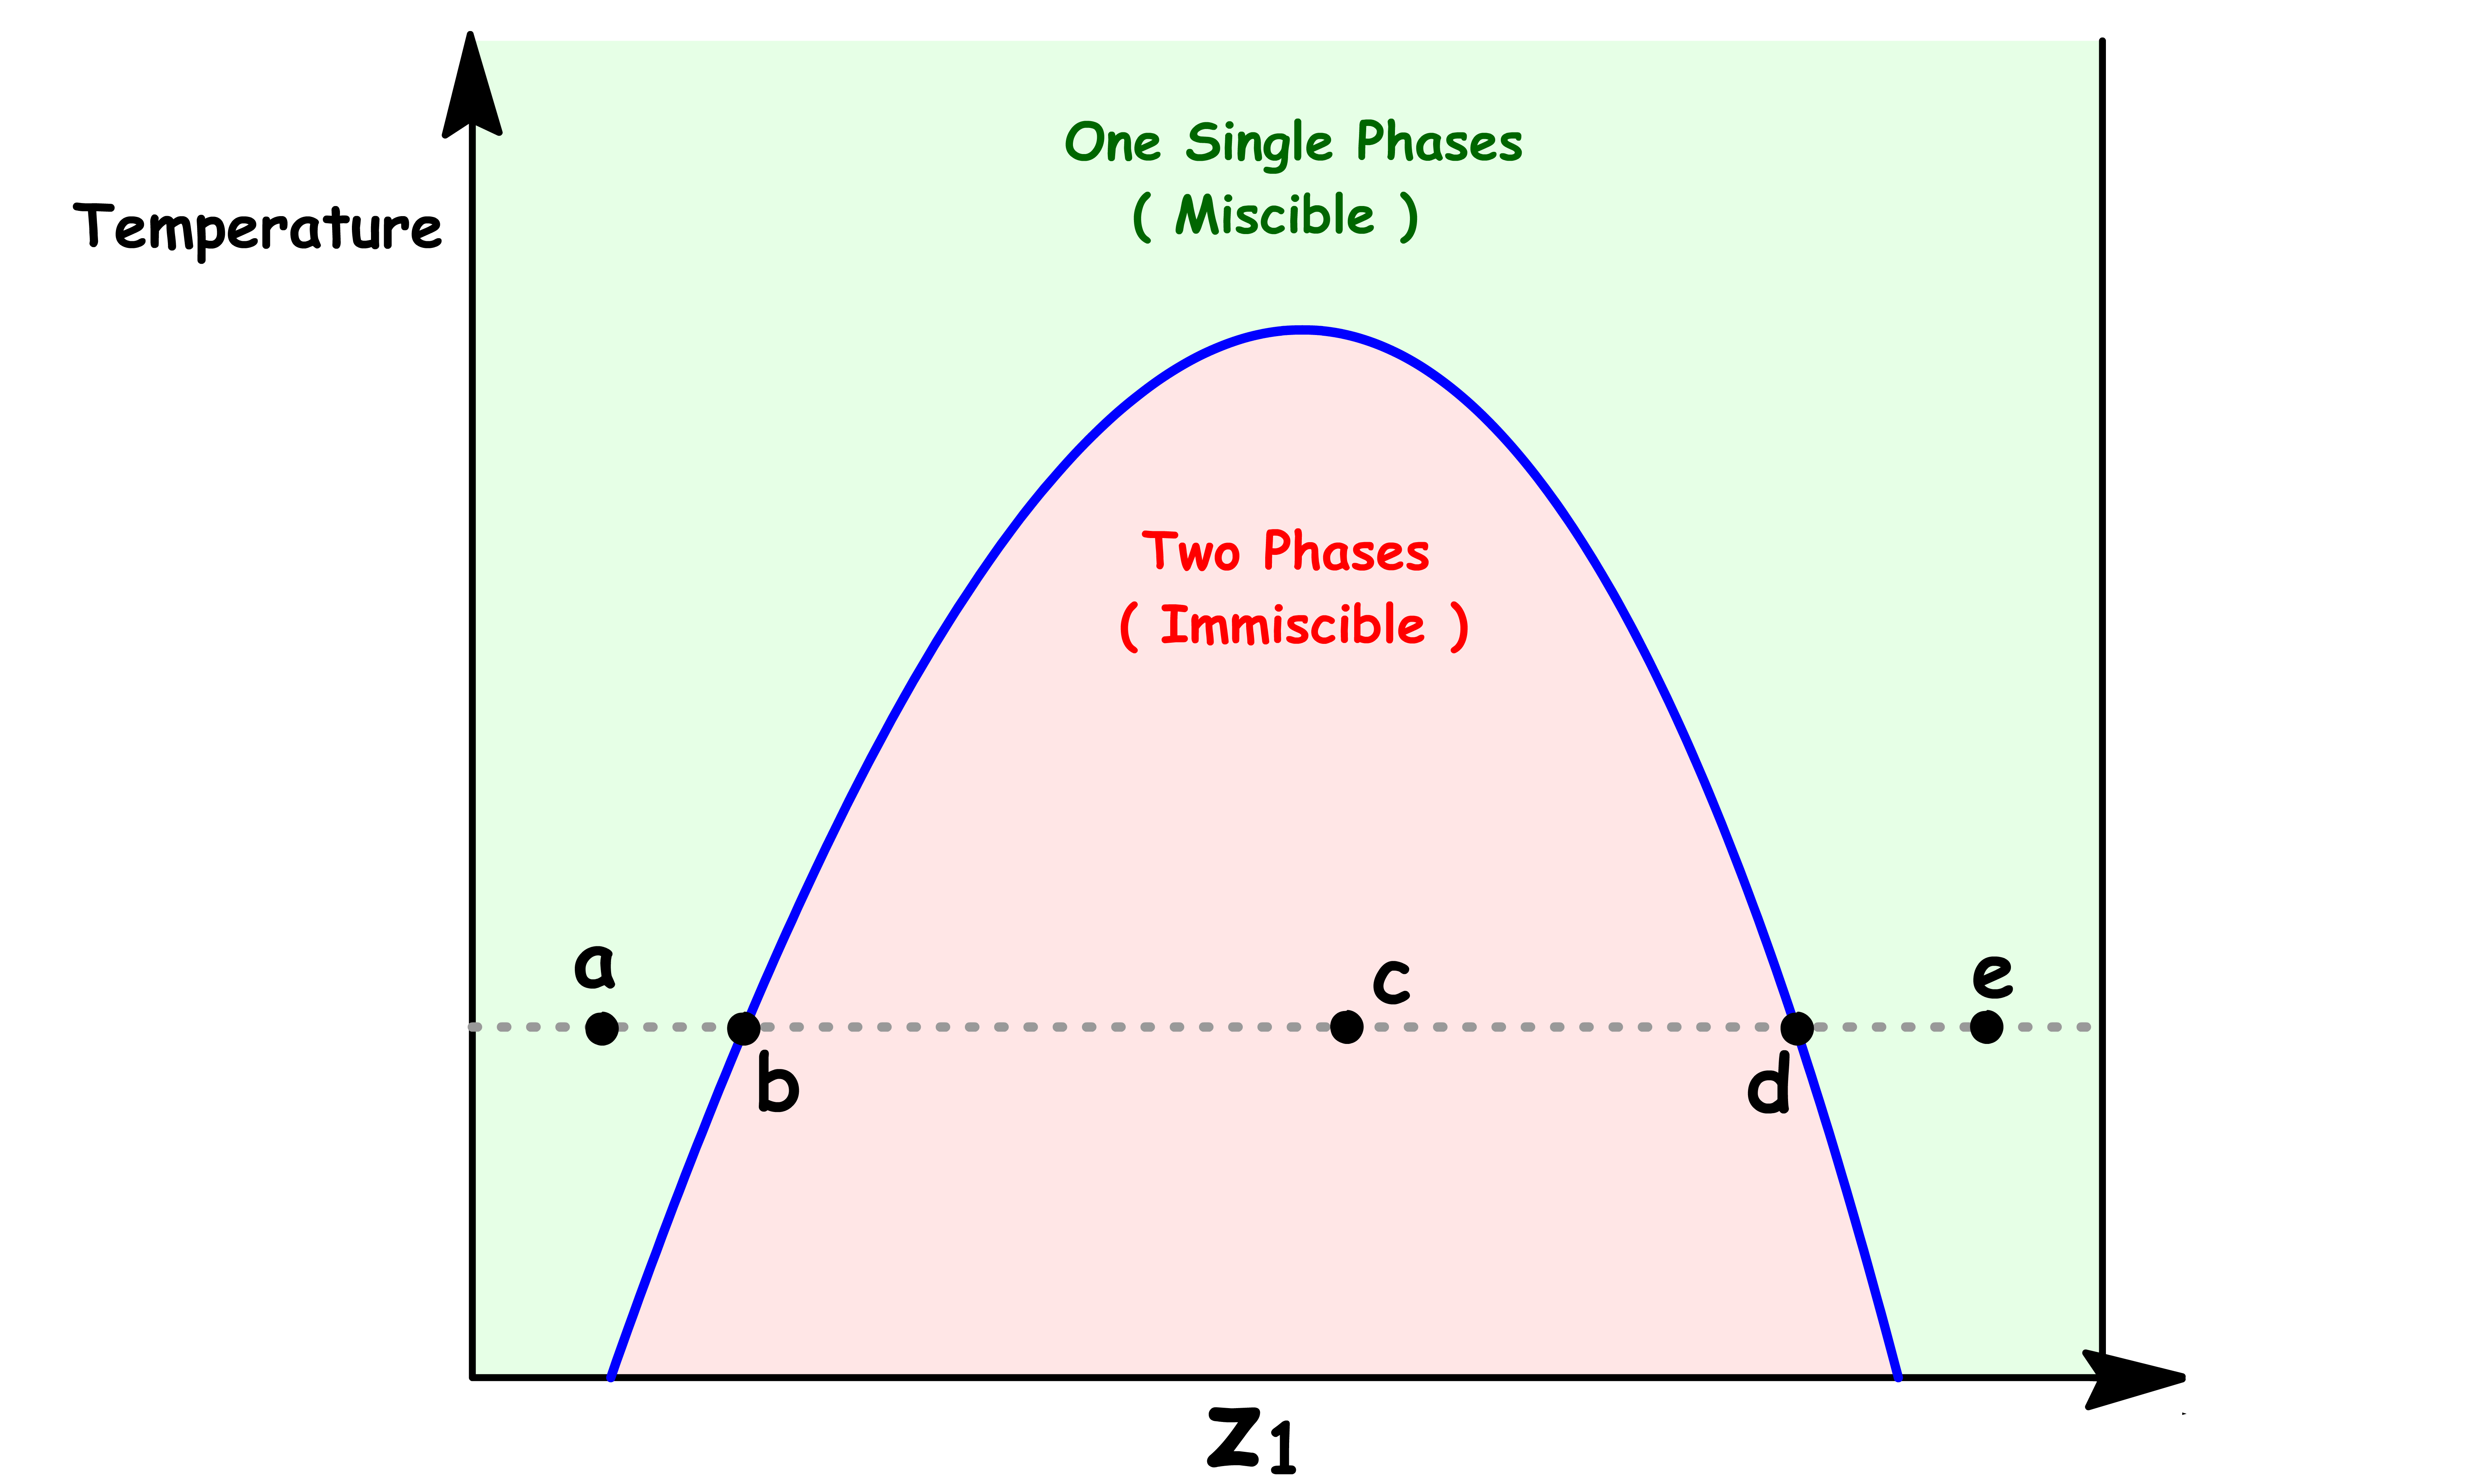
Let us consider a situation where we change the mole fraction of one component at constant temperature
- At constant temperature, the solubility of one liquid in the other will remain the same
- Hence, the composition of each phases will remain constant once it is saturated
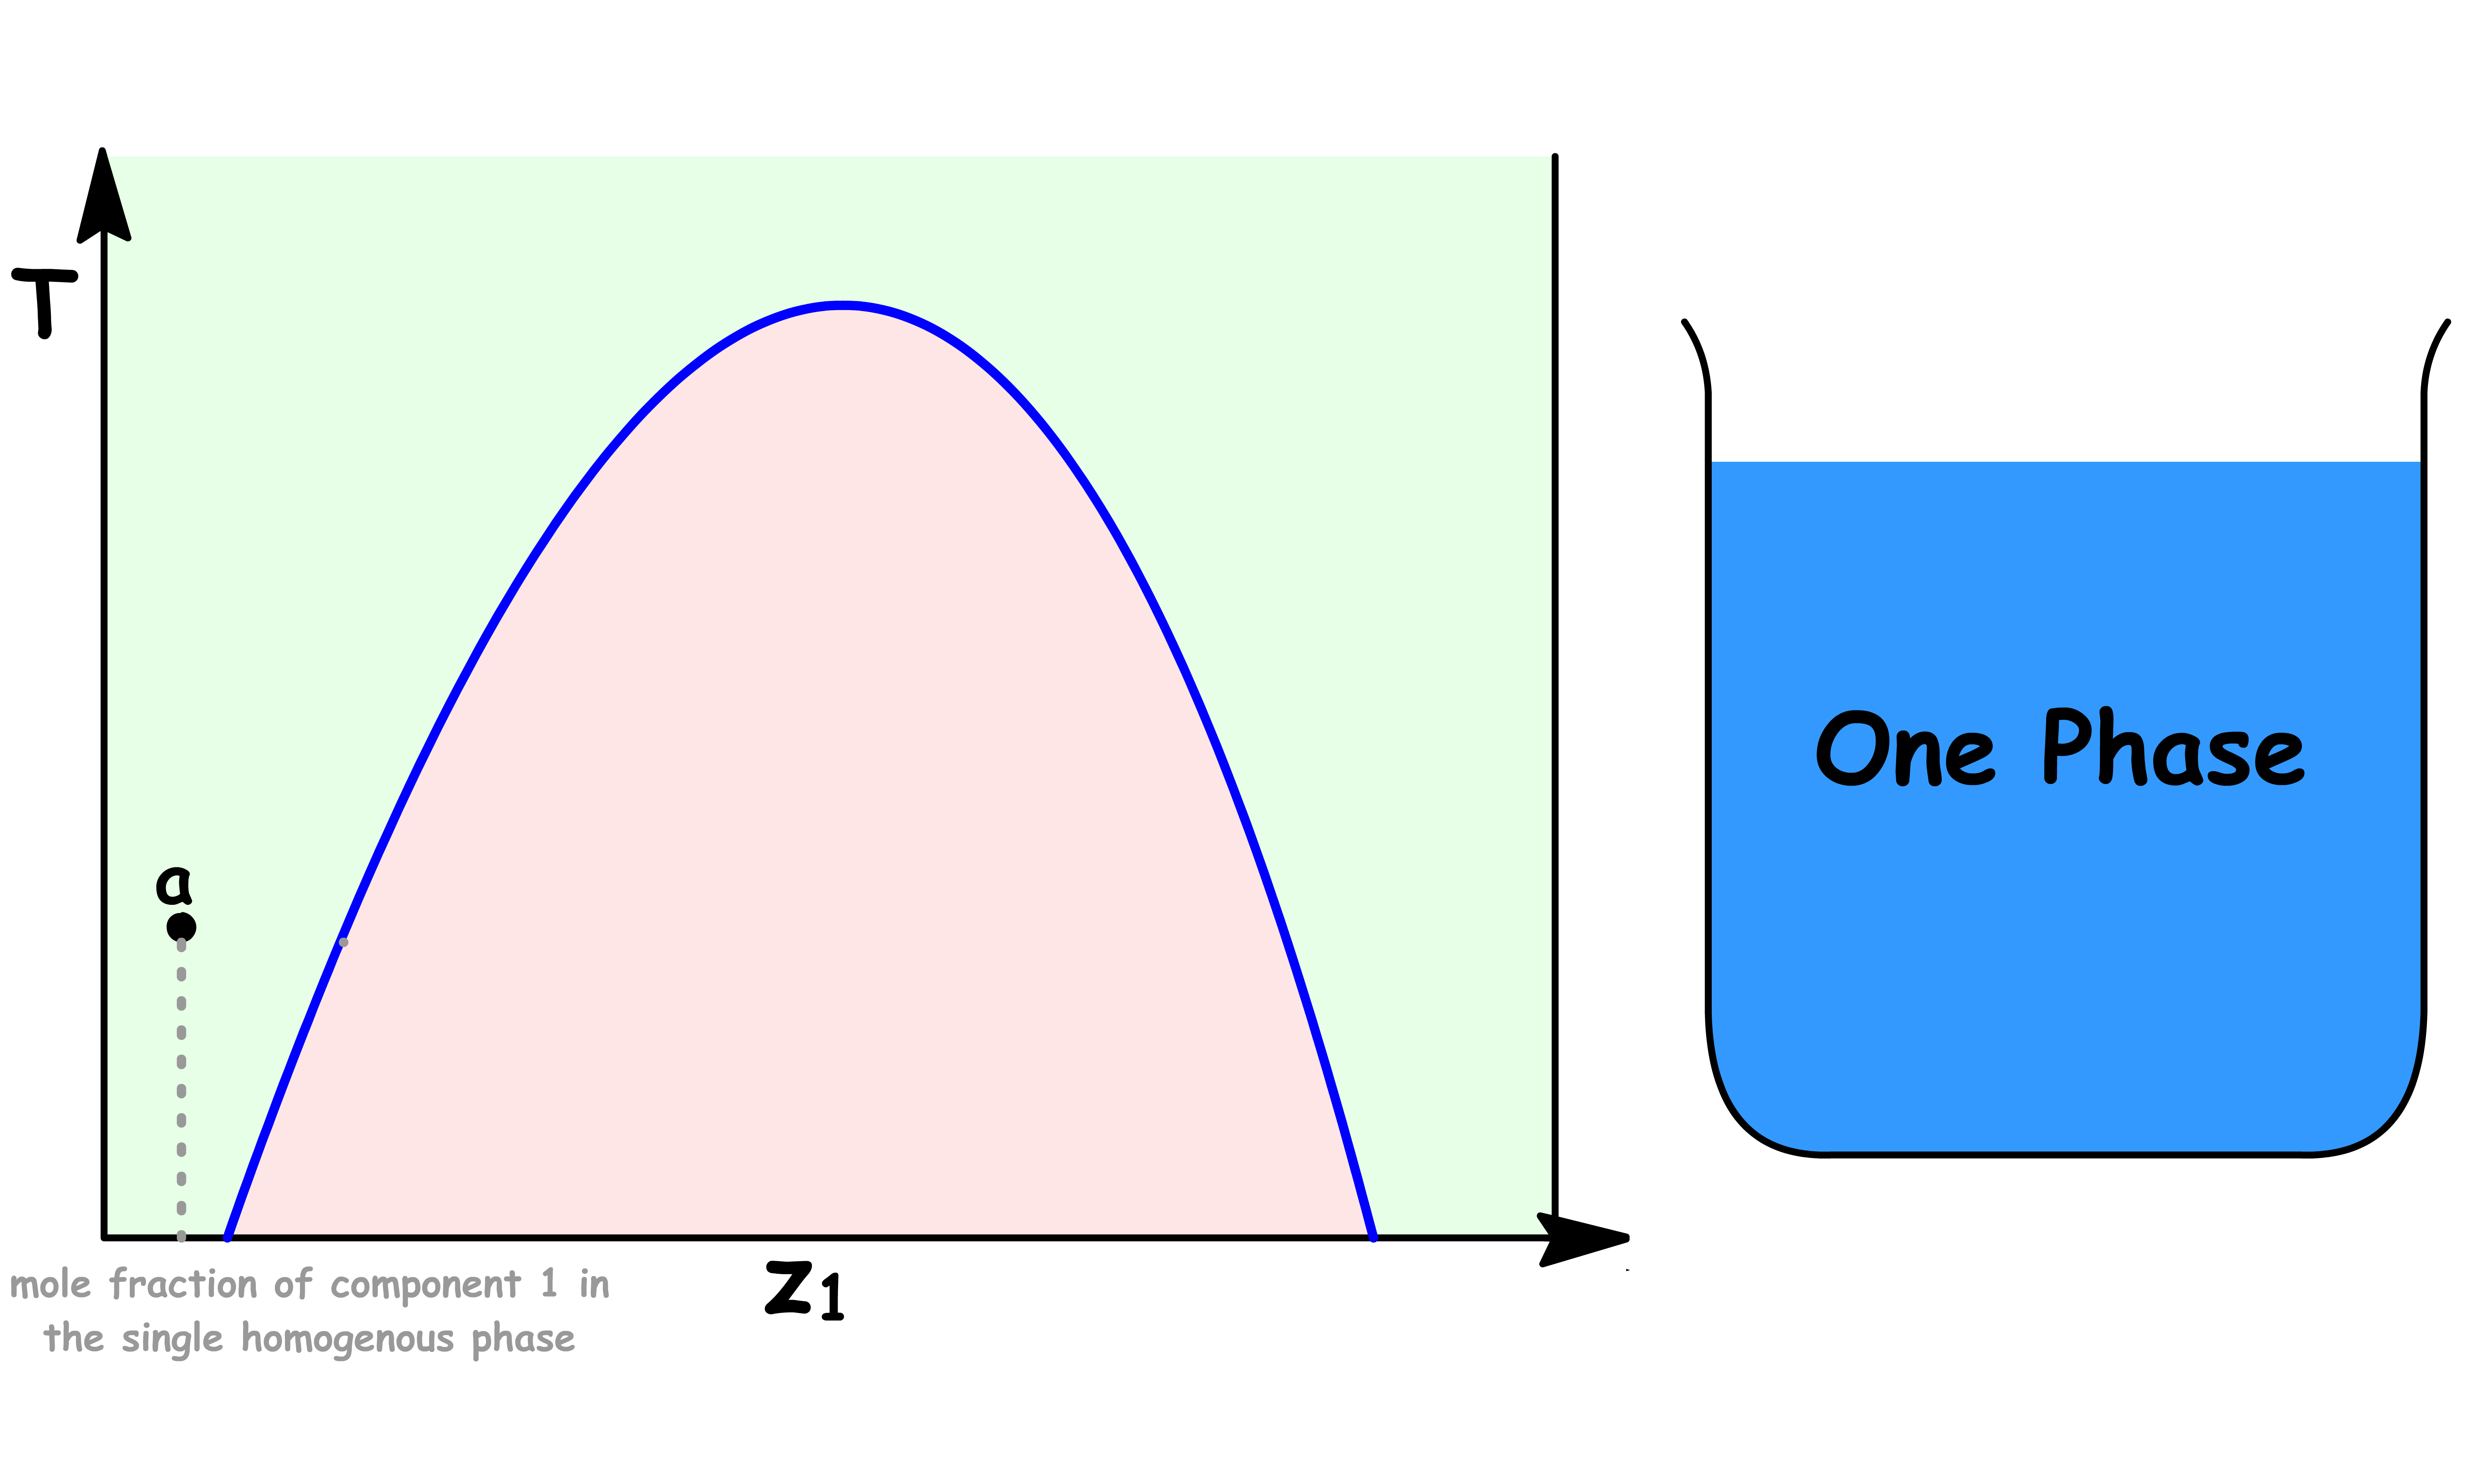
Point a
- At point a, the sample consists of a single liquid phase
- A small amount of component 1 is dissolved in liquid 2
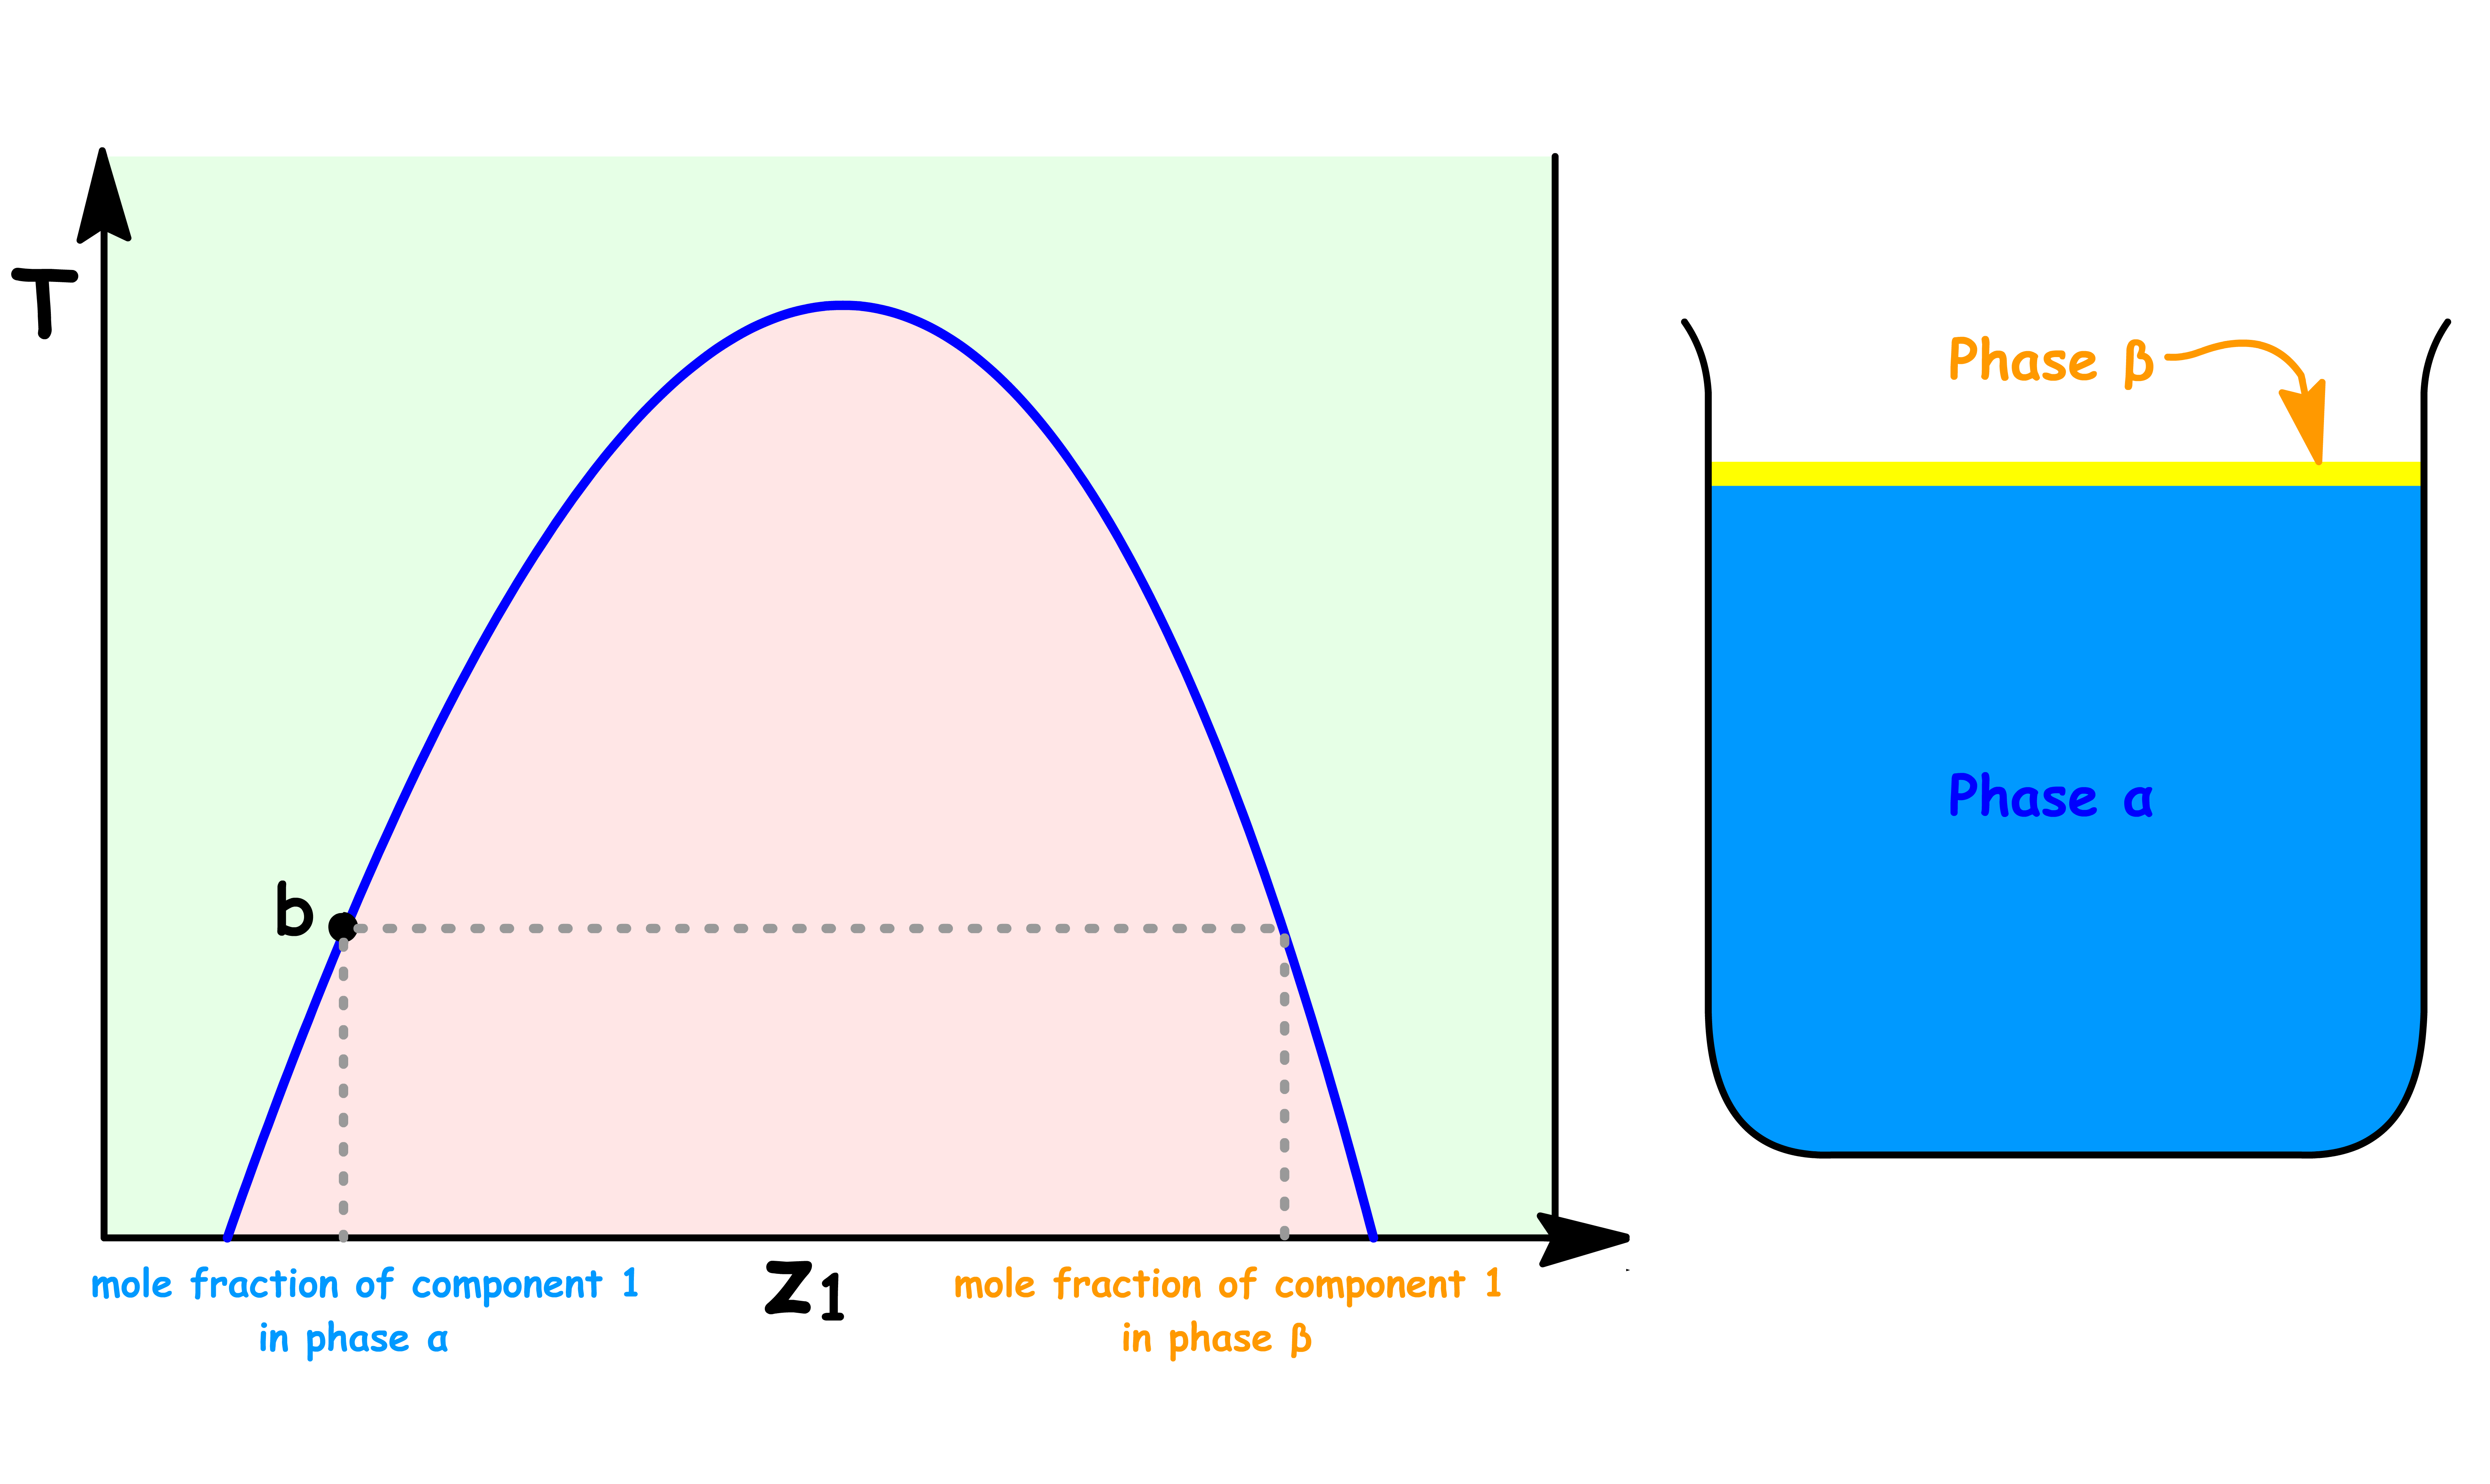
Point b
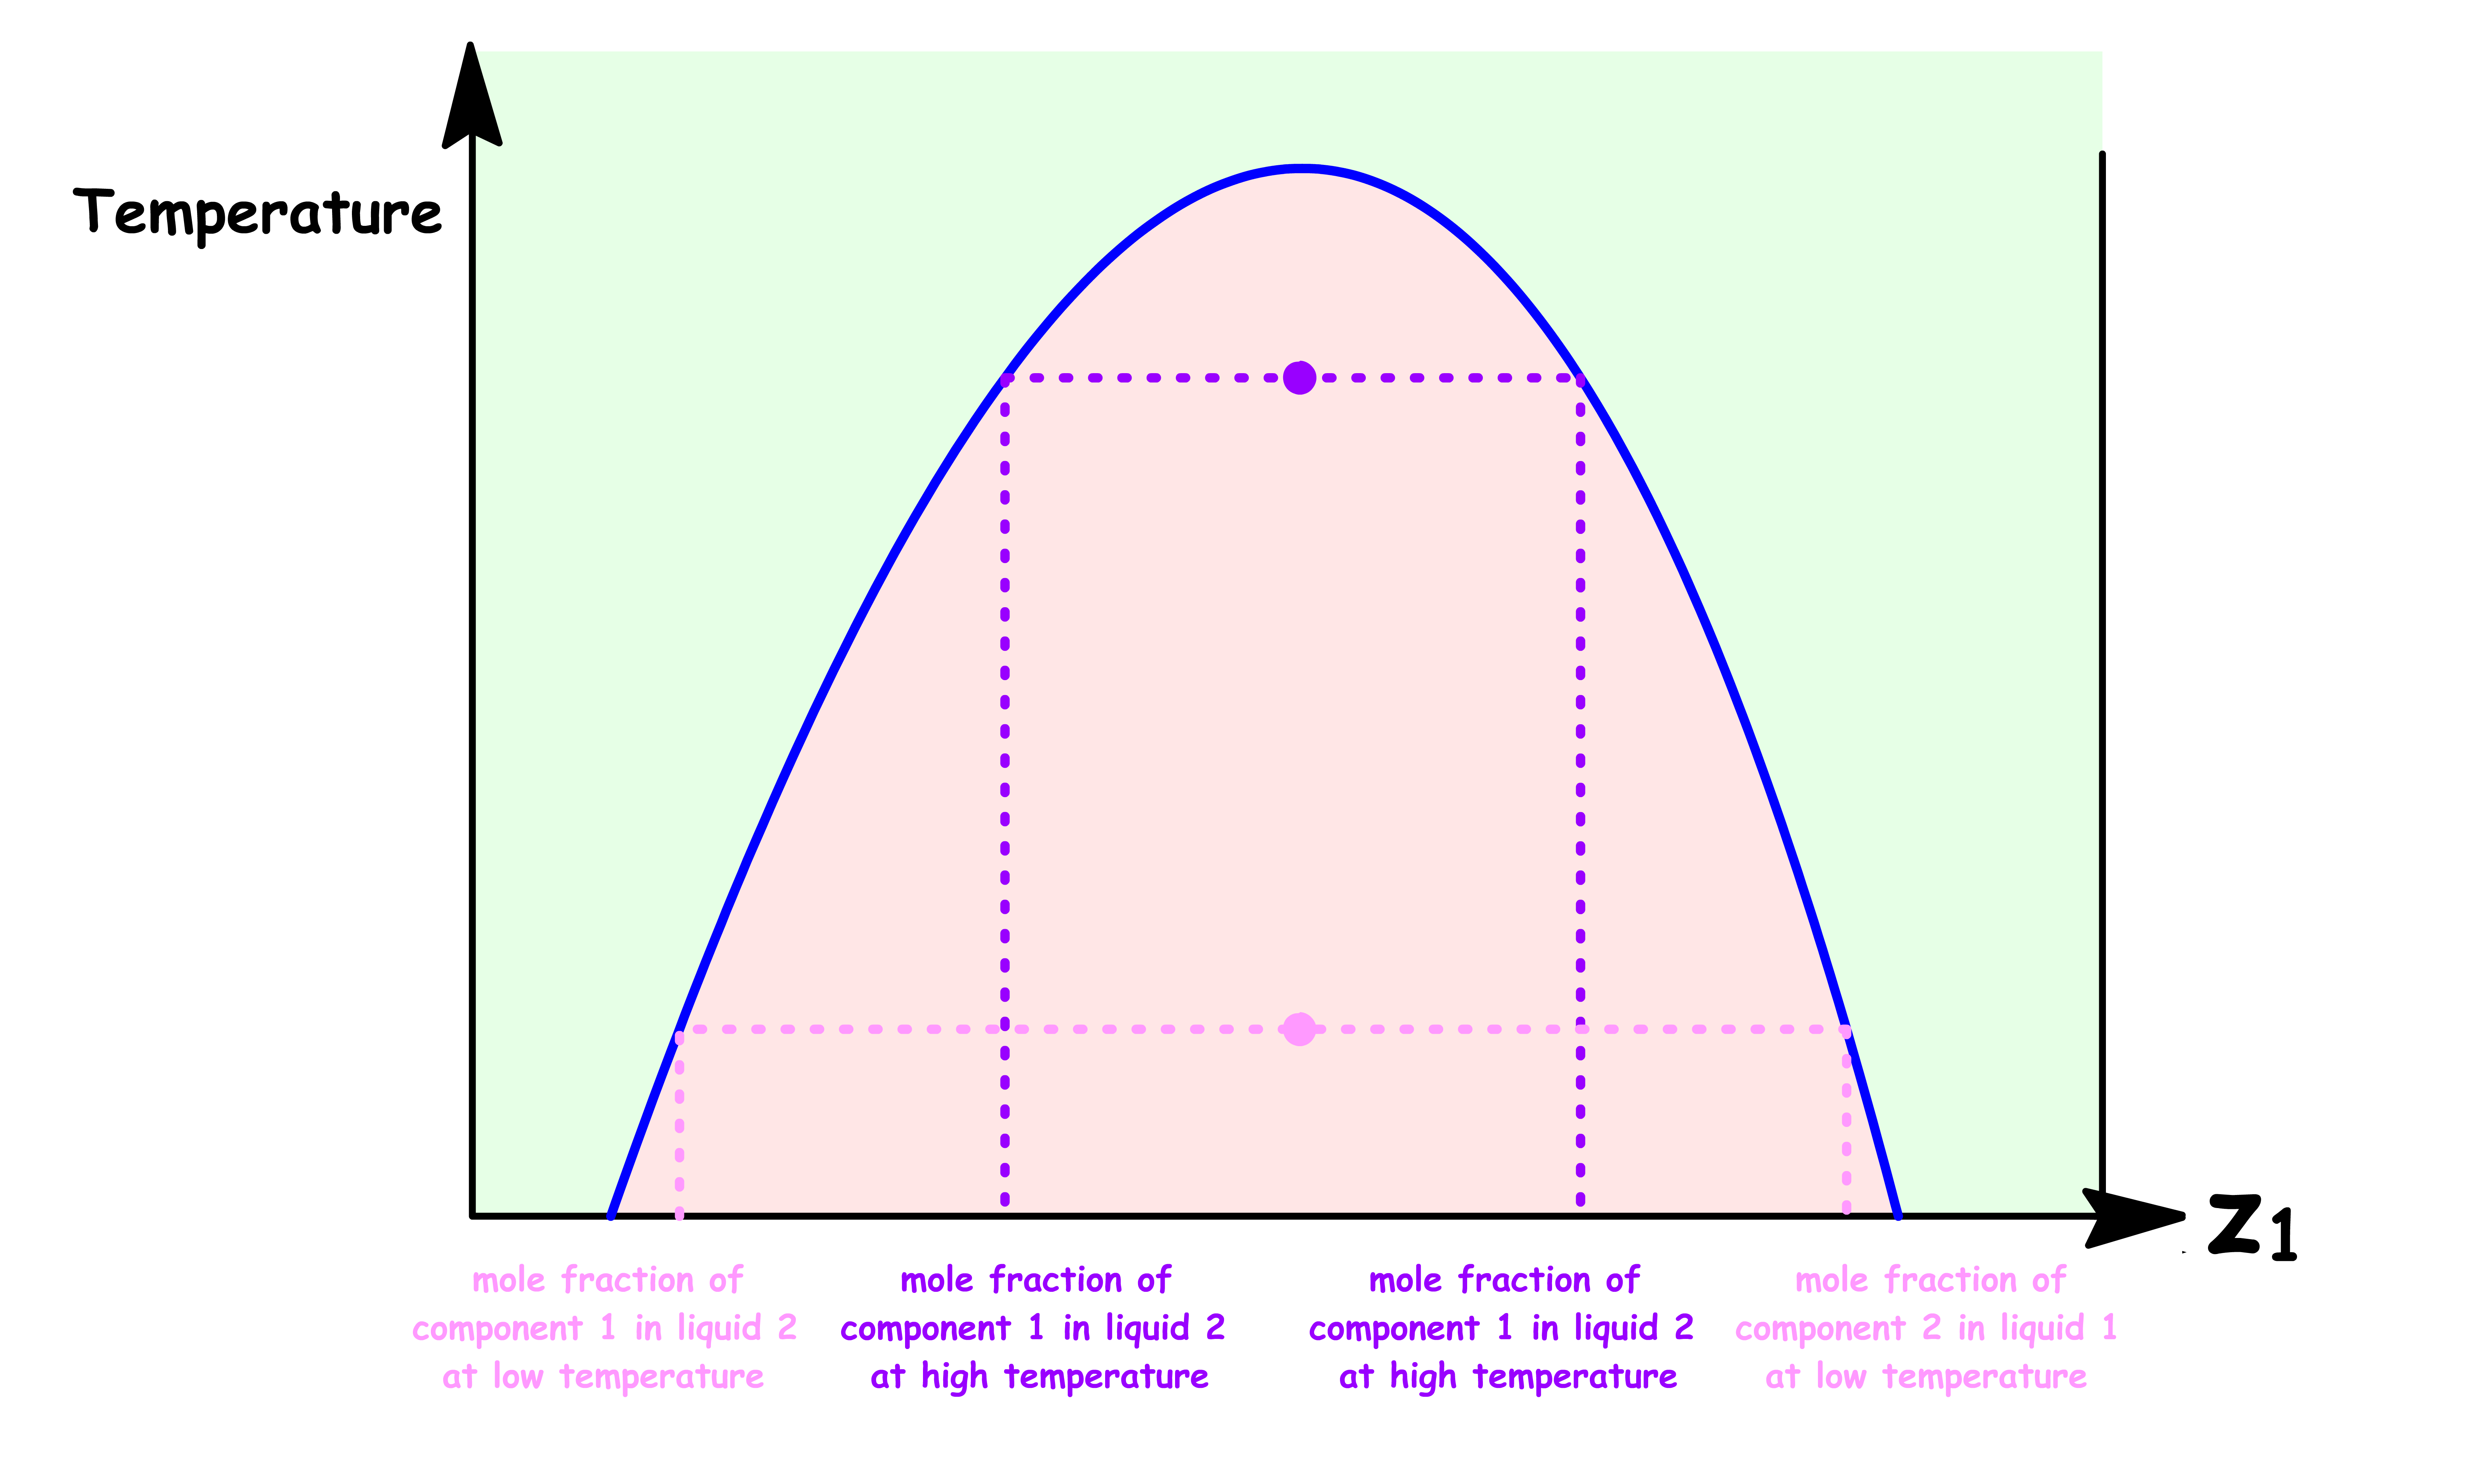
At point b, we have reached the maximum solubility of component 1 in liquid 2
The sample consists of two distinct liquid phase: Liquid 2 saturated with component 1 ( Phase α ) and Liquid 1 saturated with component 2 ( Phase β )
At this point, the volume of Phase β is zero
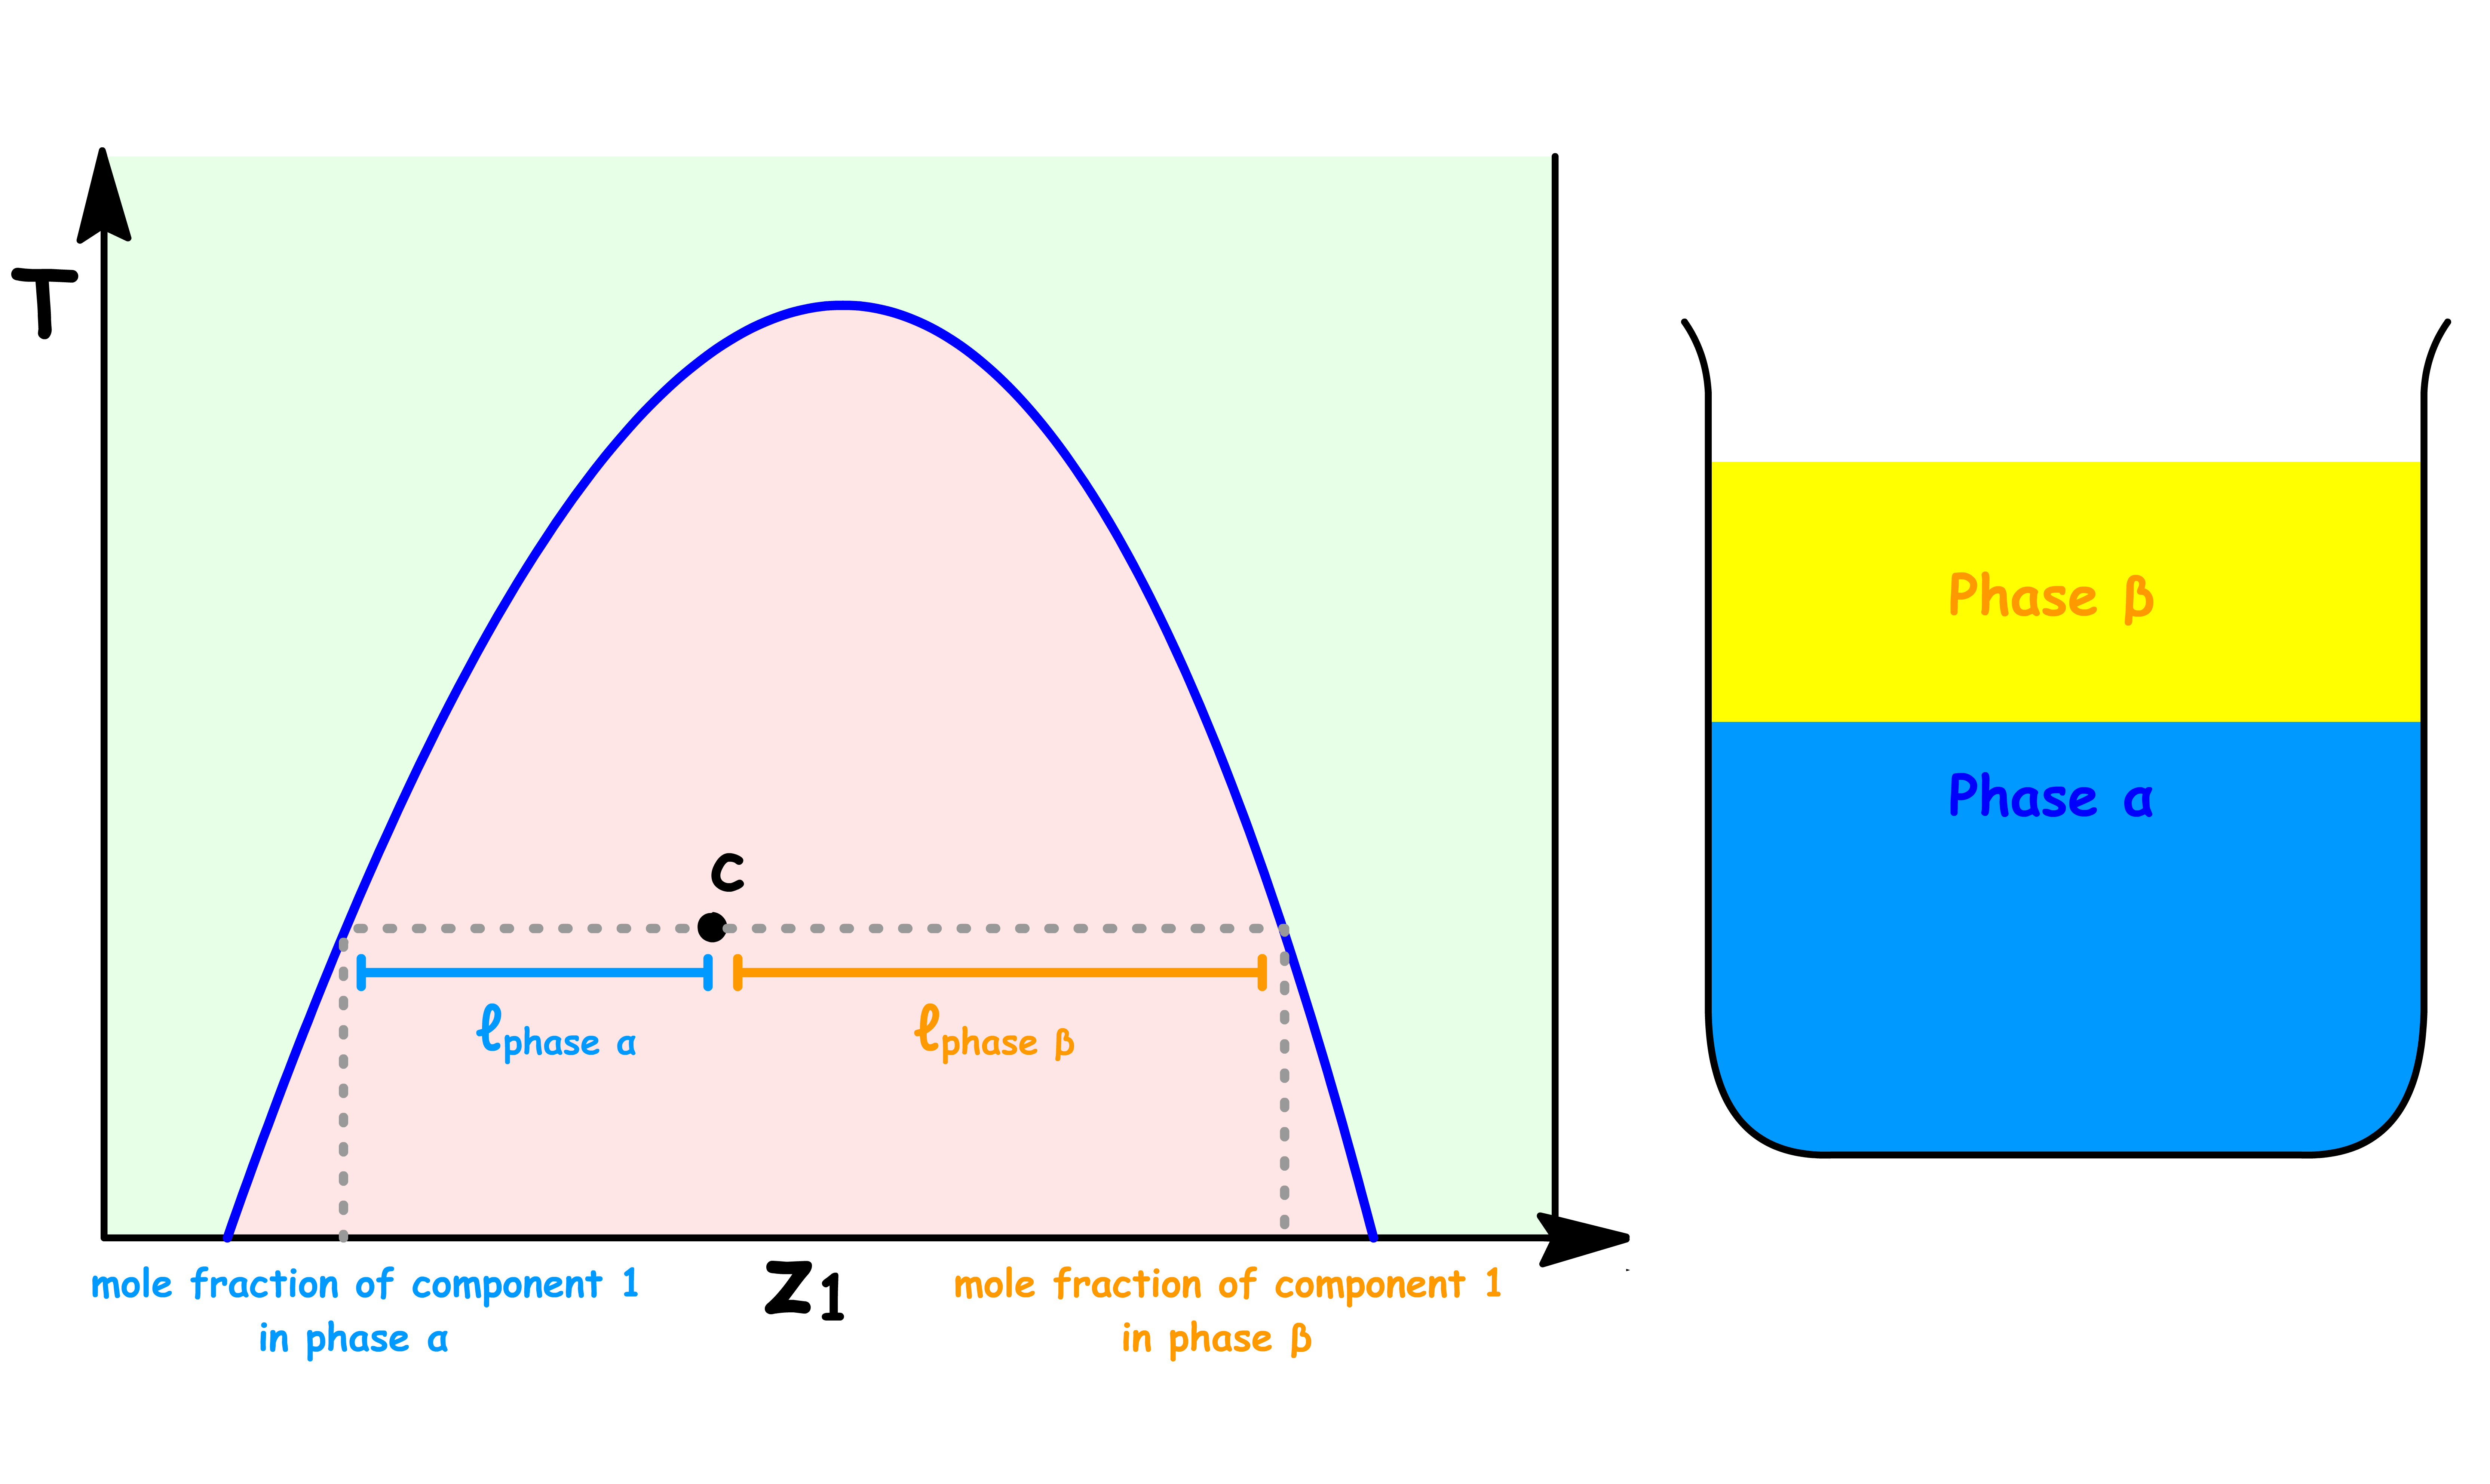
Point c
- The sample consists of two distinct liquid phase: Phase α and Phase β
- The composition of both phases are the same as before, they are both saturated with the other component
- The relative abundance of each phase can be determined using the lever rule
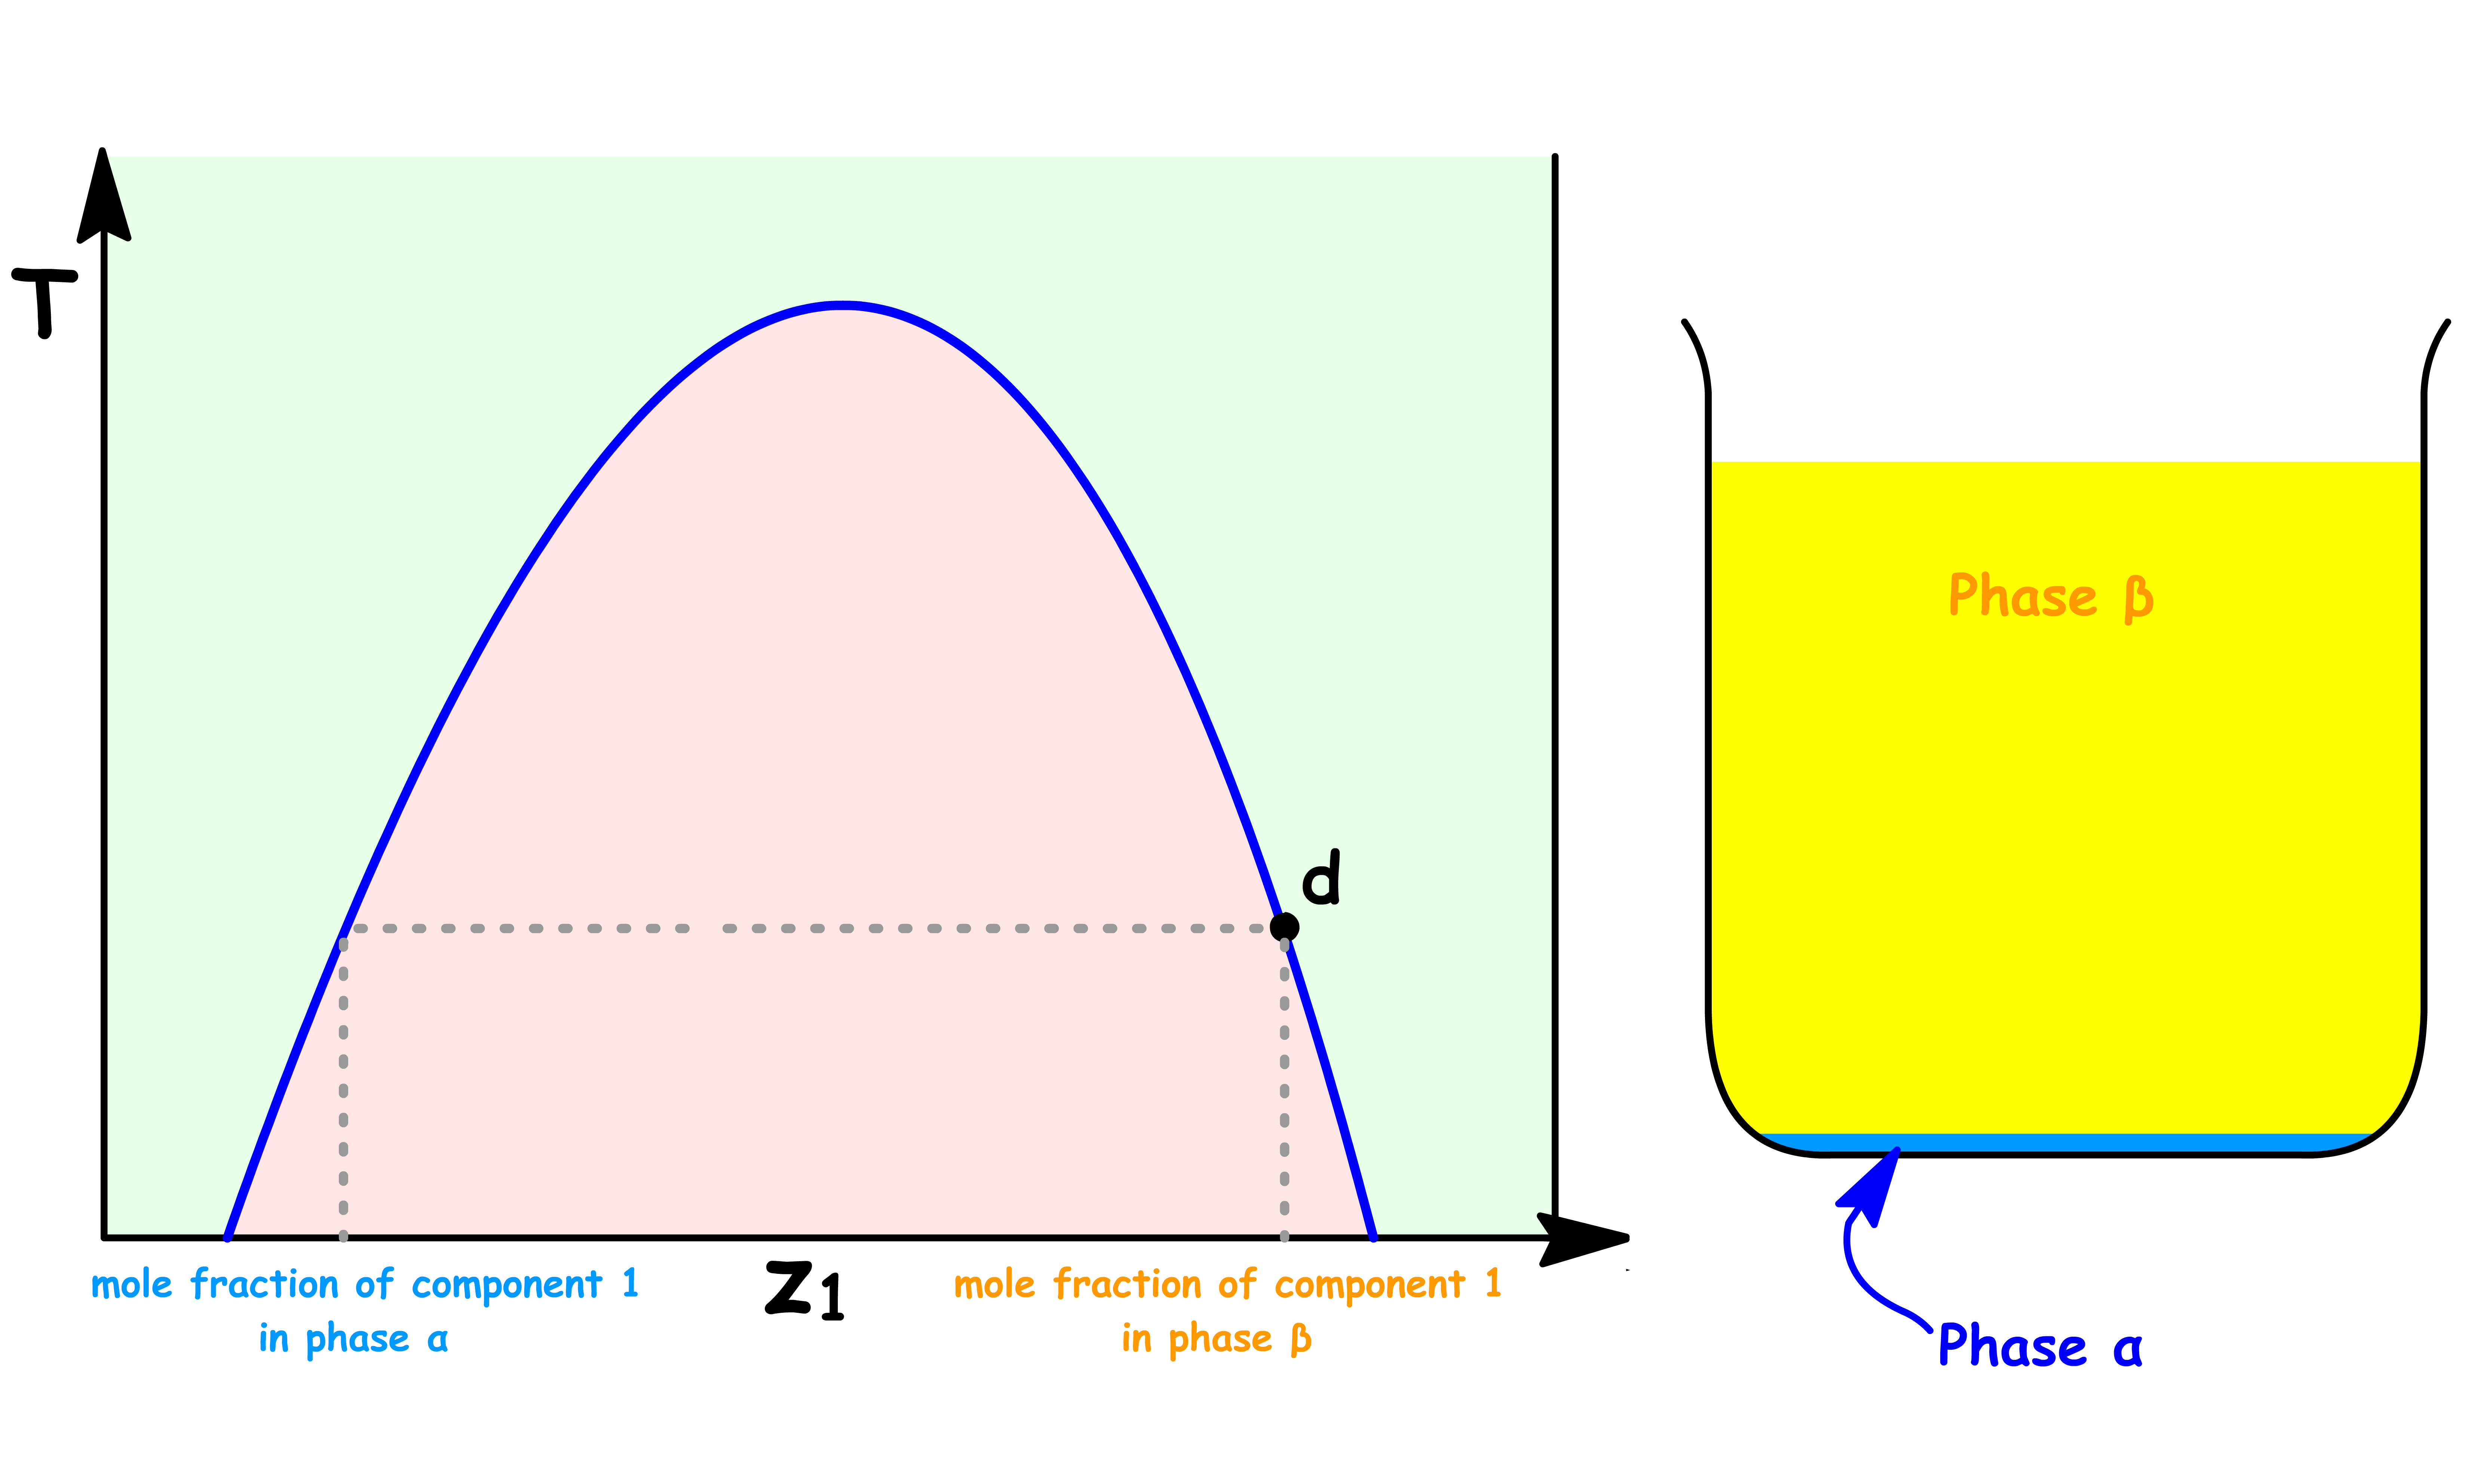
Point d
- The sample consists of two distinct liquid phase: Phase α and Phase β
- At this point, the volume of Phase α is zero
Point e
- At point e, the sample consists of a single liquid phase
- A small amount of component 2 is dissolved in liquid 1
¶ Miscibility Vary with Temperature
Let us consider a situation where we change the temperature of the system while keeping the total mole fraction constant
In general, raising the temperature increases the miscibility of the liquid
- This is because the only reason why two liquids refuse to mix is because the is positive and has a larger magnitude than the
- By raising the temperature, we can make the term more negative so that it can overpower the term
This is shown in the liquid-liquid phase diagram
- Raising the temperature increases the miscibility. In other words, it takes more of the other component to saturate each liquid
- Hence, the two-phase region becomes narrower because each phase is richer in its minor component
¶ Critical Solution Temperature
There are two types of Critical Solution Temperature:
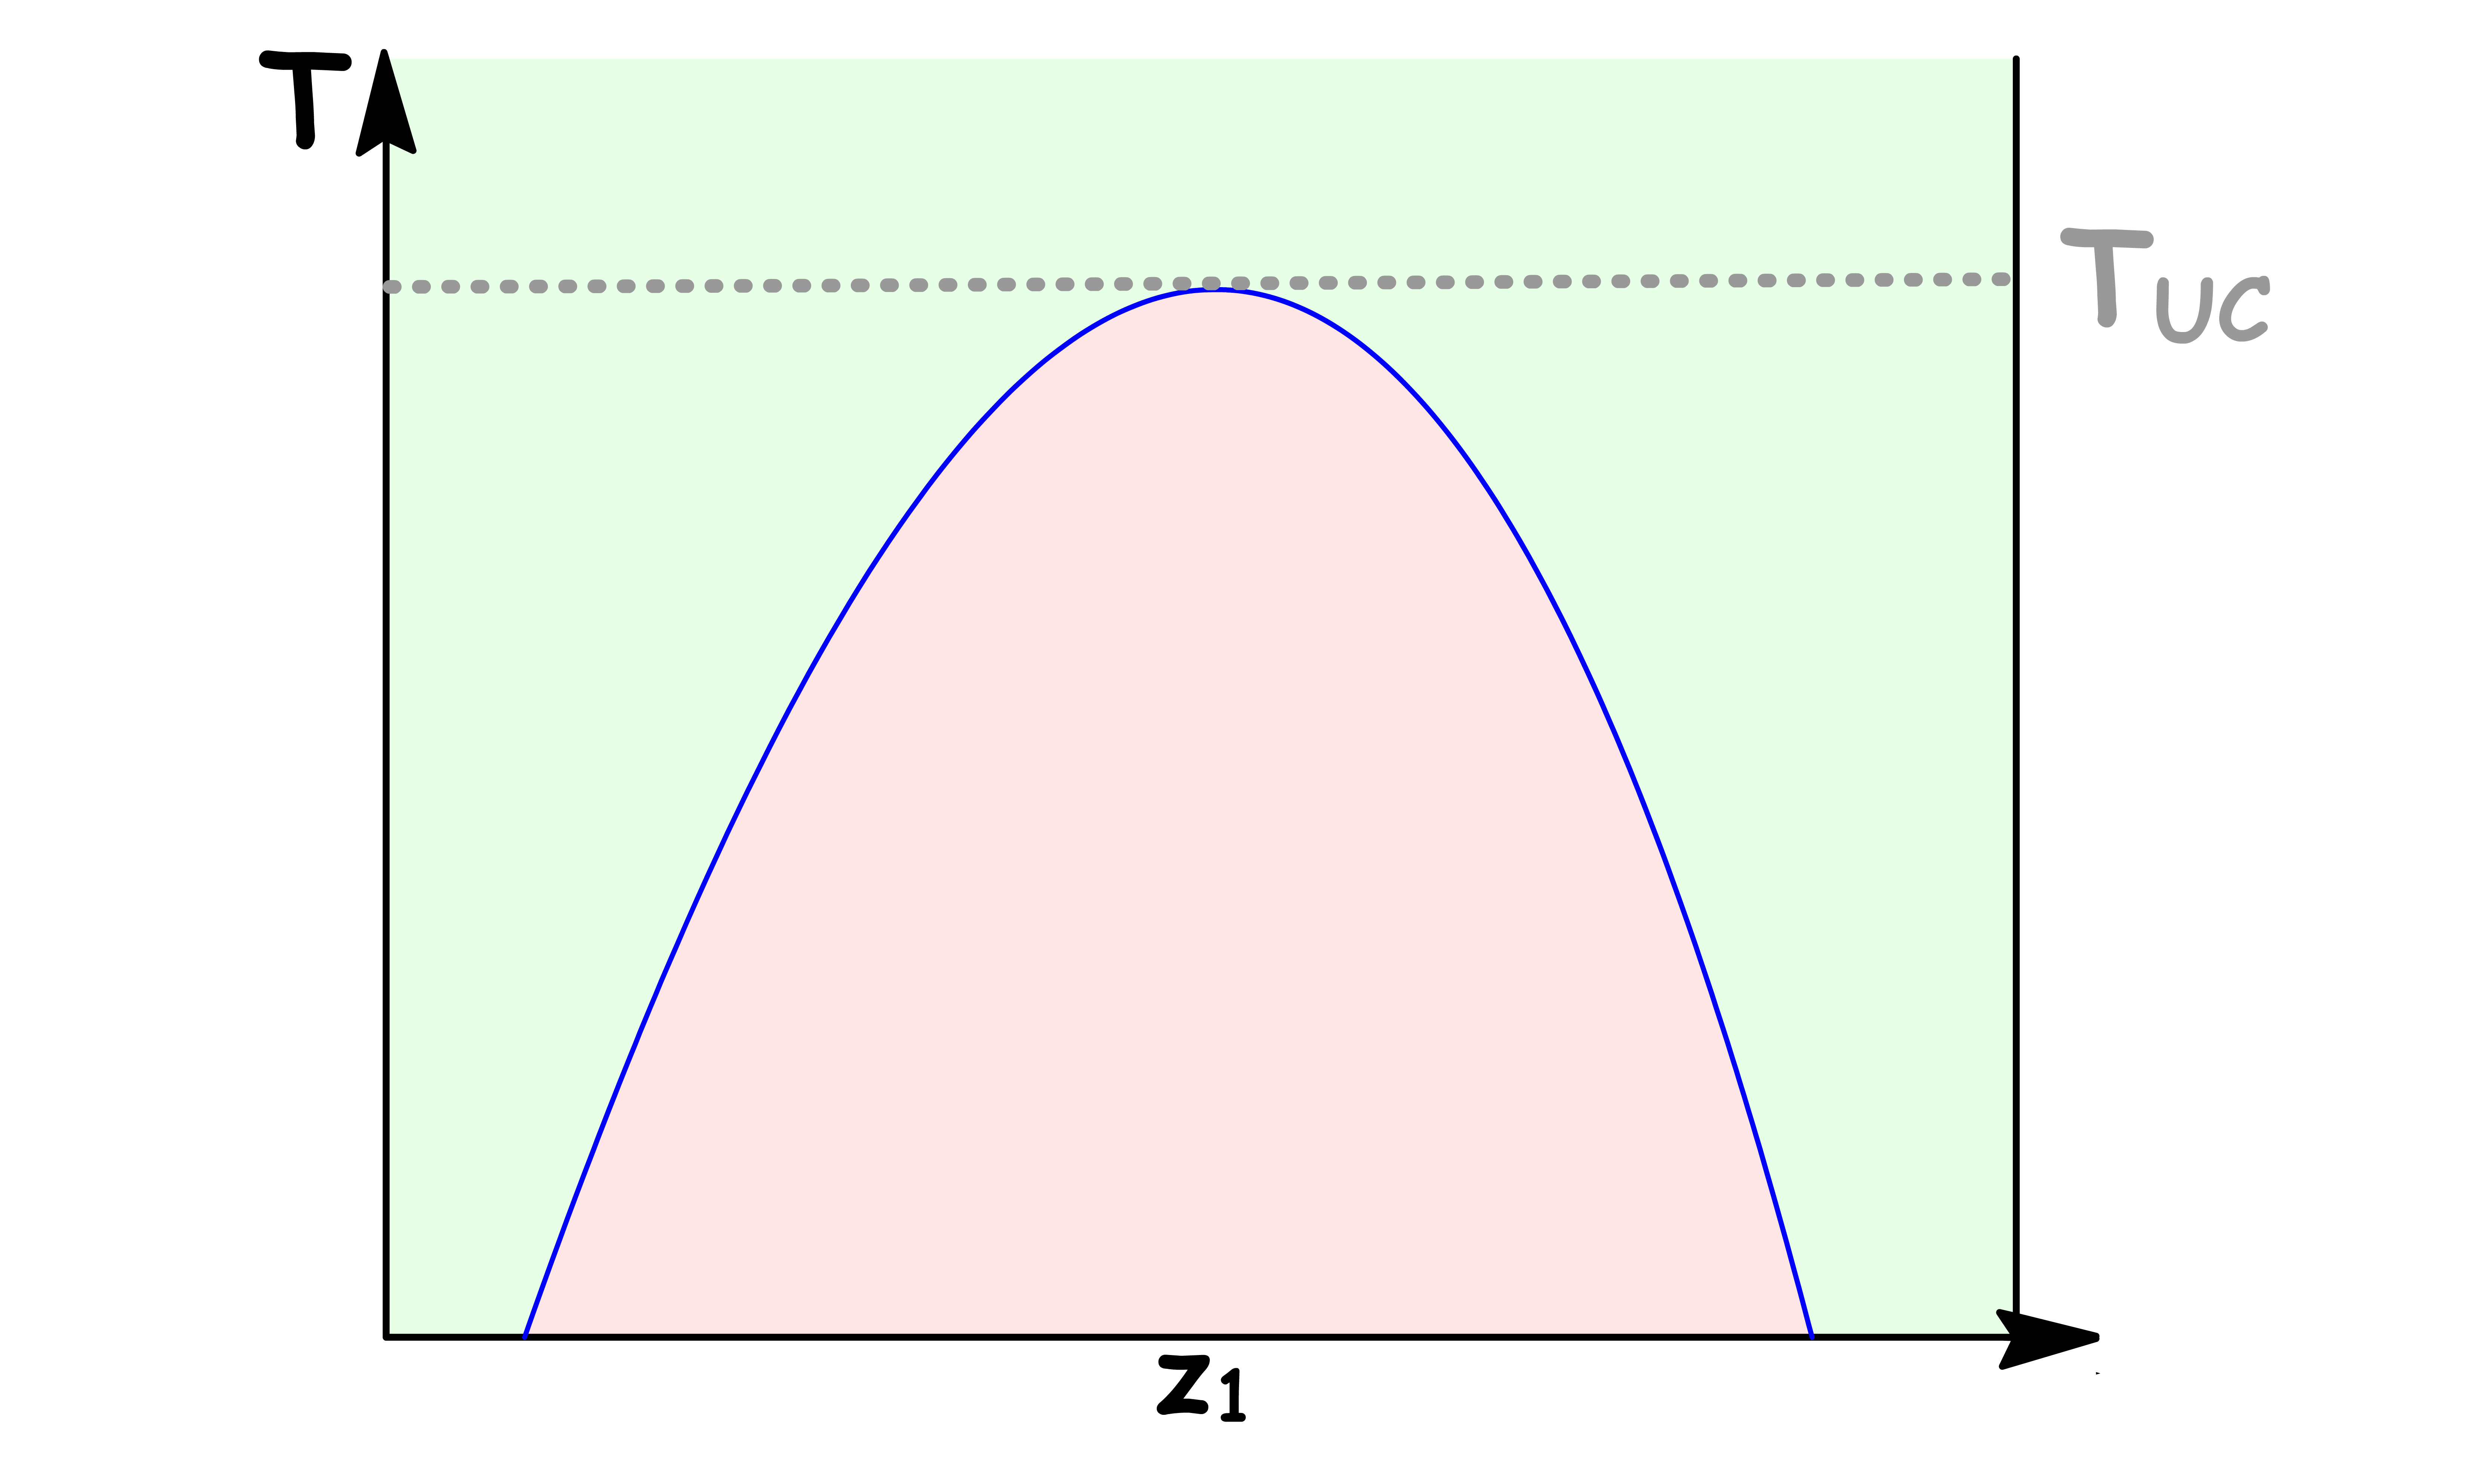
- Upper Critical Solution Temperature ( UCST )
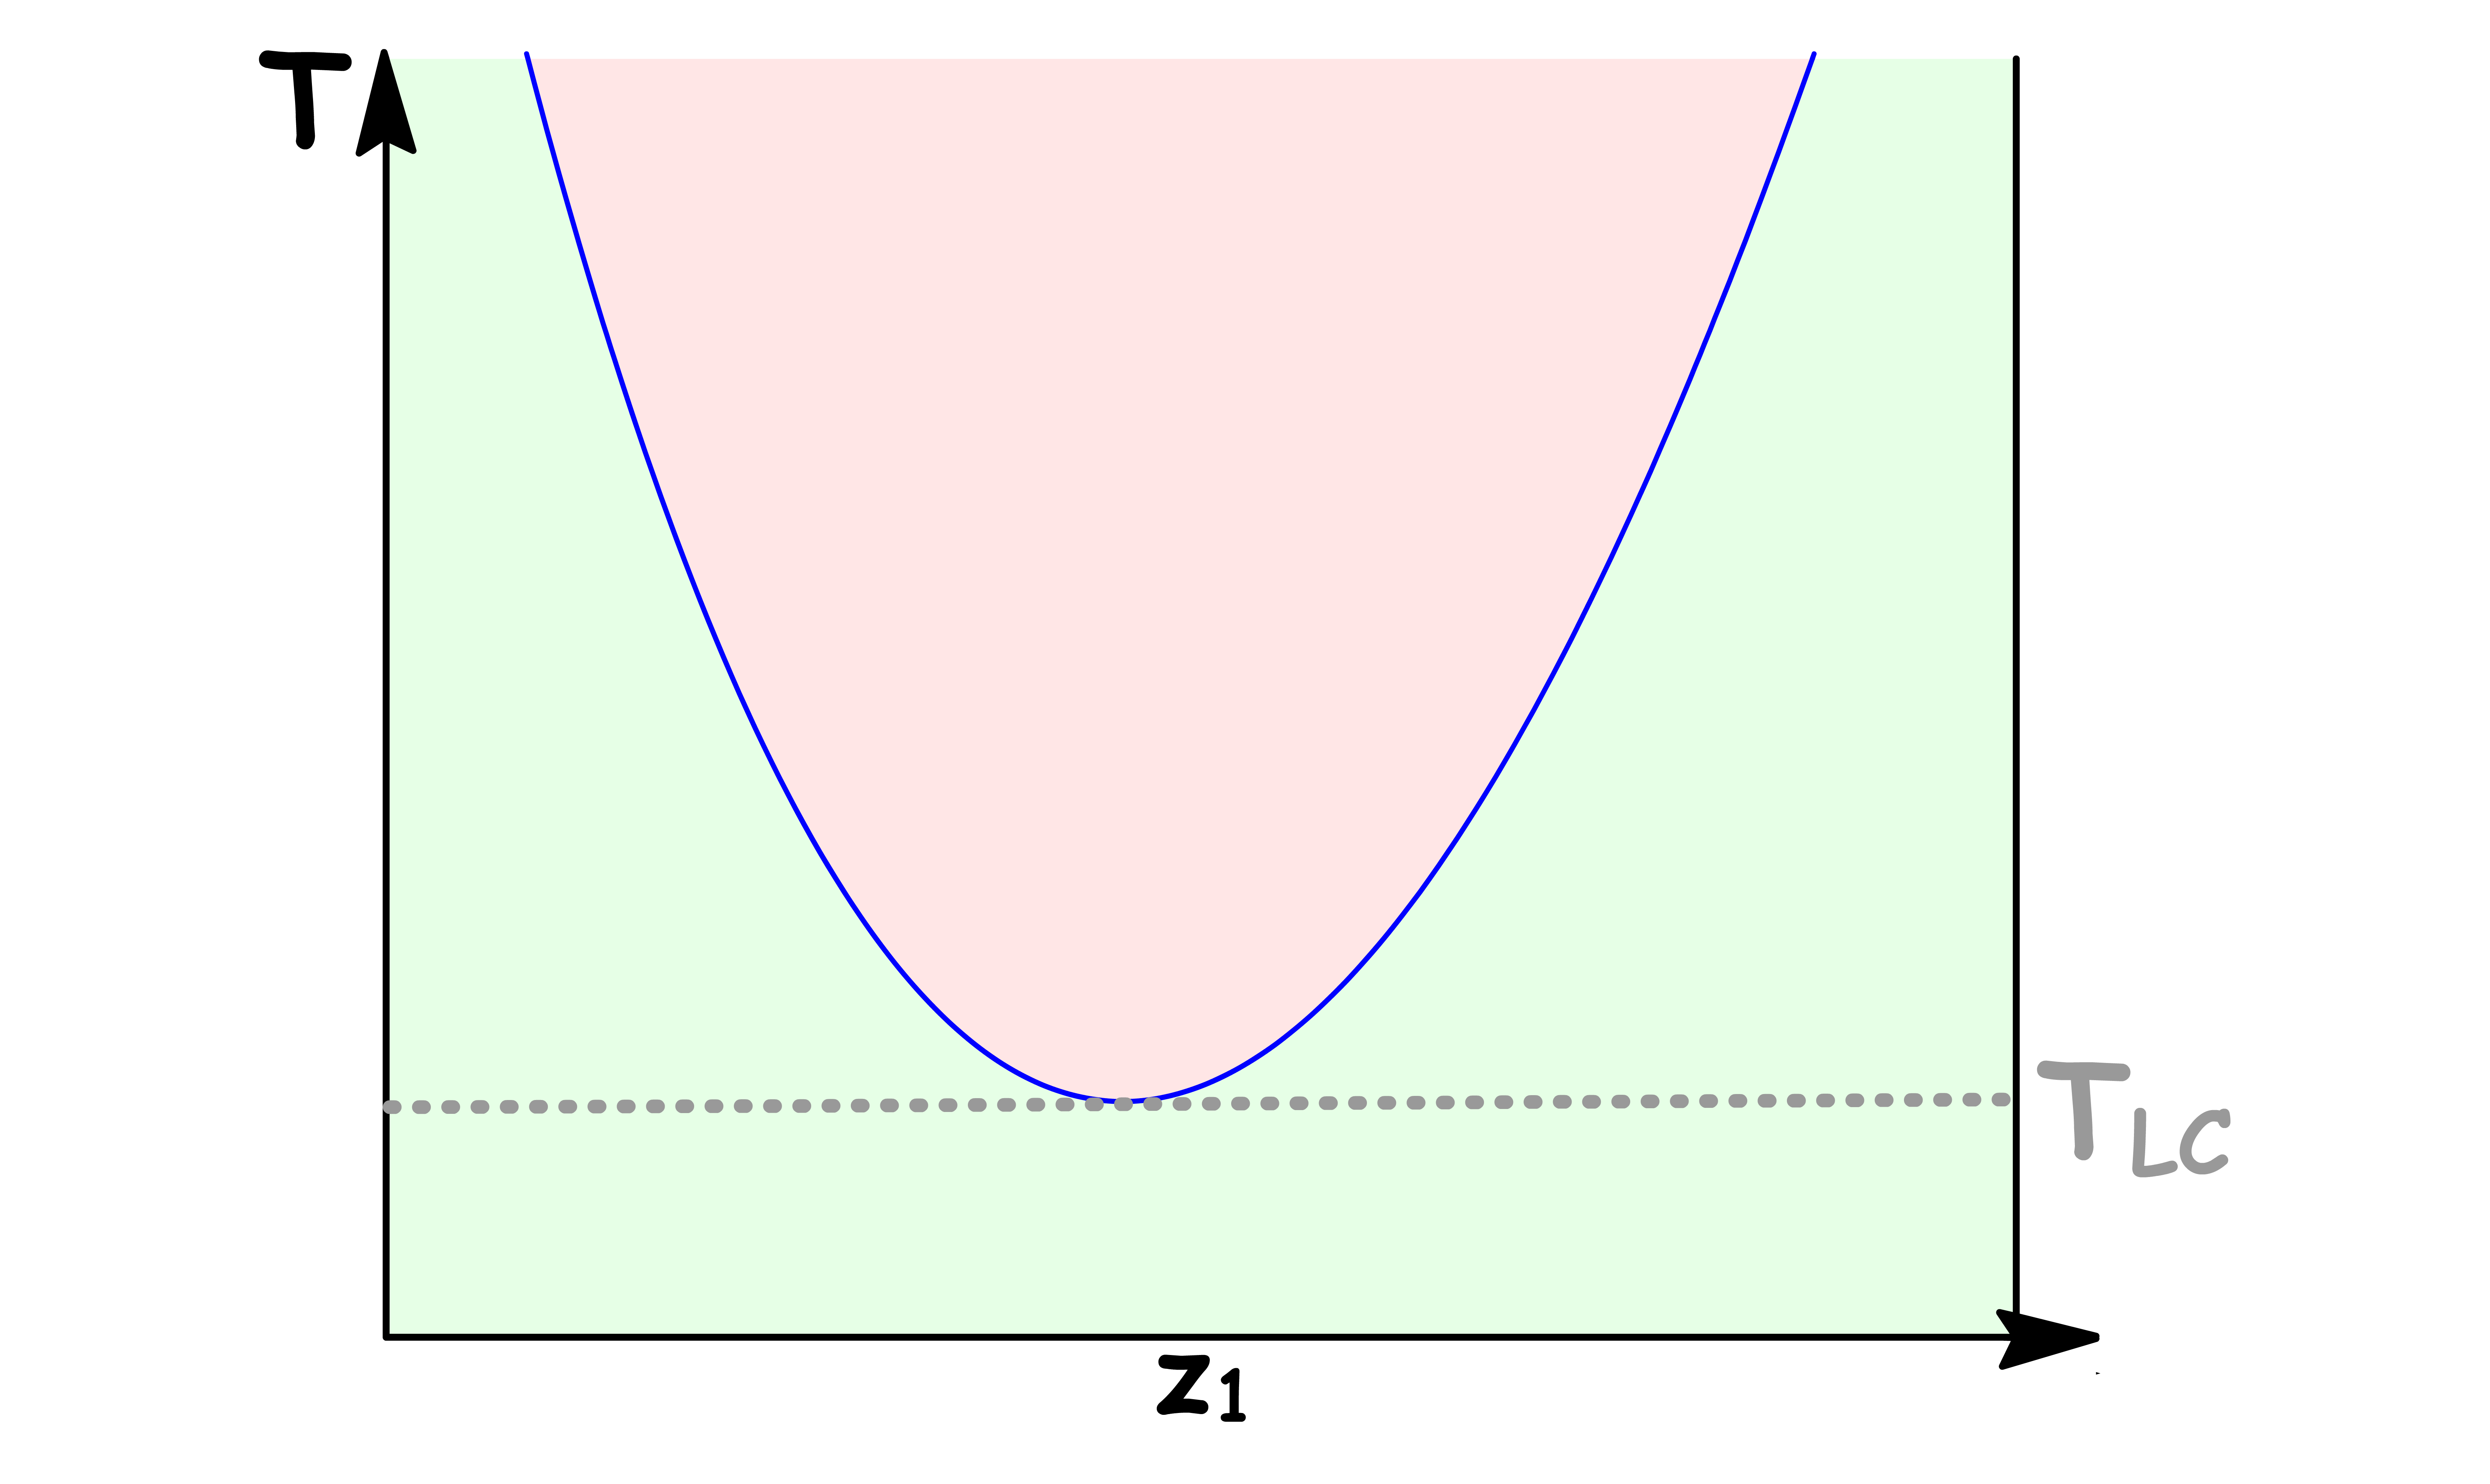
- Lower Critical Solution Temperature ( LCST )
Upper Critical Solution Temperature
The Upper Critical Solution Temperature is the highest temperature at which phase separation occurs
- Above this temperature, the mixture becomes completely miscible
- This temperature exists becuase the thermal motion overcomes any potential energy advantage in molecules of one type being closer to each other
- At the maximum of the binodial curve, the composition of the two phases are identical, thus yielding a one-phase system
Lower Critical Solution Temperature
The Lower Critical Solution Temperature is the lowest temperature at which phase separation occurs
- Below this temperature, the mixture becomes completely miscible
- It is quite rare for systems to show a Lower Critical Solution Temperature
- One reason for its appearance is that the molecules of the two species can form weak complexes at low temperature, making them miscible. At higher temperature, said complex break up and the liquids become less miscible
- At the minimum of the binodial curve, the composition of the two phases are identical, thus yielding a one-phase system
Miscibility Gap
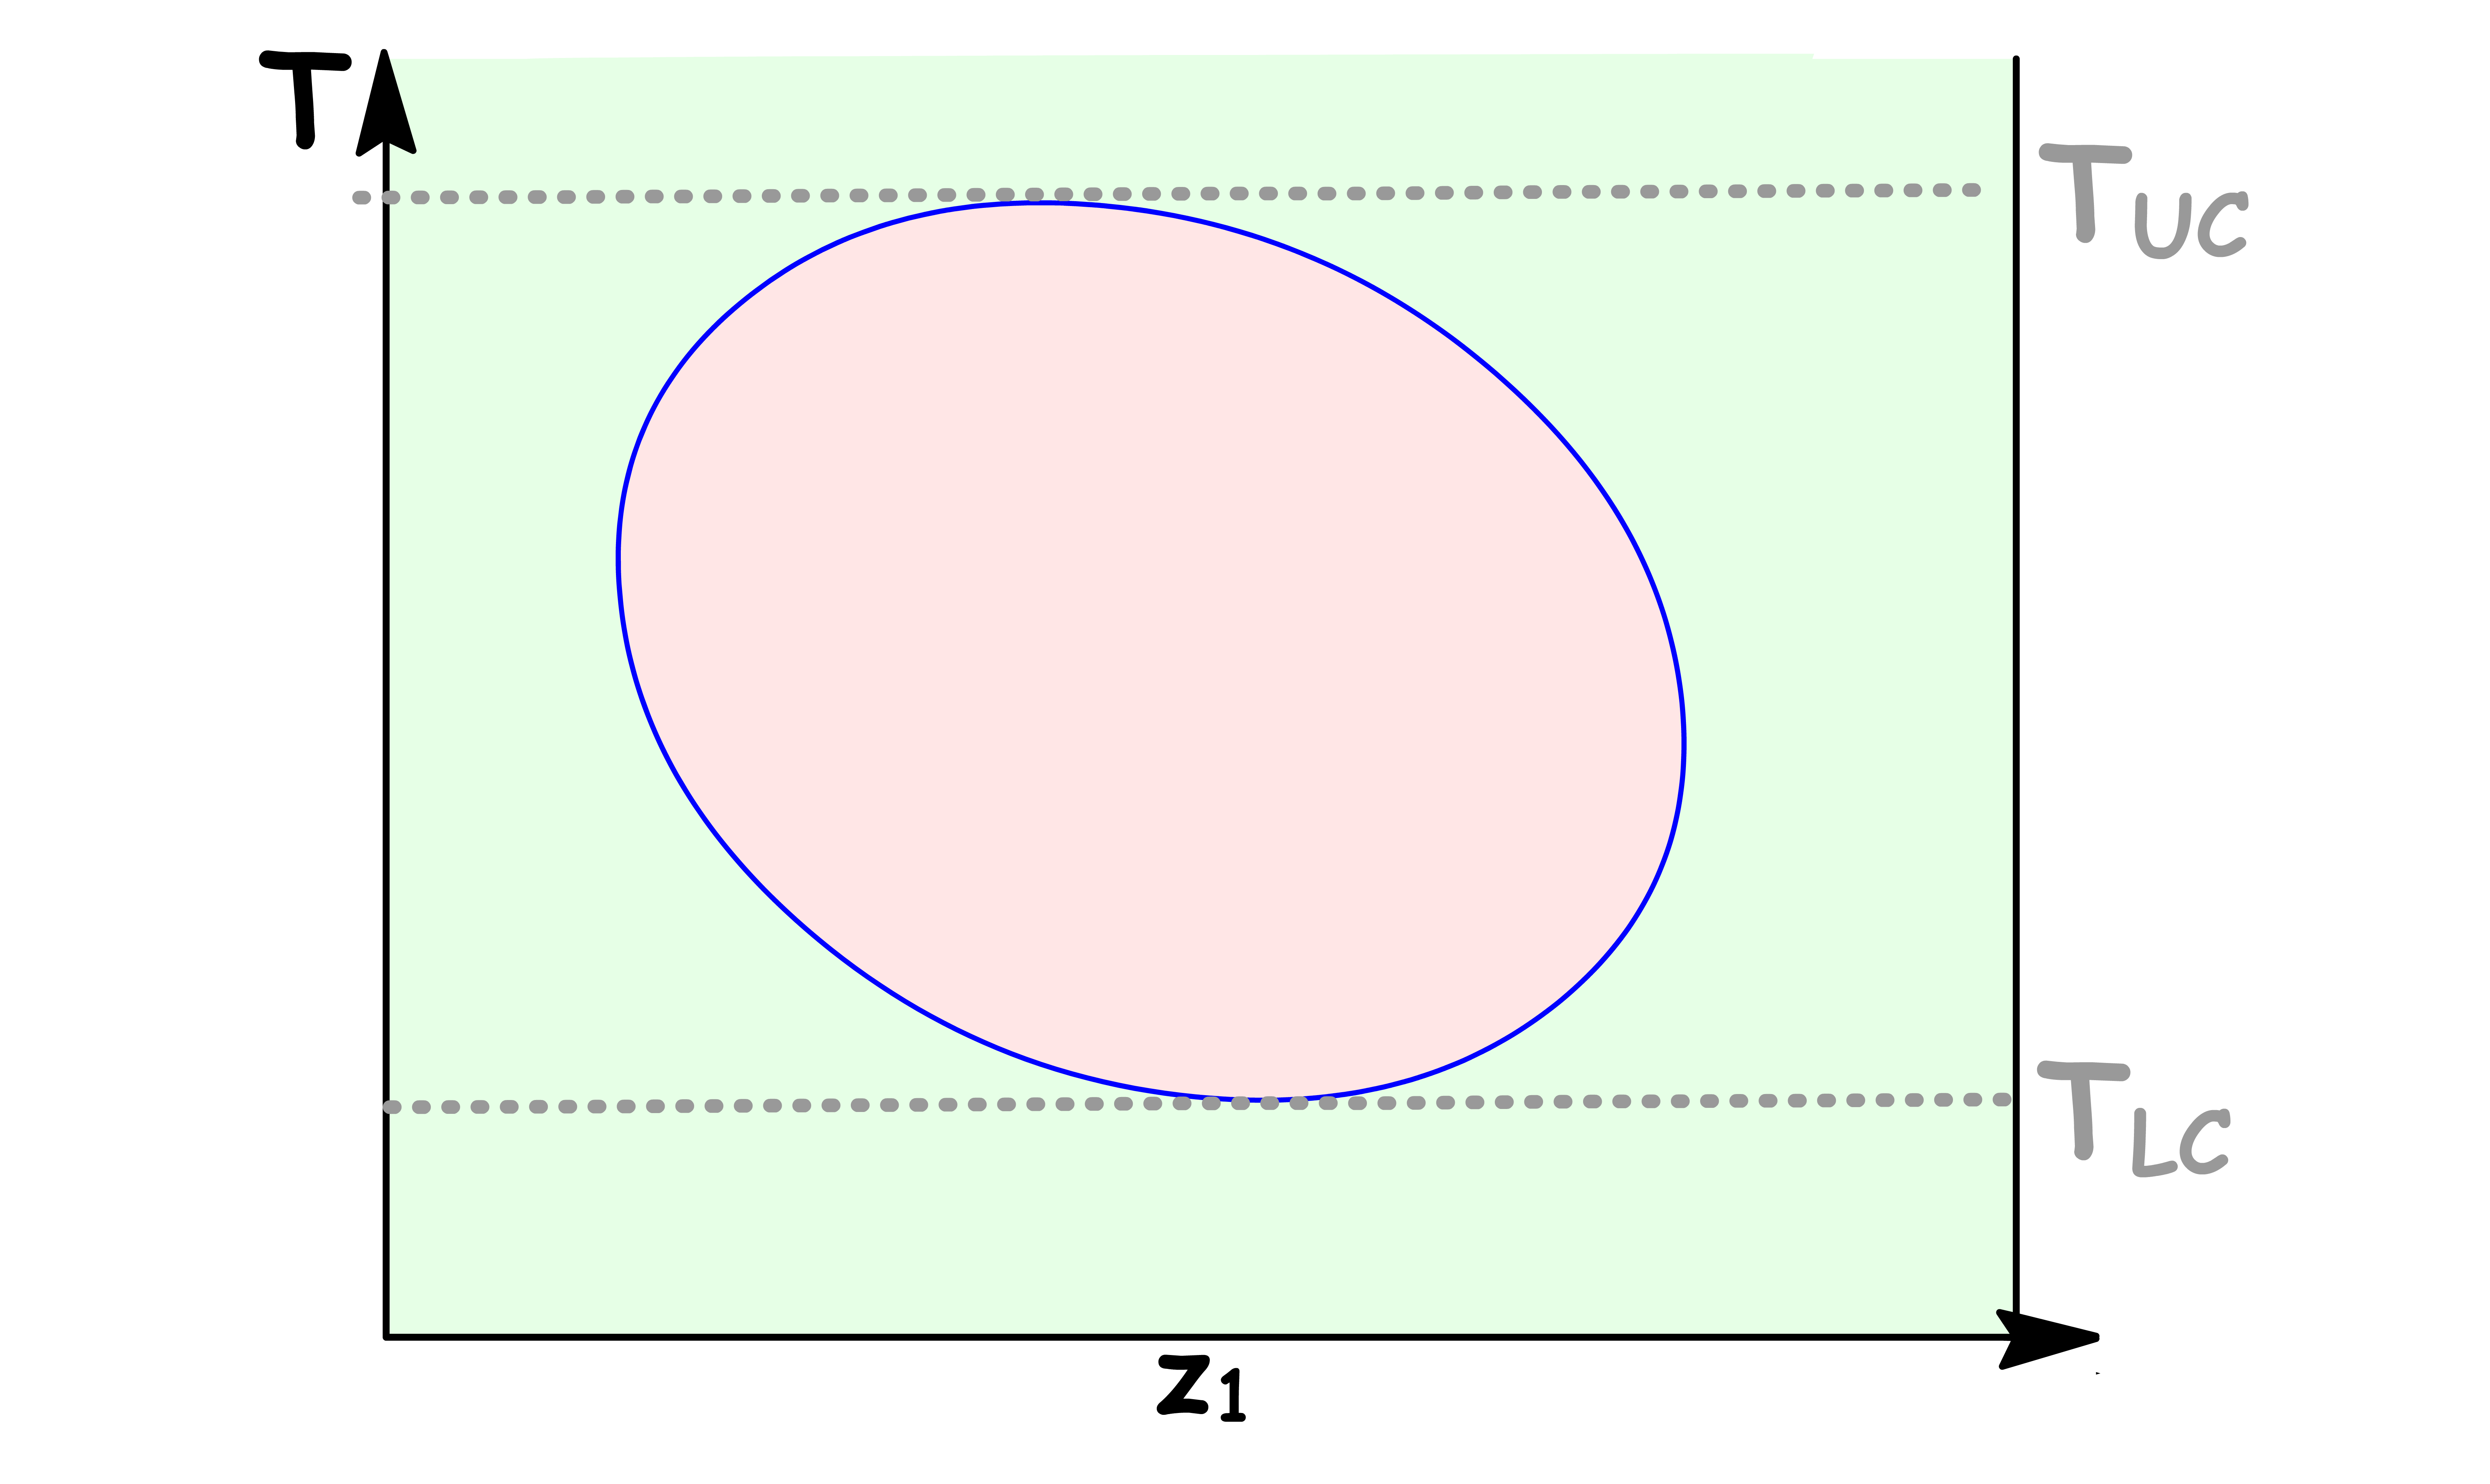
- Some systems have both upper and lower critical temperature
- They occur because after the weak complexes have been disrupted, leading to partial miscibility, the thermal agitation at higher temperature homogenizes the mixture again
¶ Distillation of Partially Miscible Liquids
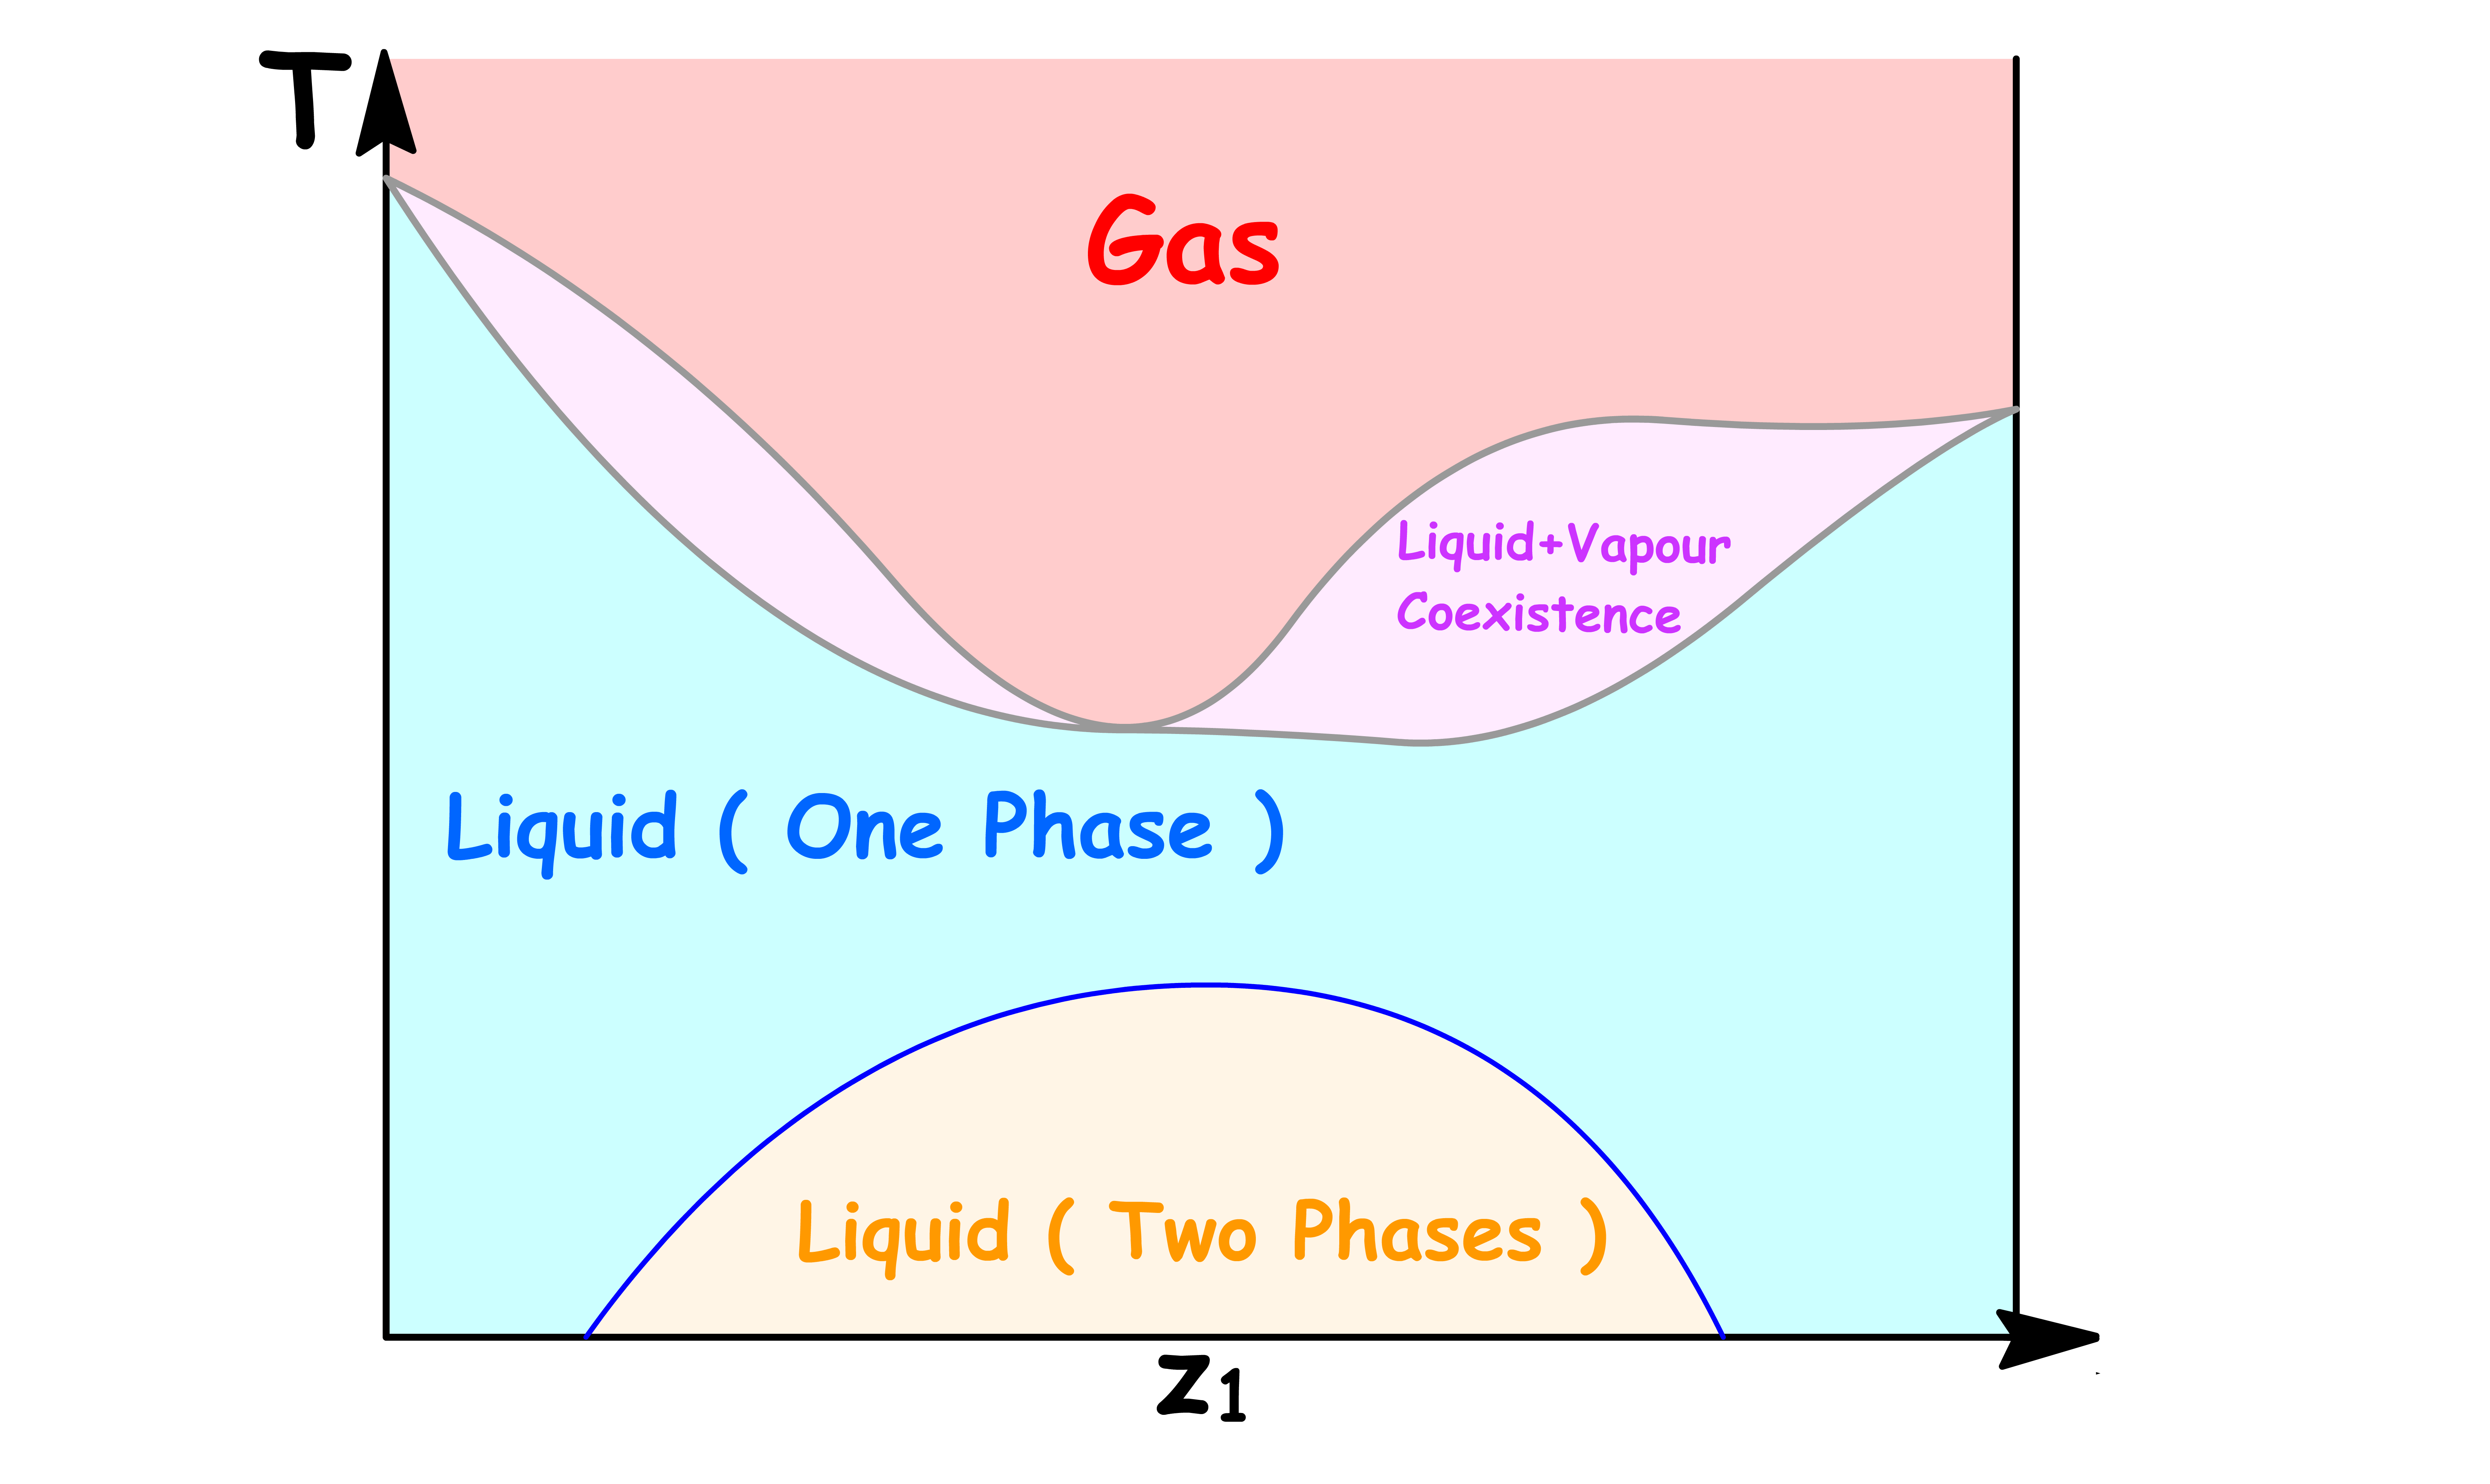
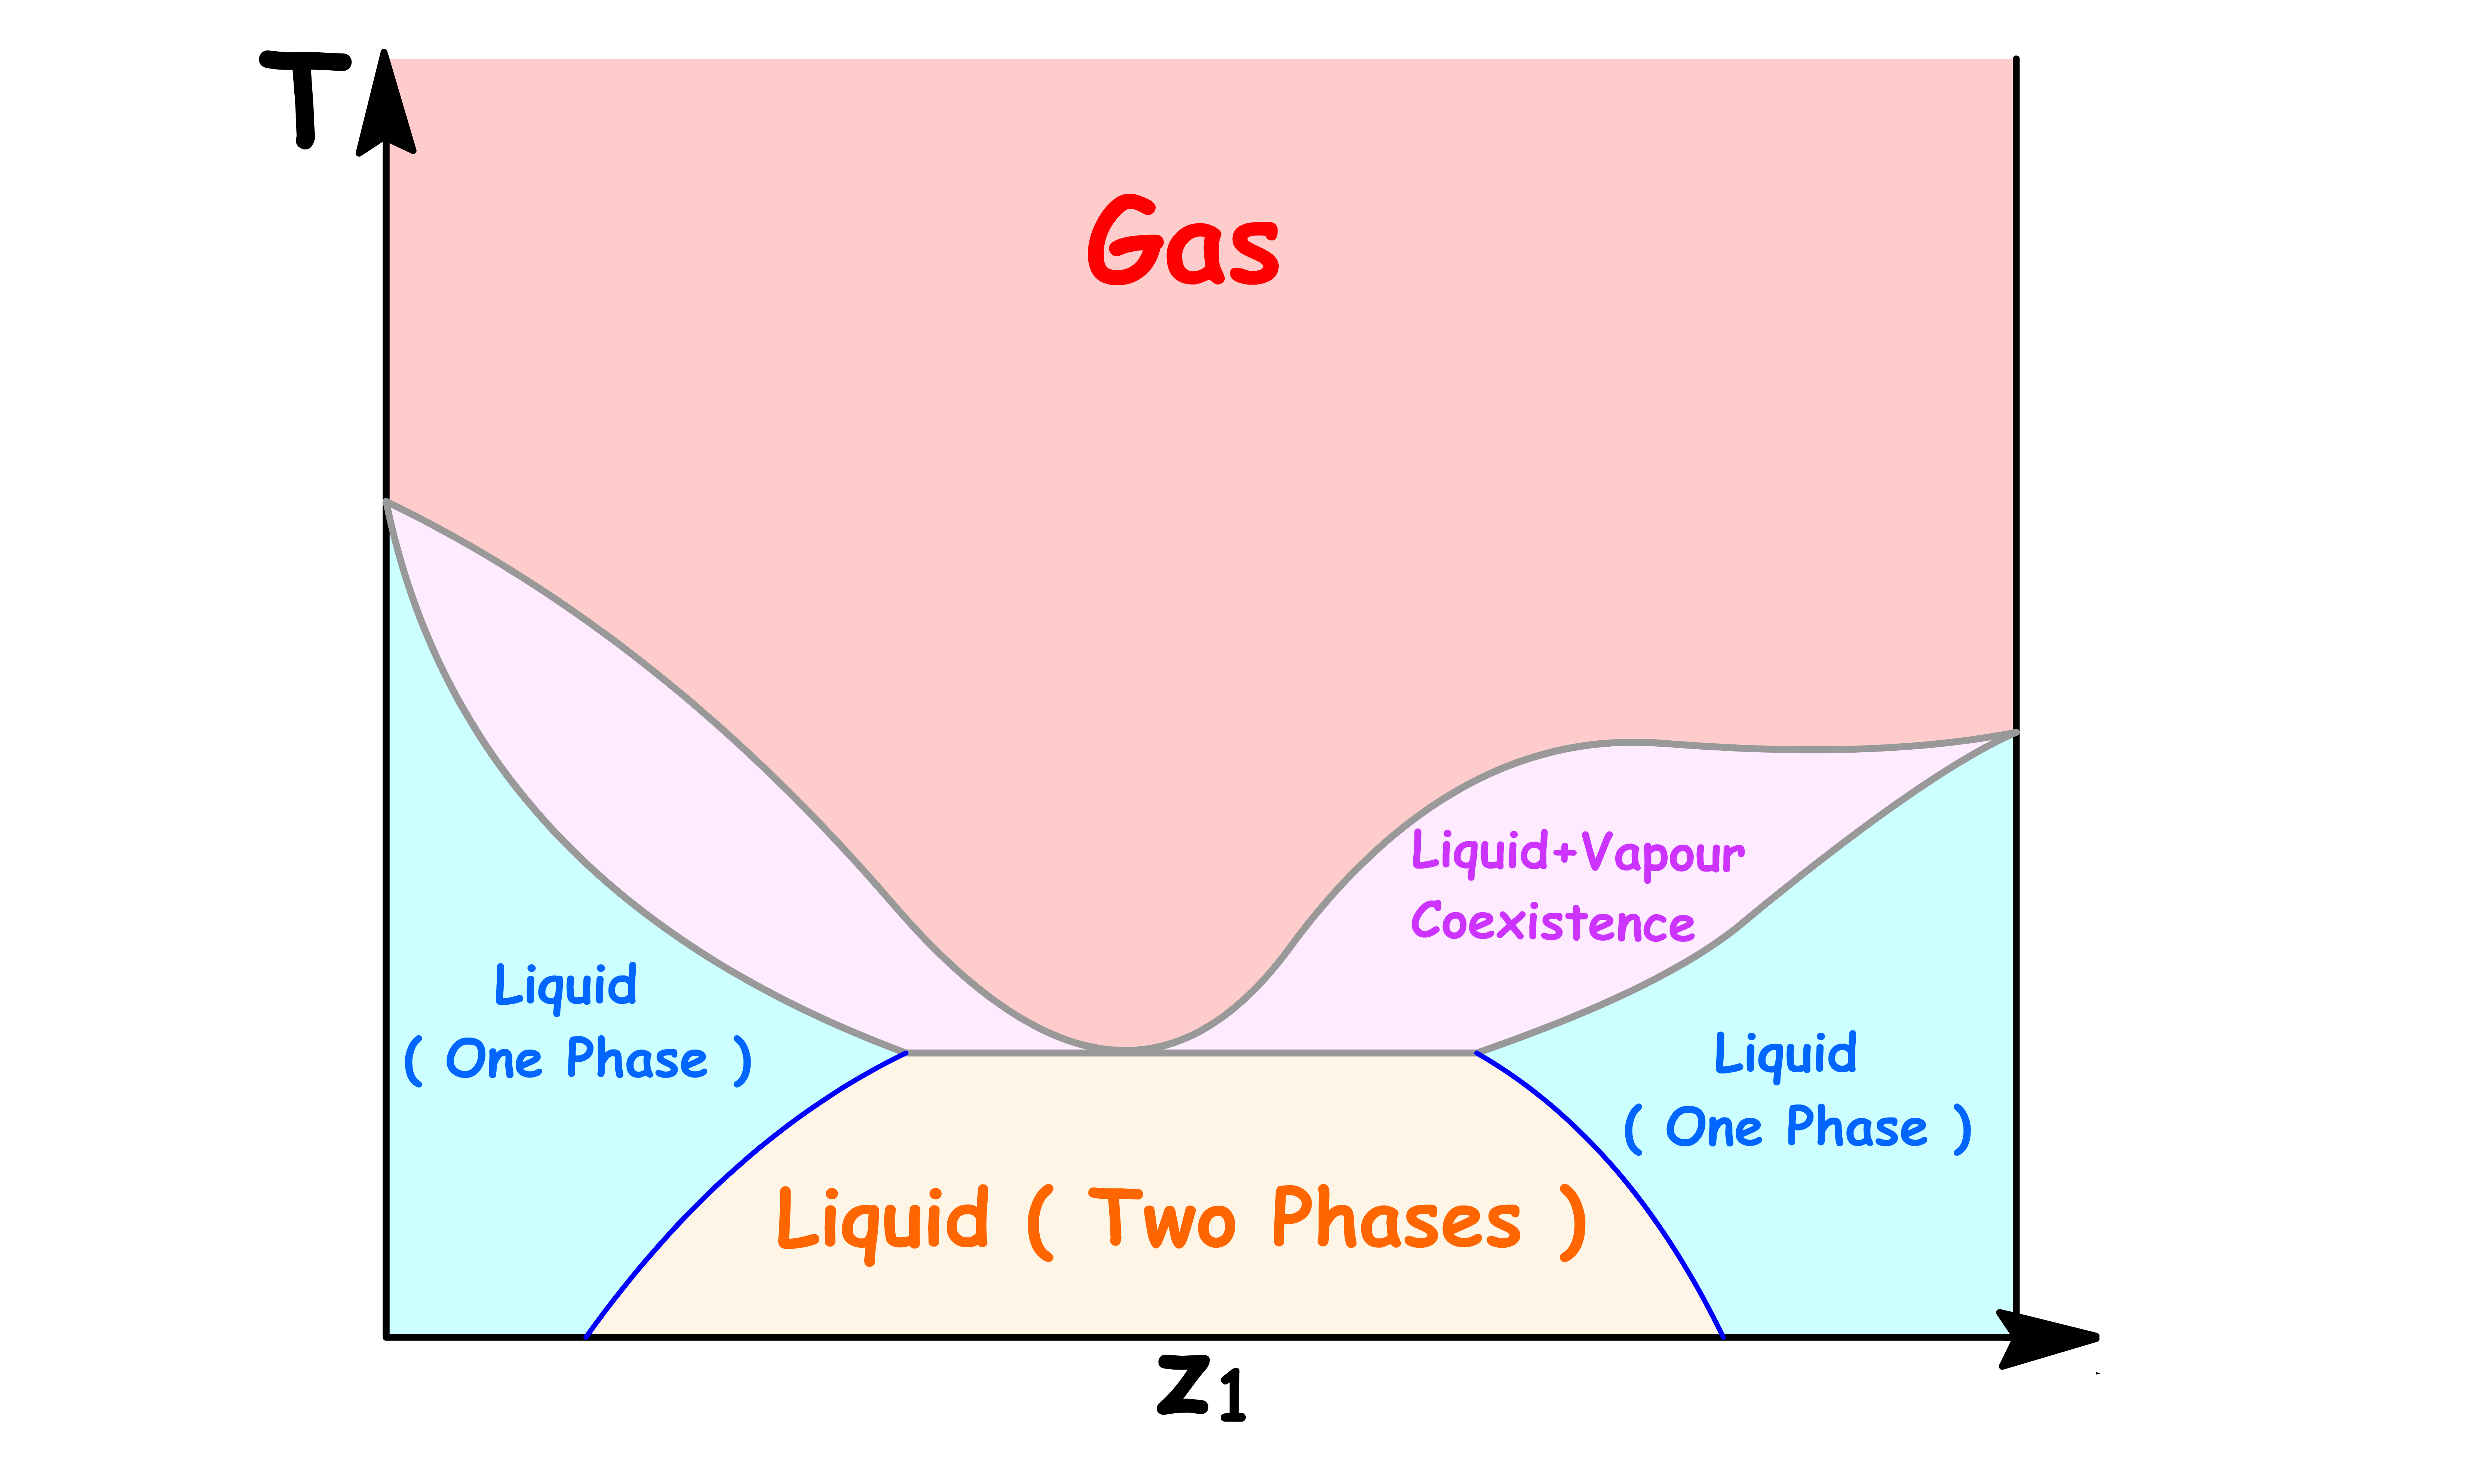
Mixtures that are partially miscible tend to form low-boiling azeotropes
- This is because the origin of both properties is that the intermolecular force between the mixture is much weaker than that of the pure substance
There are two possibilities:
1. The liquids become fully miscible before they boil
- The UCST is below the azeotrope
2. The liquids starts boiling before becoming fully miscible
- The UCST is above the azeotrope
¶ Phase Diagrams of Tenary Systems
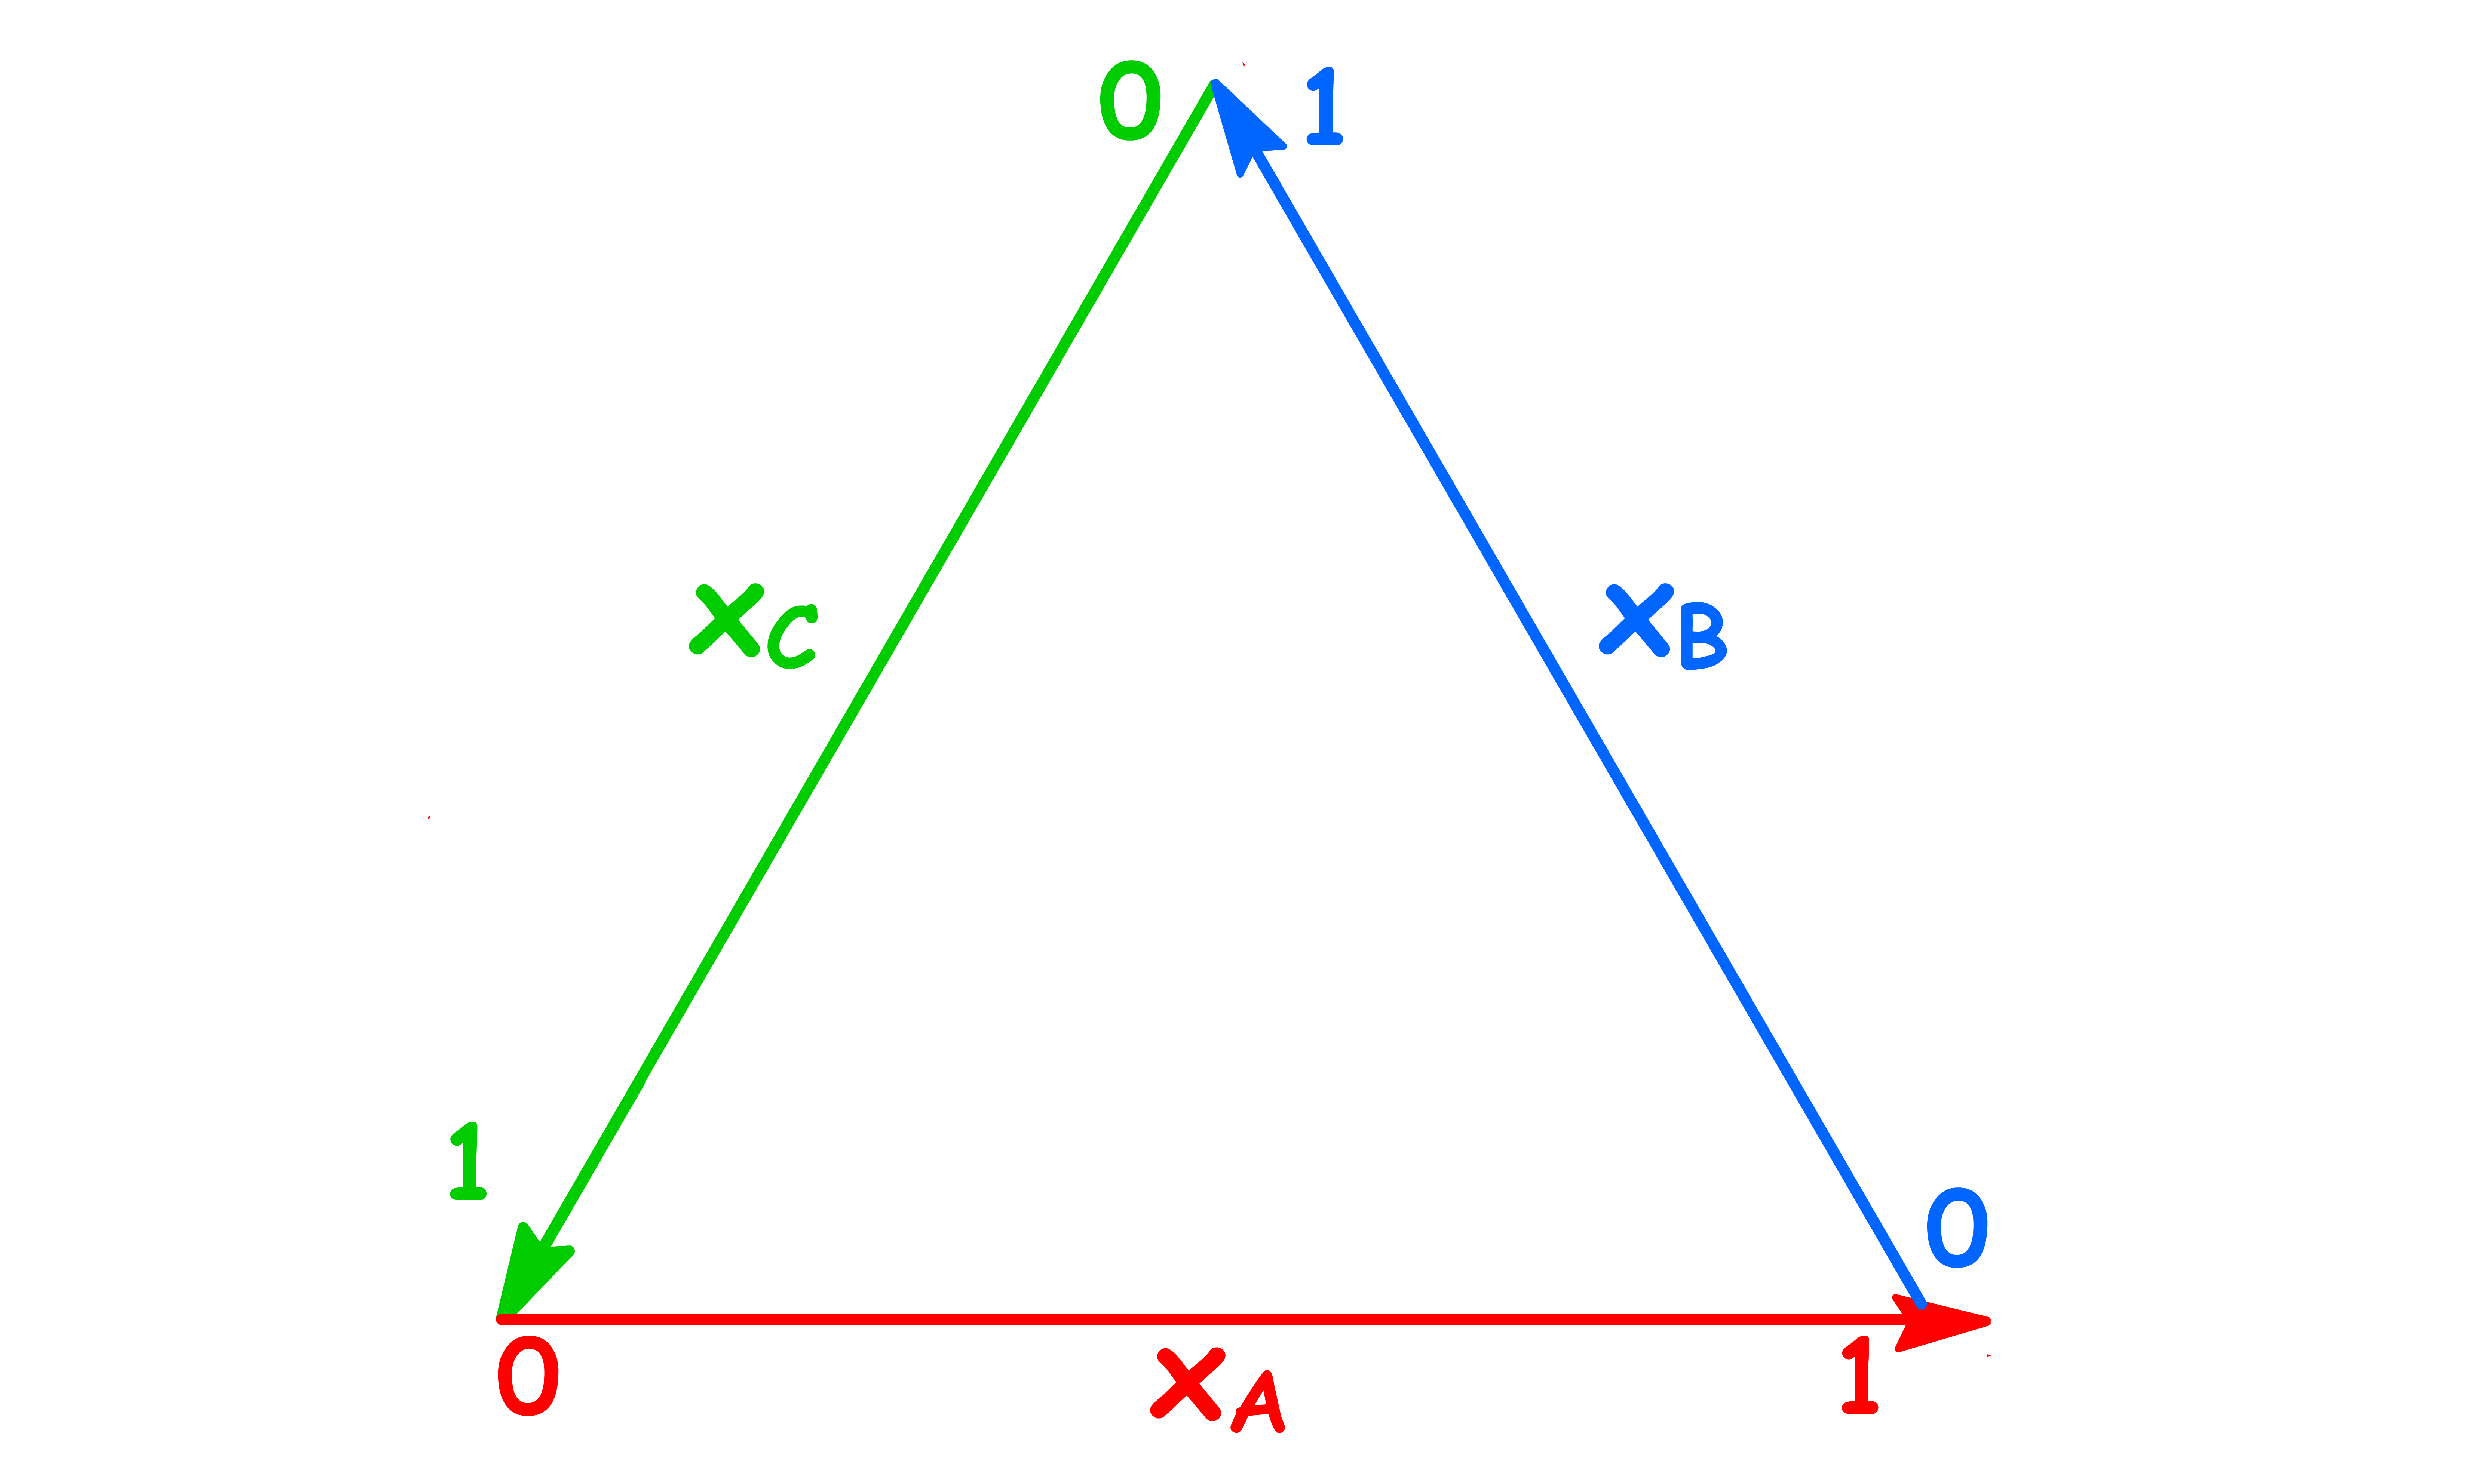
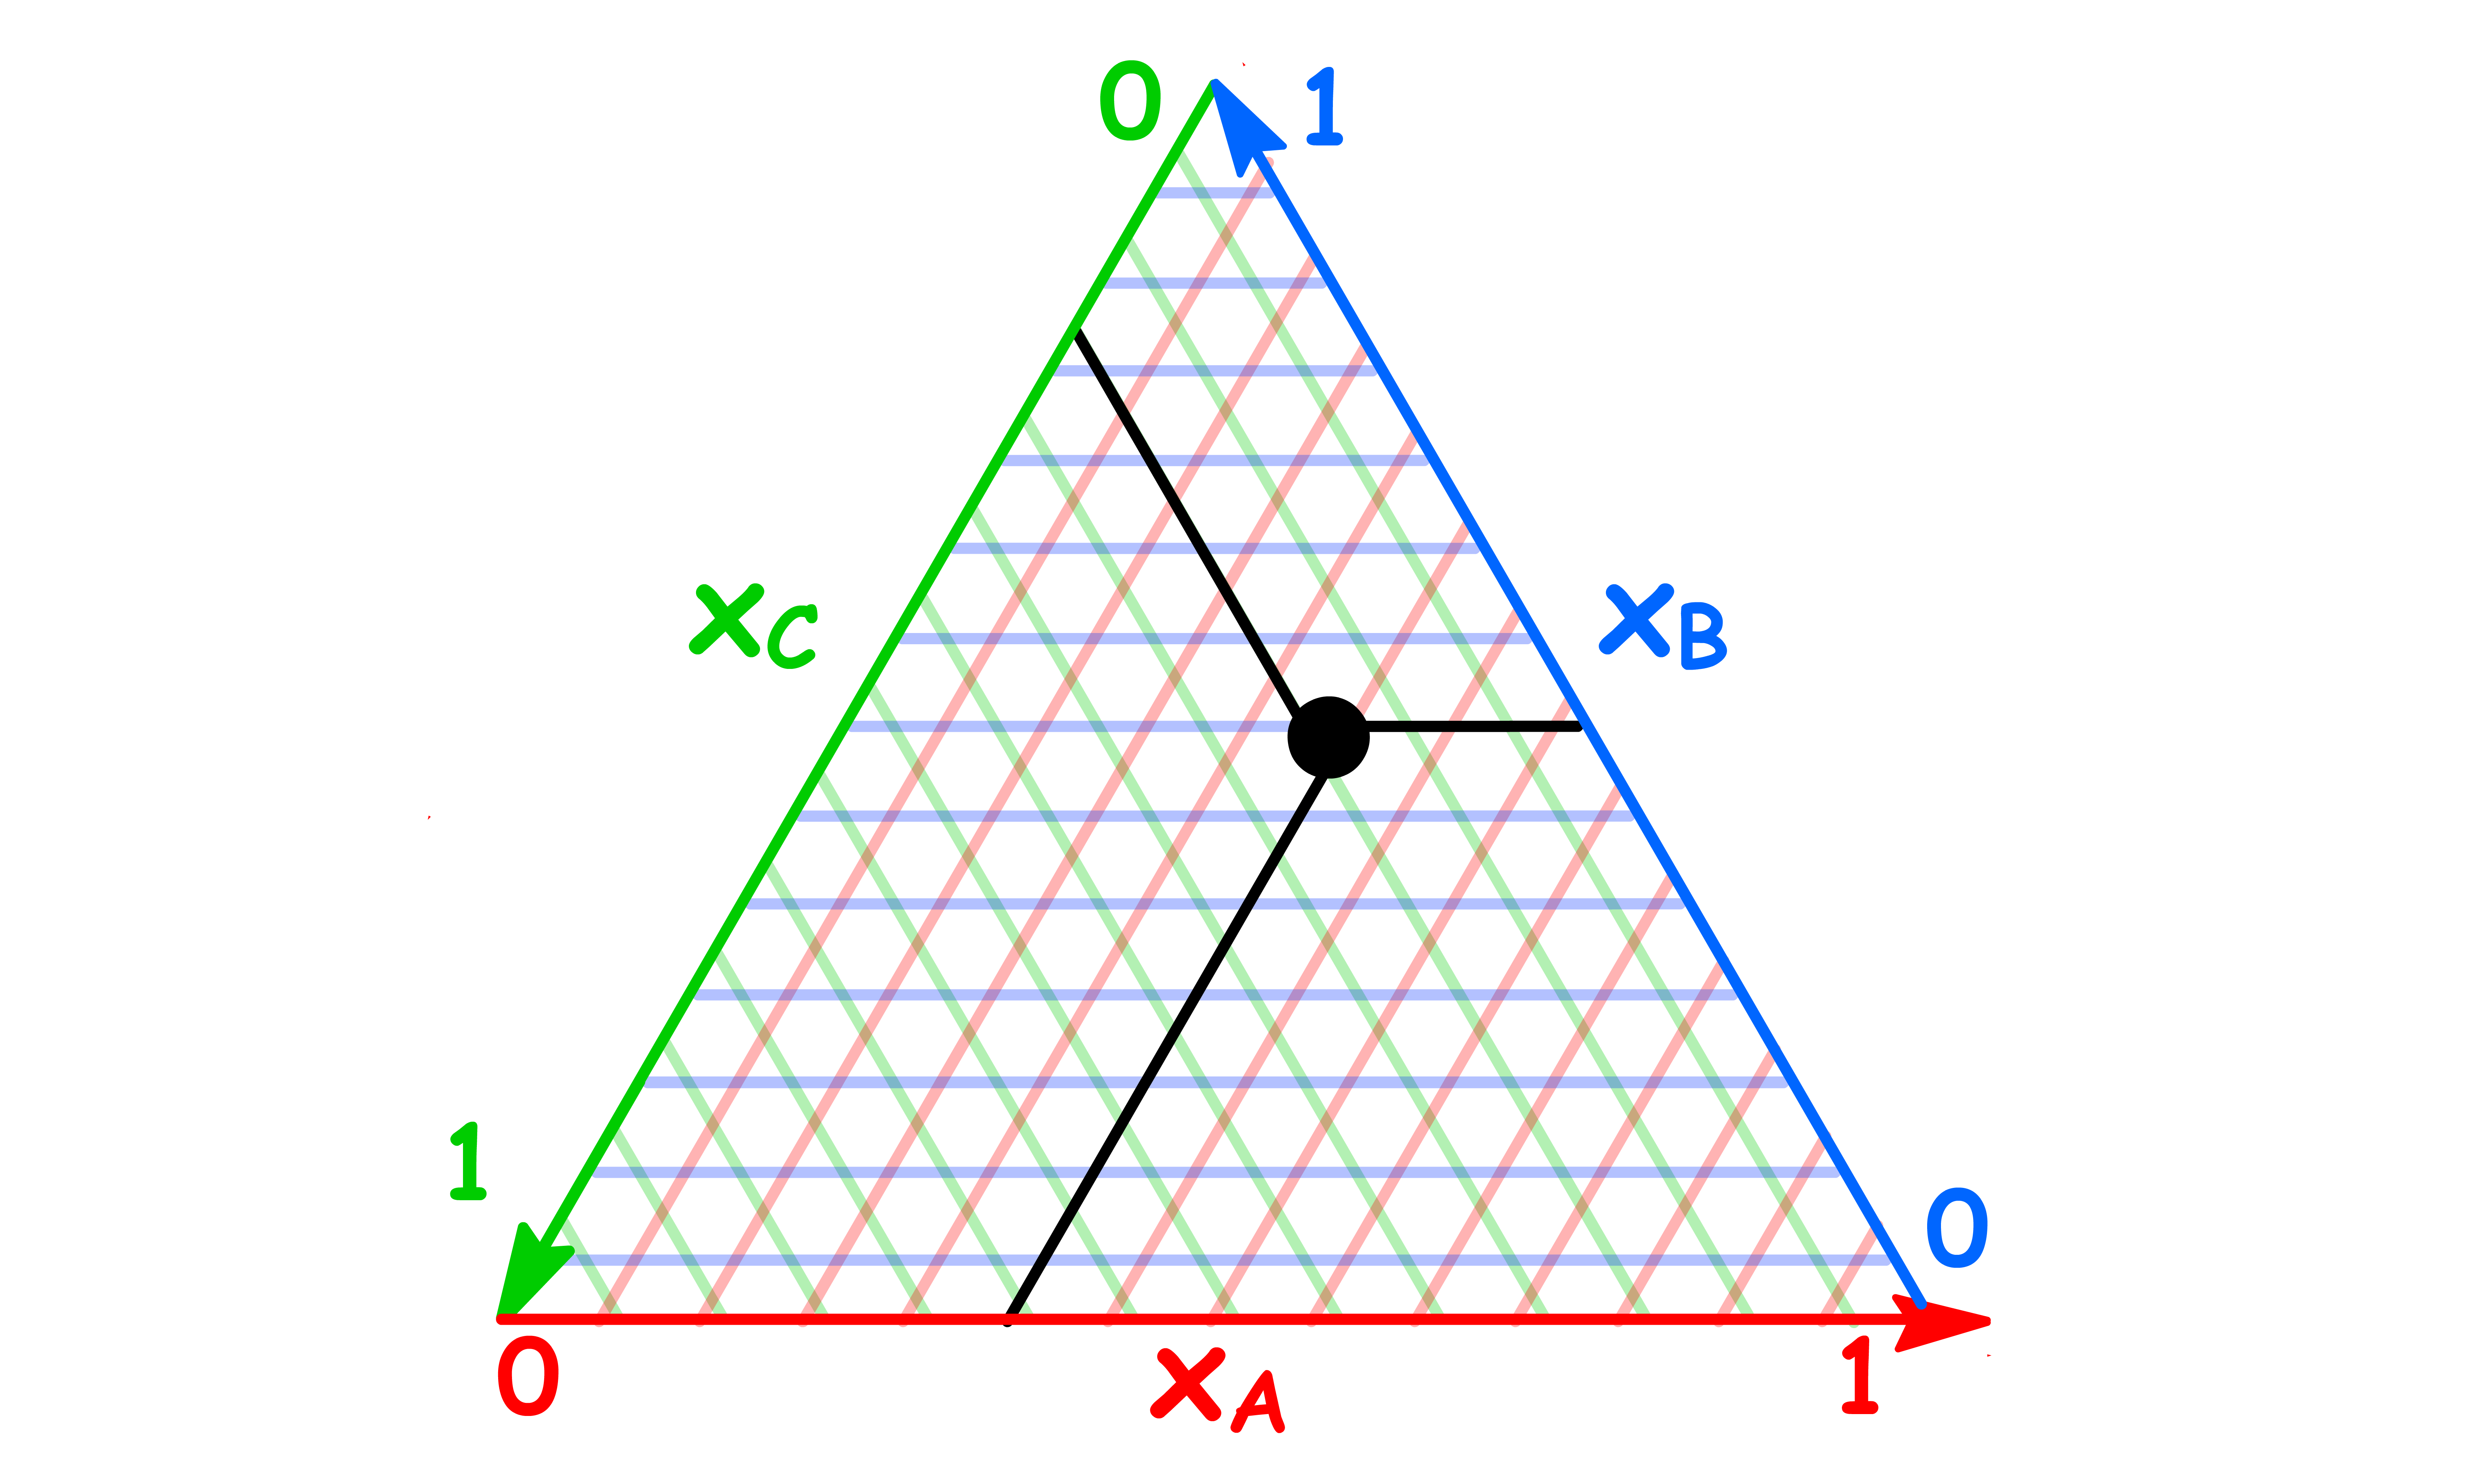
In order to make a 2-dimensional plot for tenary systems, we shall use the triangular plot
- Each side of the equilateral triangle represents the mole fraction of component A, B and C respectively
- The reason why we employ a triangular graph is because it ensures that
- We can identify the mole fraction of component A, B and C by drawing a line from the composition point to the edges of the triangle as shown below
¶ Partially miscible Liquids
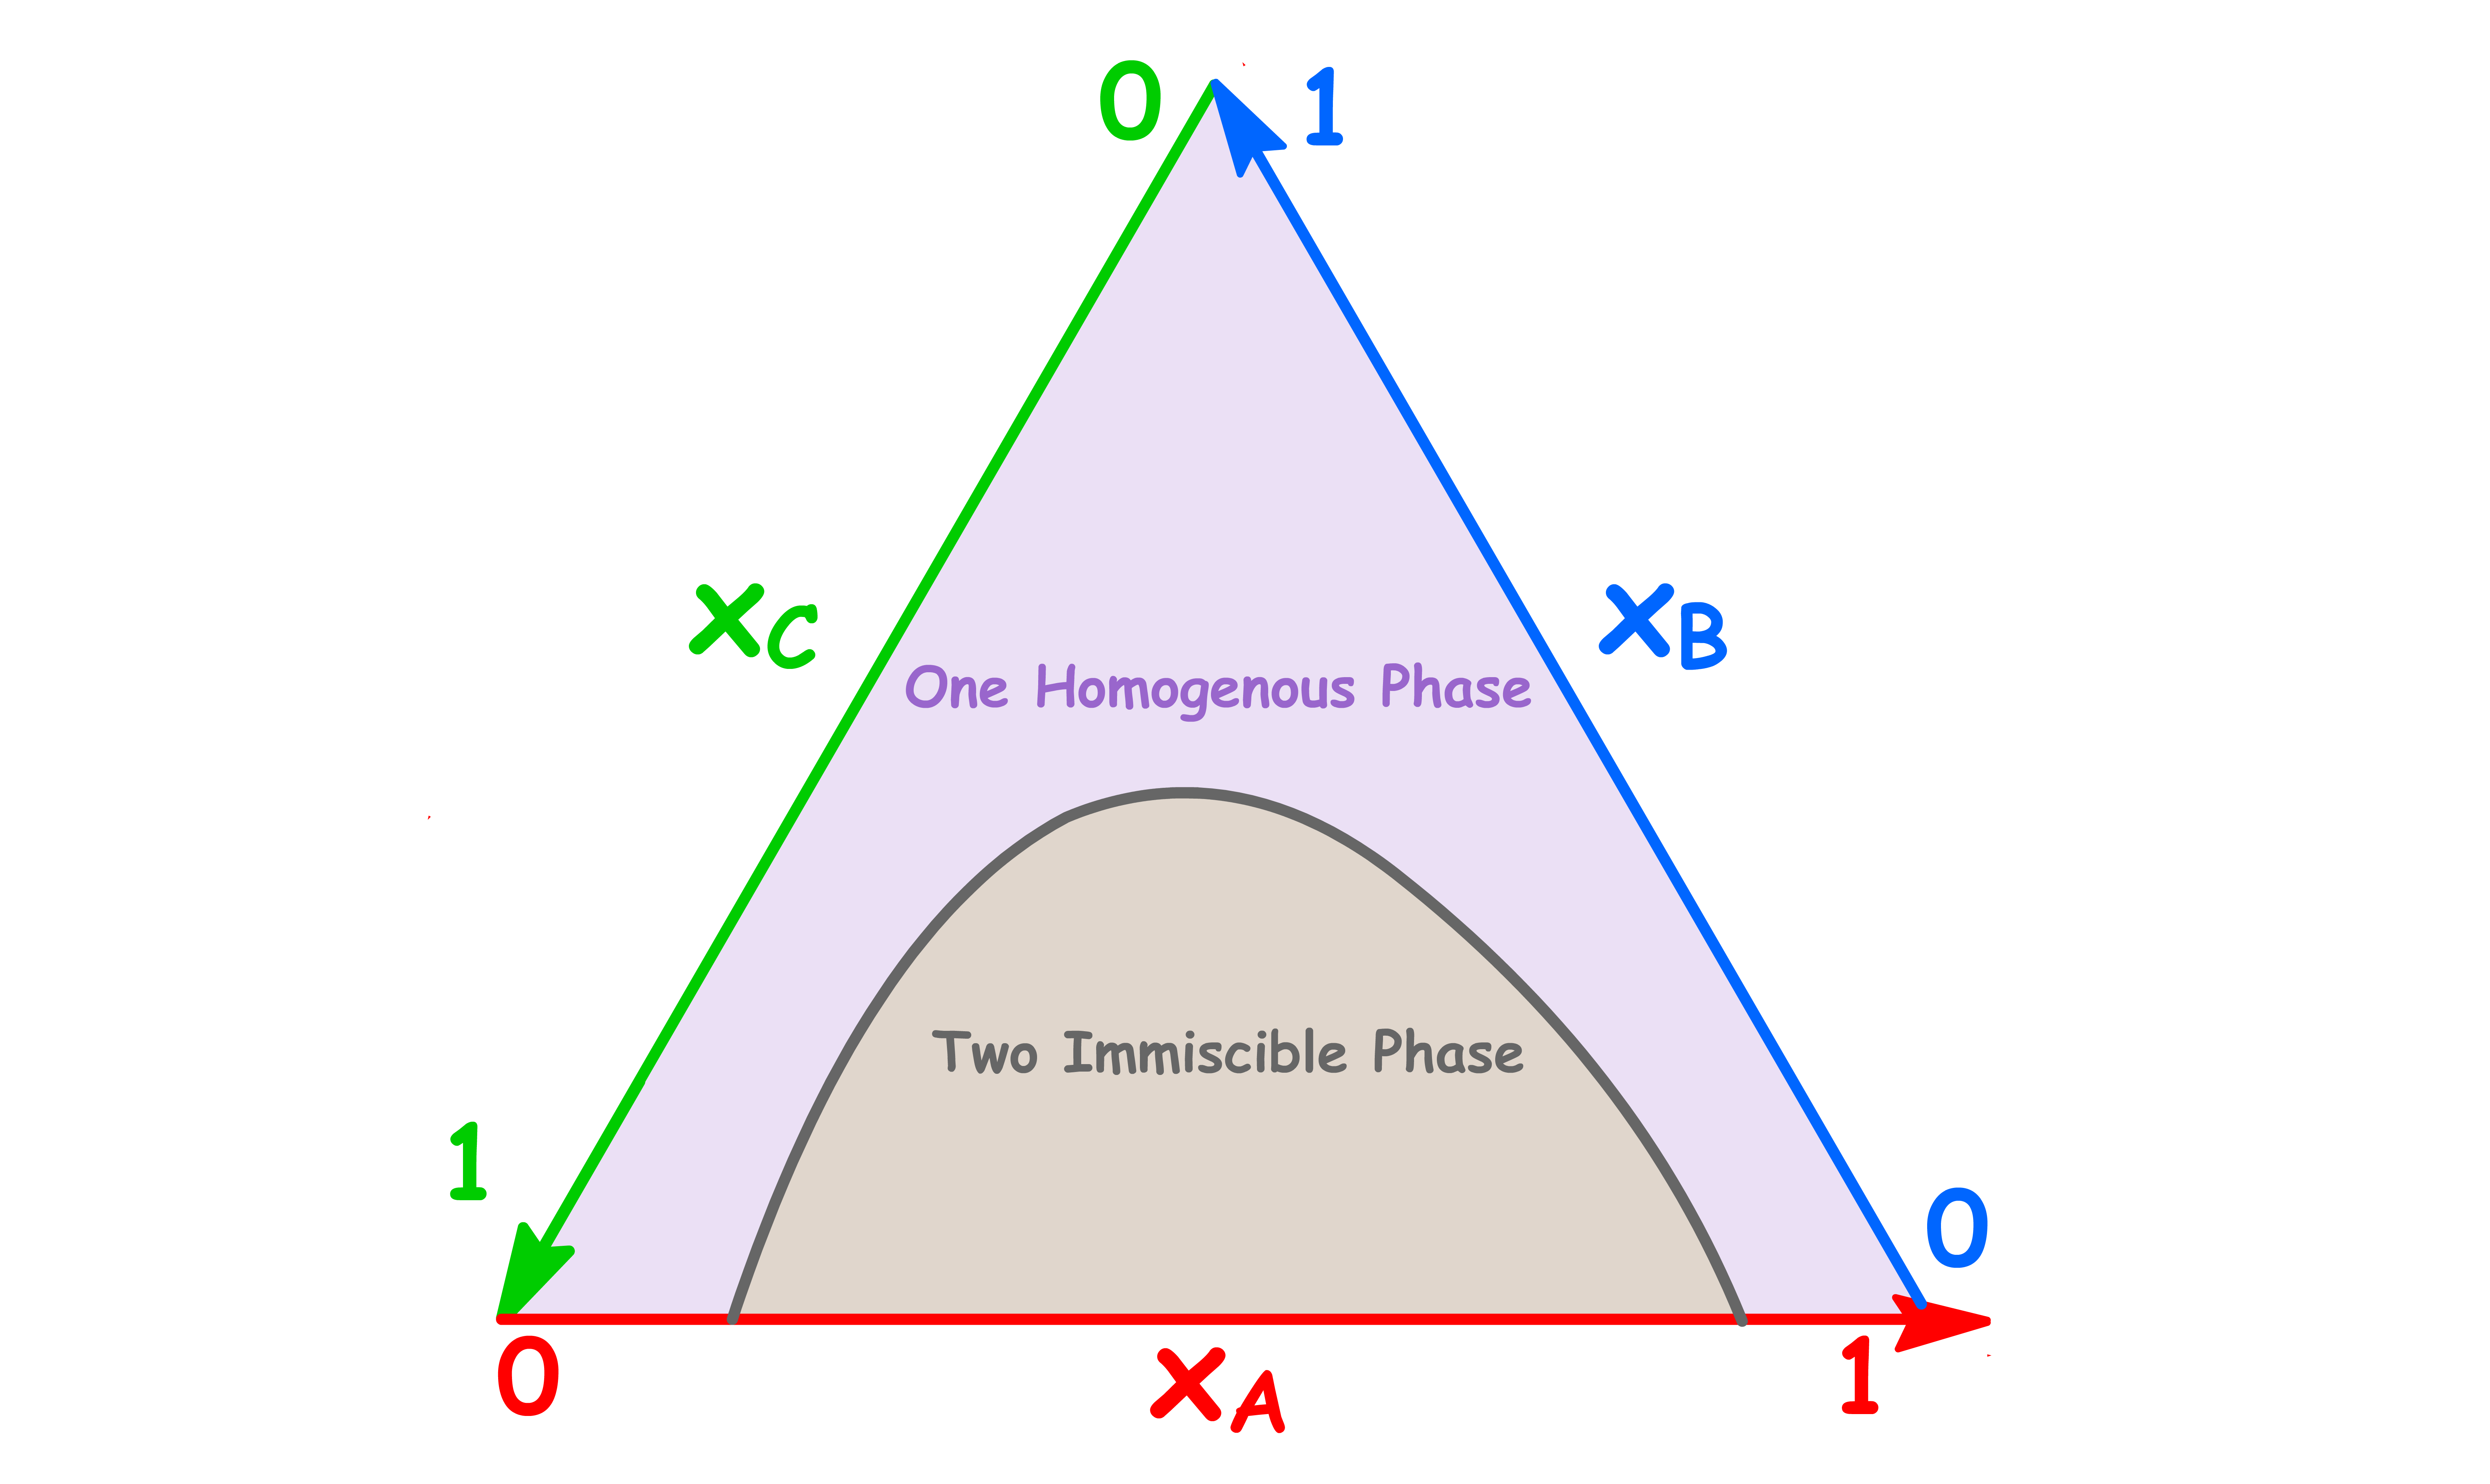
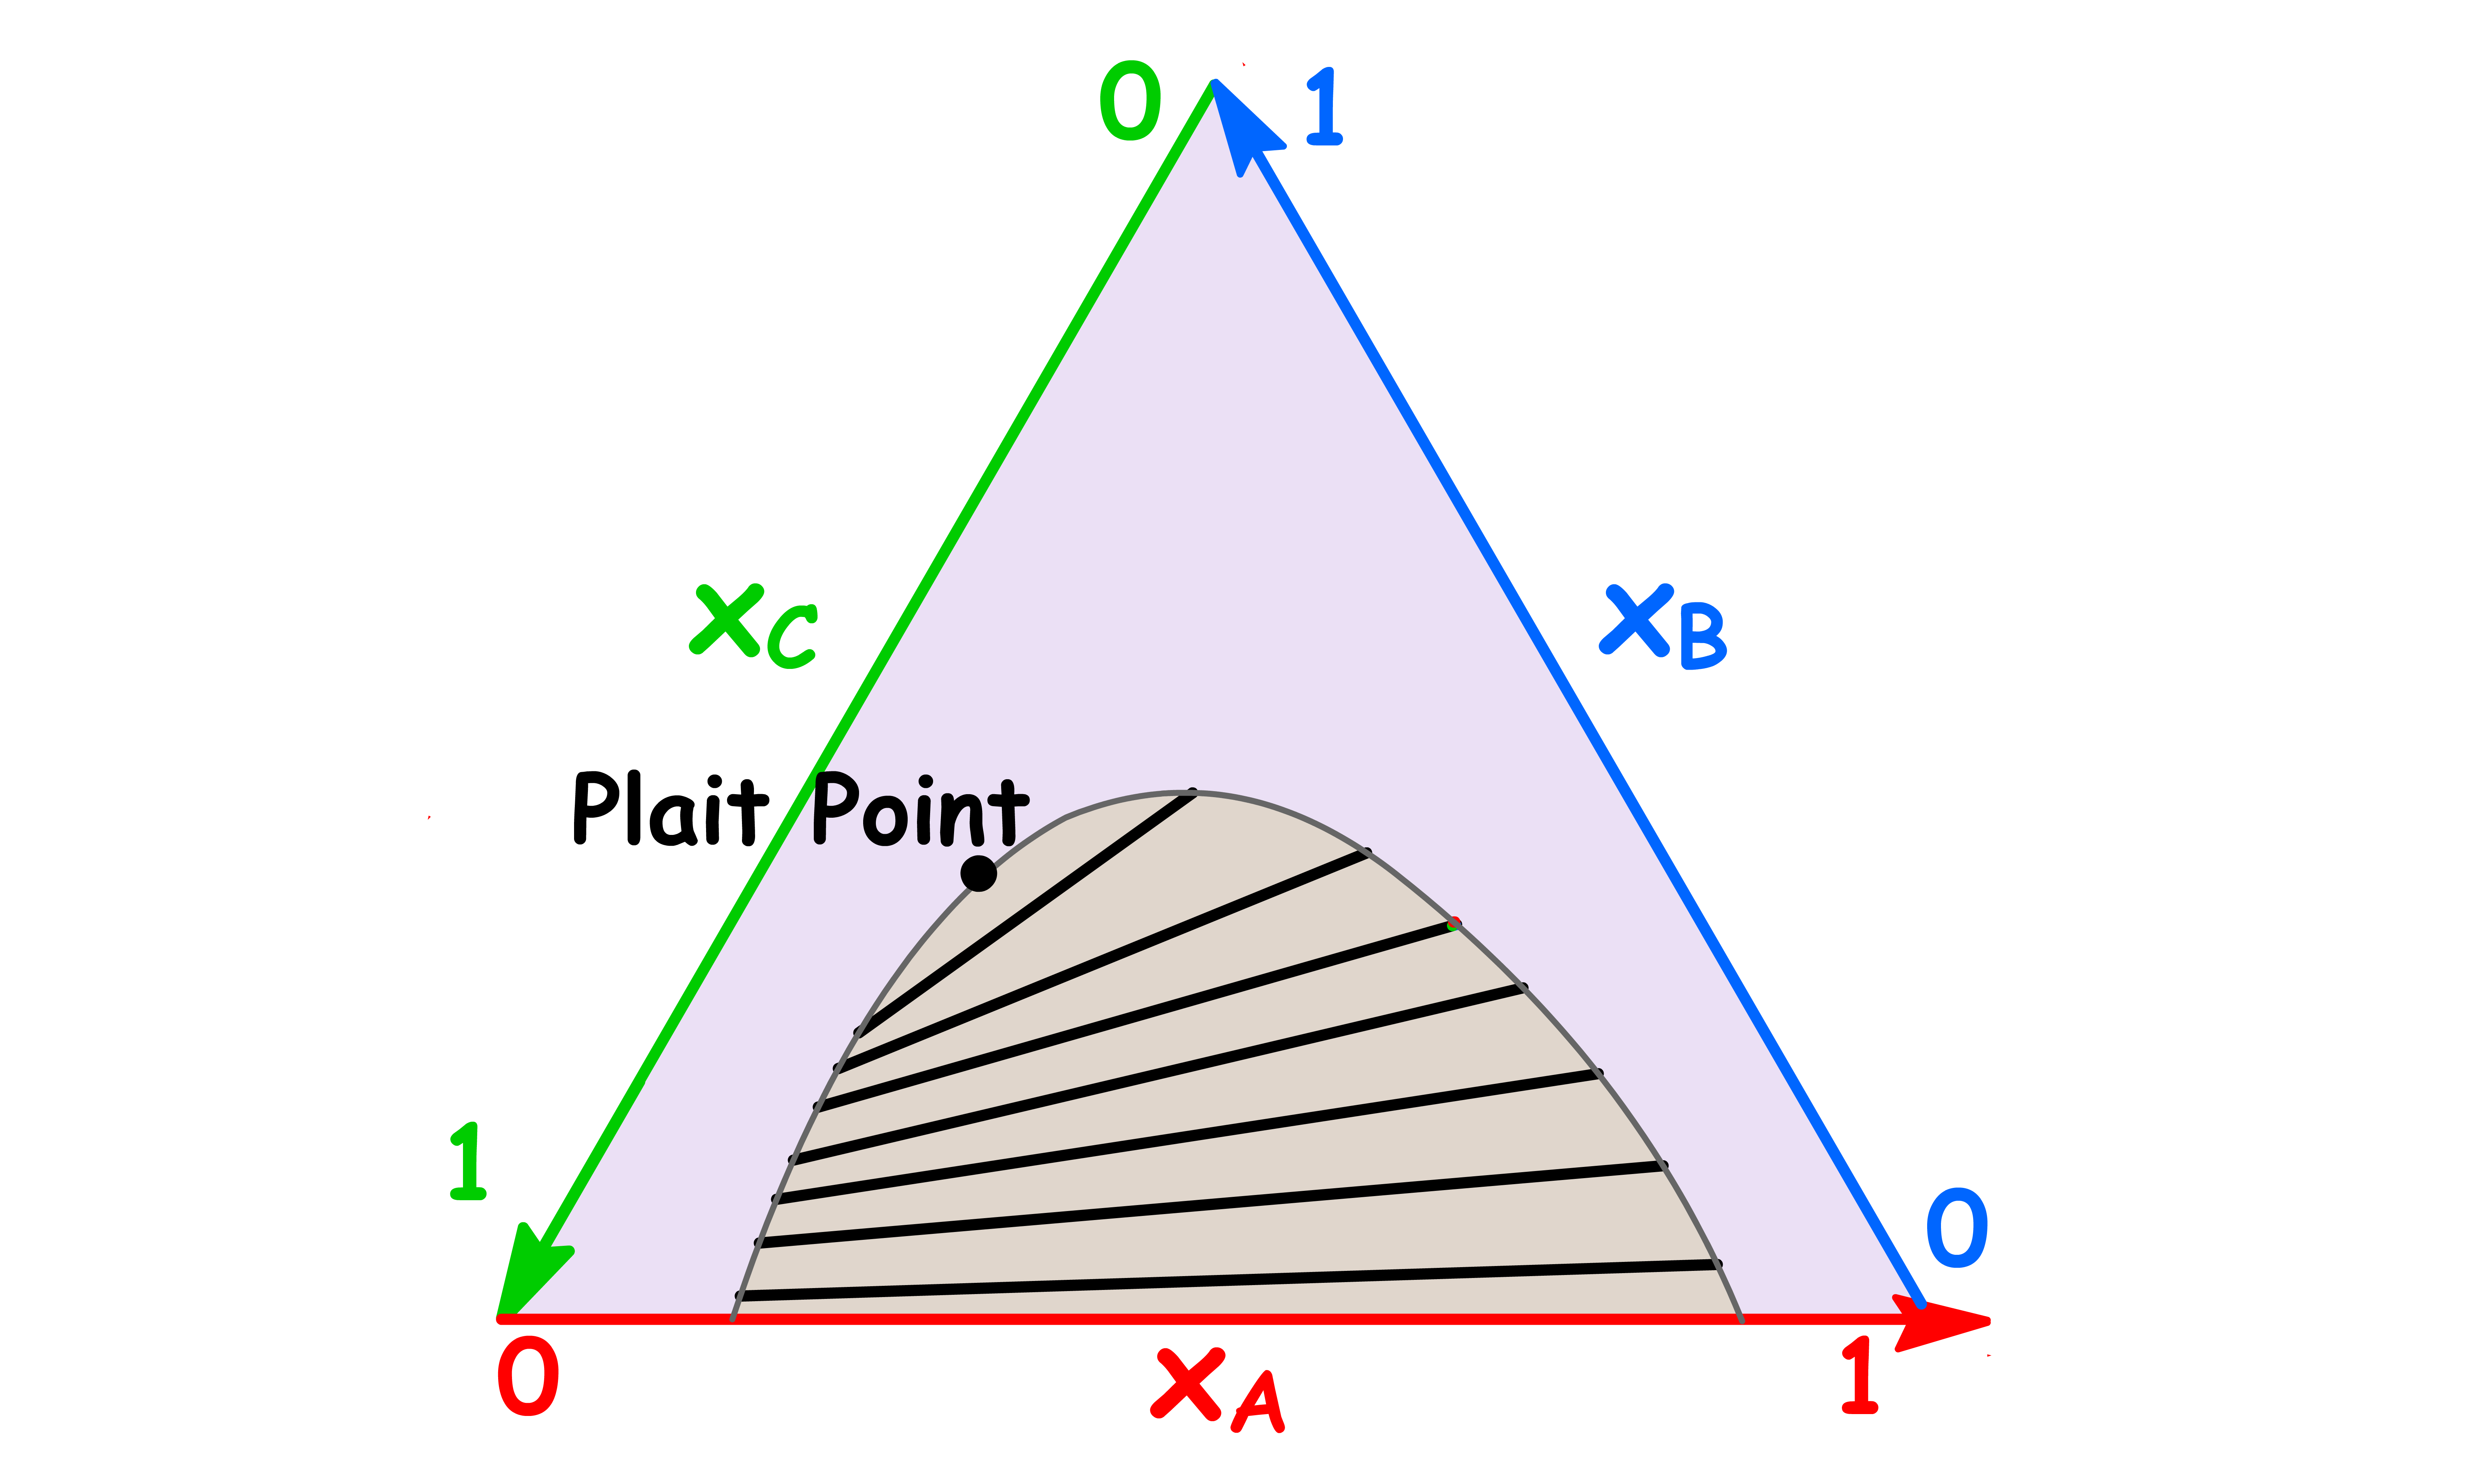
We can use the triangular plot to illustrate liquid-liquid phase diagrams
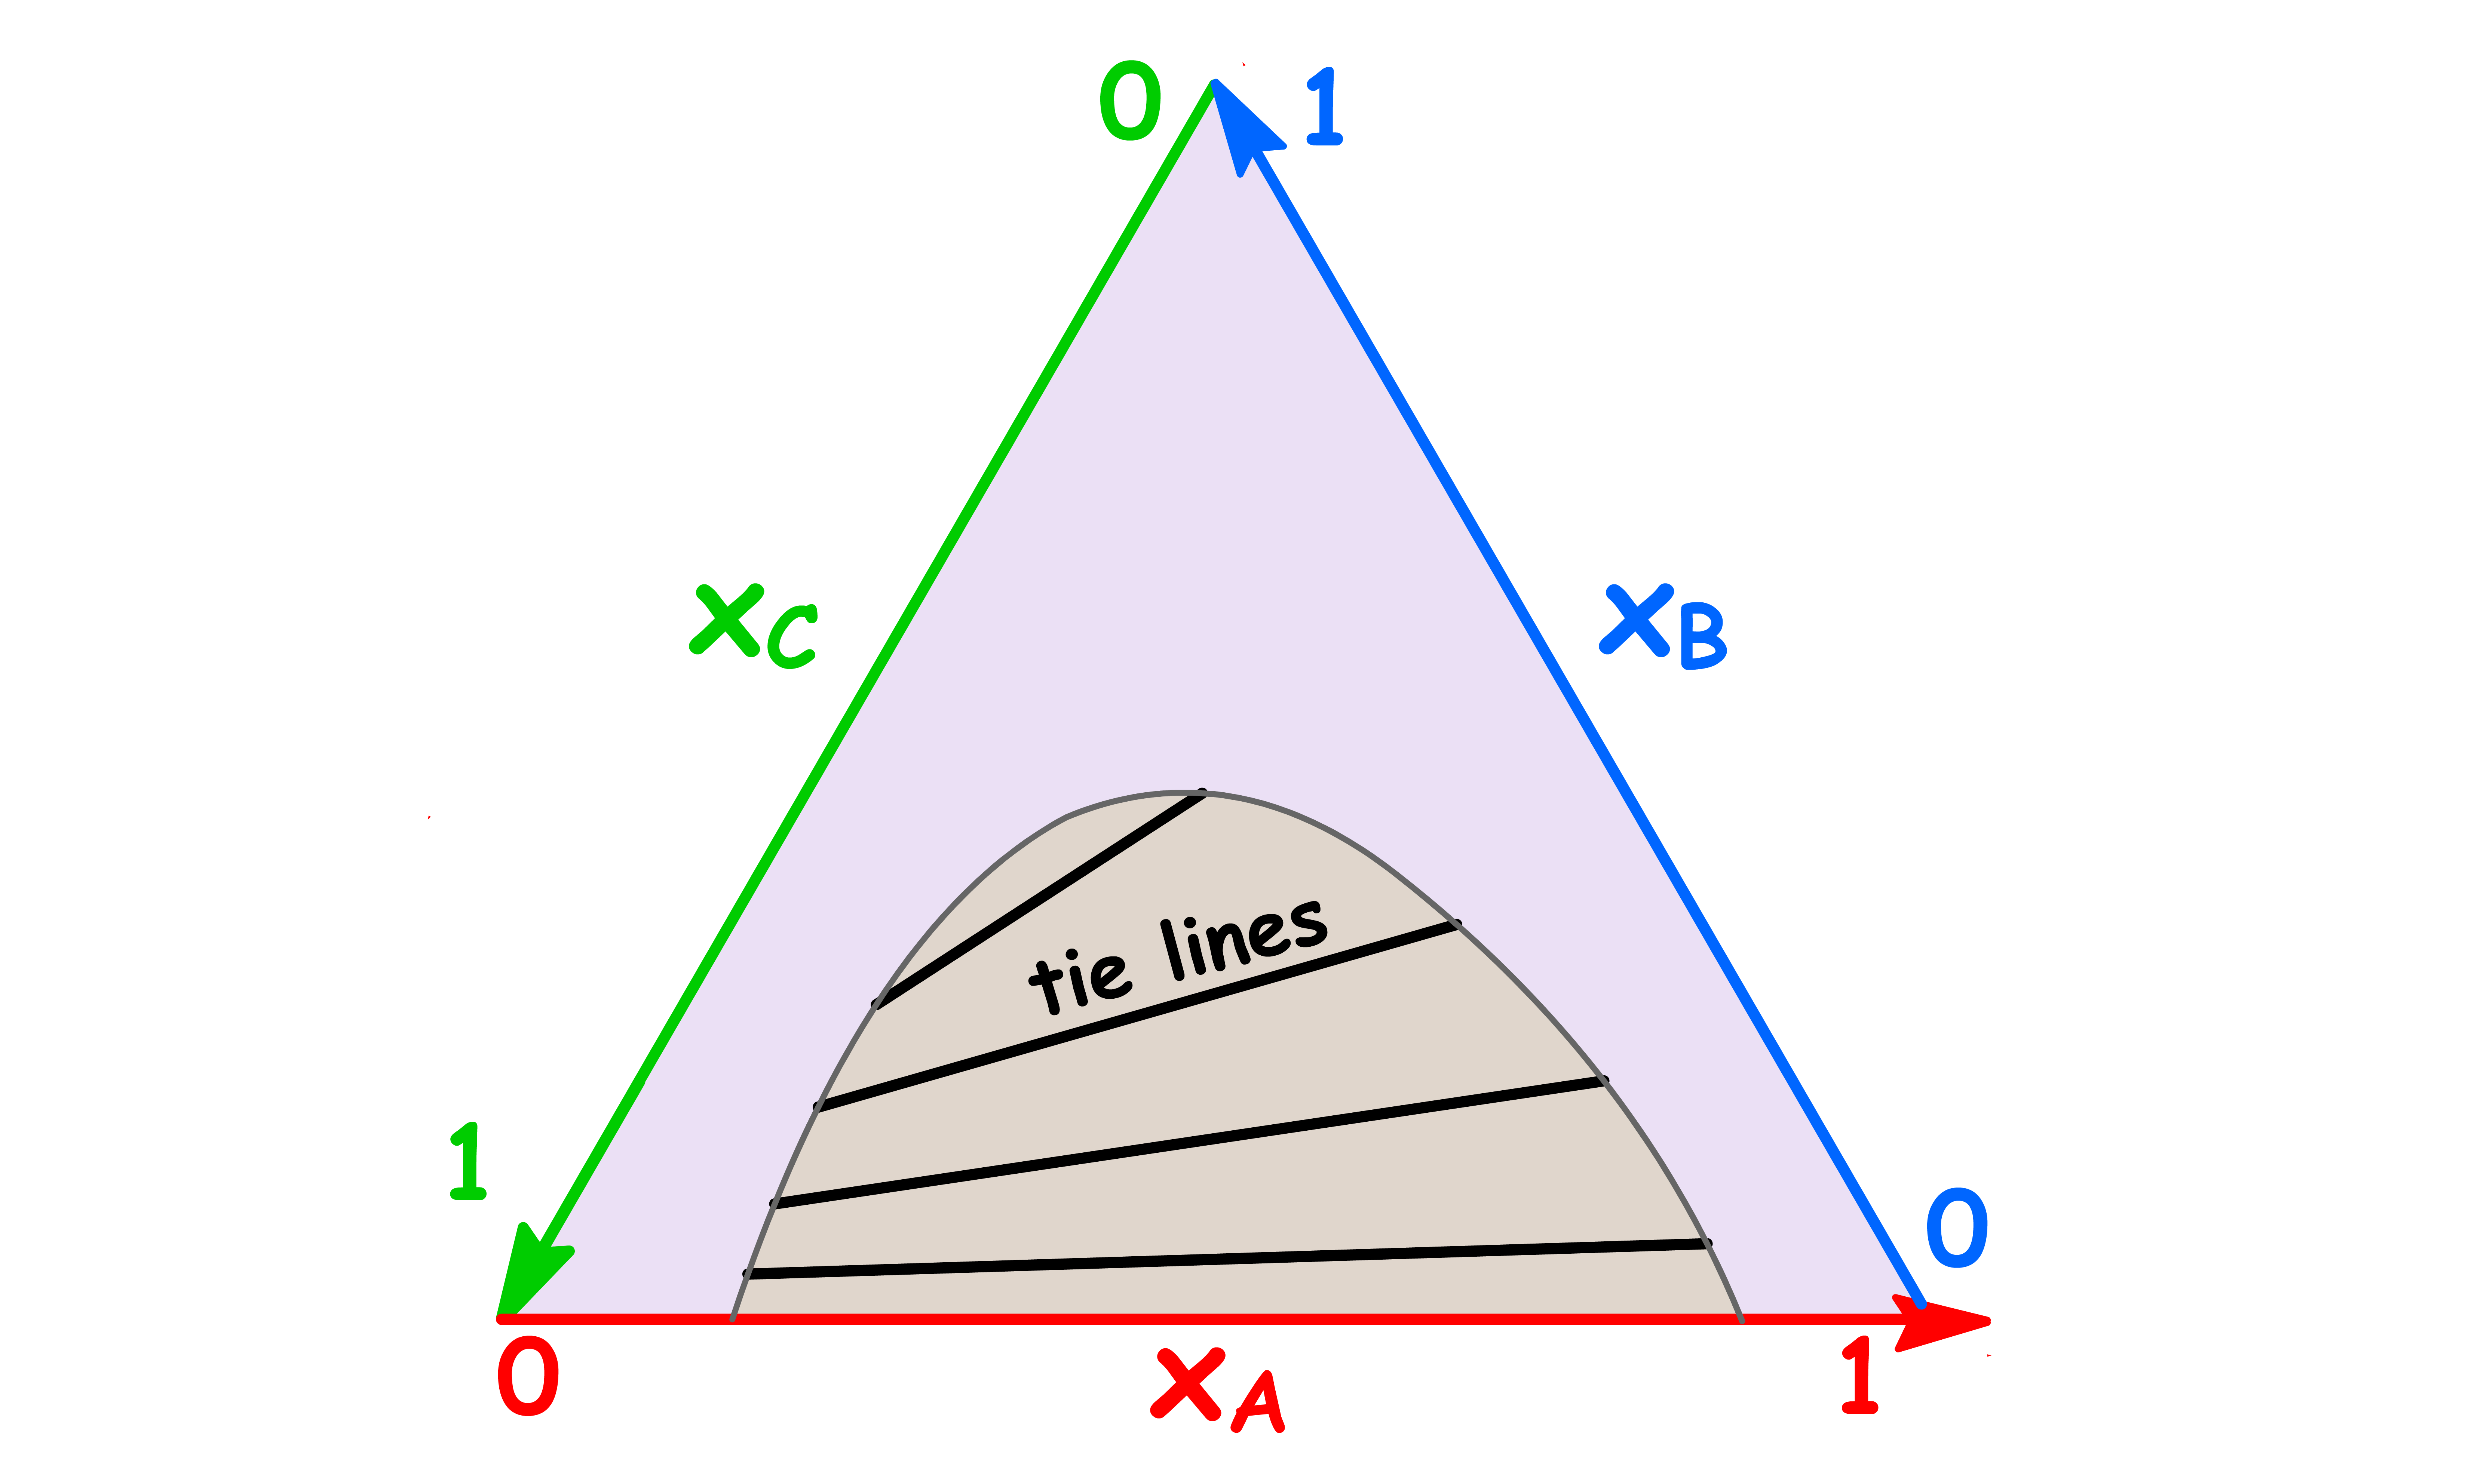
- On a triangular phase diagram, there is clearly no need for tie lines to be horizontal, and the phase diagram is incomplete unless tie lines are drawn in the two-phase region
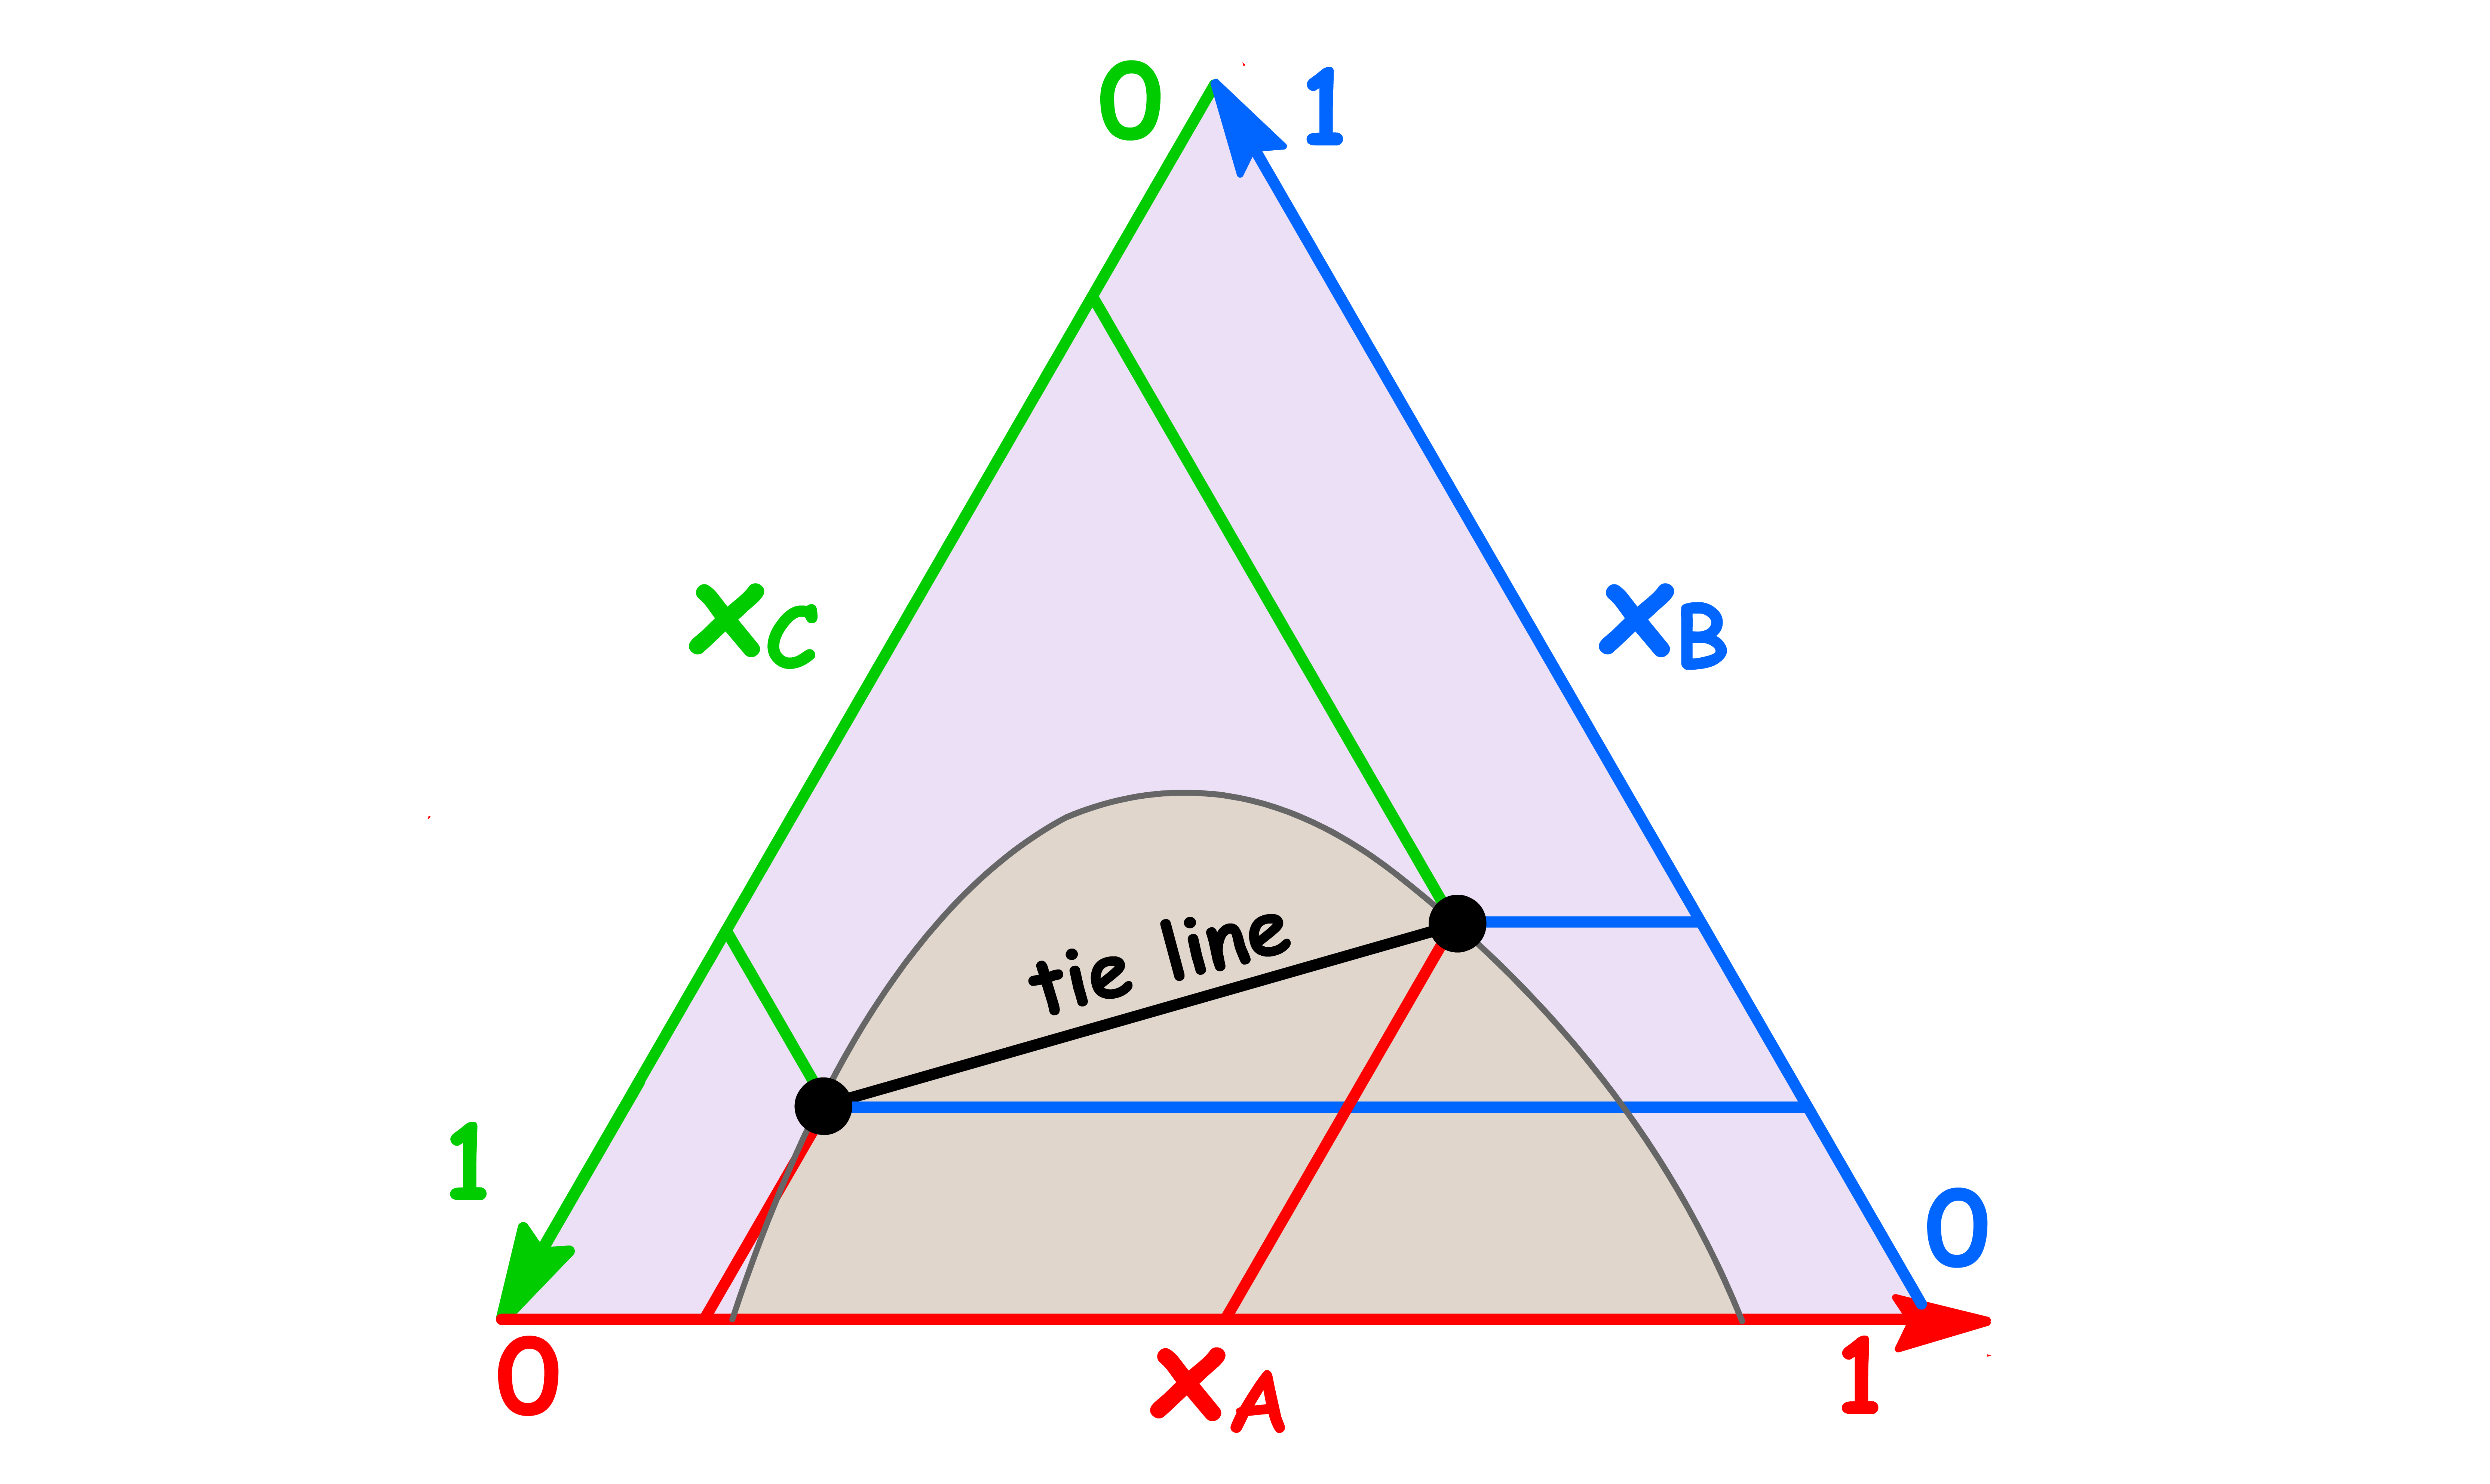
- The tie lines in the two-phase region are constructed experimentally by determining the compositions of the two phases and marking them on the diagram
- Just like a regular tie line, the coordinates of the end point of the tie line tells us the composition of the two immiscible phases
- All the tie lines are converging to the plait point
- At the plait point, the composition of the two phases become identical
